2015 Metro Area Population Estimates and Peer Comparison


As promised, here are the 2015 metro area population estimates for Columbus and its regional and national peers.

2015 Metro Population Estimates
Chicago, IL: 9,551,031
Detroit, MI: 4,302,043
Minneapolis, MN: 3,524,583
St. Louis, MO: 2,811,588
Charlotte, NC: 2,426,363
Portland, OR: 2,389,228
Orlando, FL: 2,387,138
San Antonio, TX: 2,384,075
Pittsburgh, PA: 2,353,045
Sacramento, CA: 2,274,194
Cincinnati: 2,157,719
Las Vegas, NV: 2,114,801
Kansas City, MO: 2,087,471
Cleveland: 2,060,810
Columbus: 2,021,632
Austin, TX: 2,000,860
Indianapolis: 1,988,817
San Jose, CA: 1,976,836
Nashville, TN: 1,830,345
Virginia Beach, VA: 1,724,876
Providence, RI: 1,613,070
Milwaukee, WI: 1,575,747
Grand Rapids, MI: 1,038,583
Omaha, NE: 915,312
Dayton: 800,909
Akron: 704,243
Toledo: 605,956
Youngstown: 549,885
2015 metro area population estimates

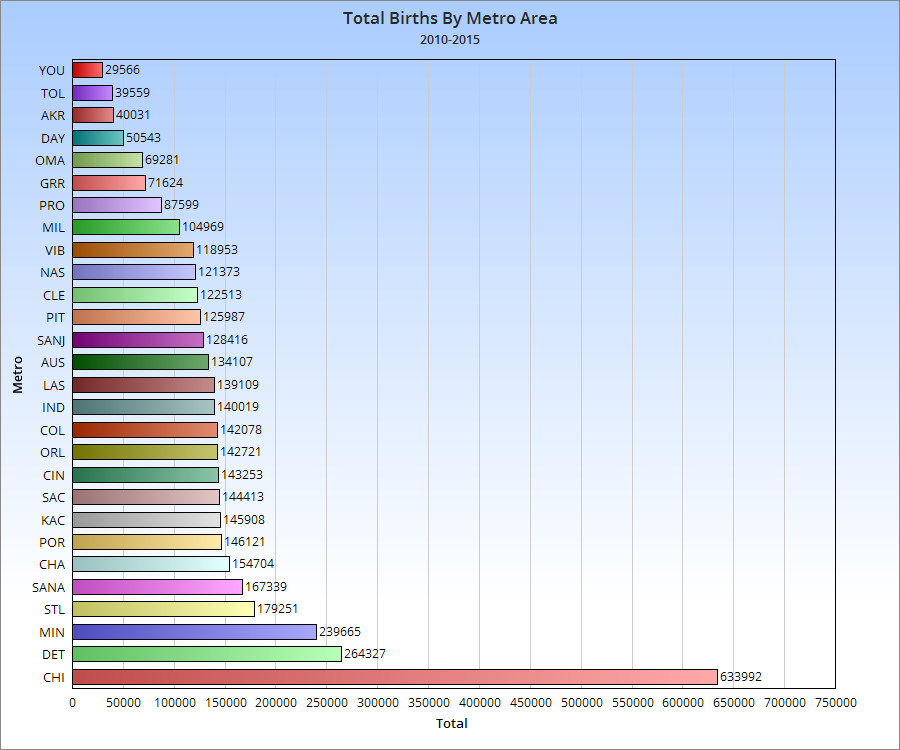
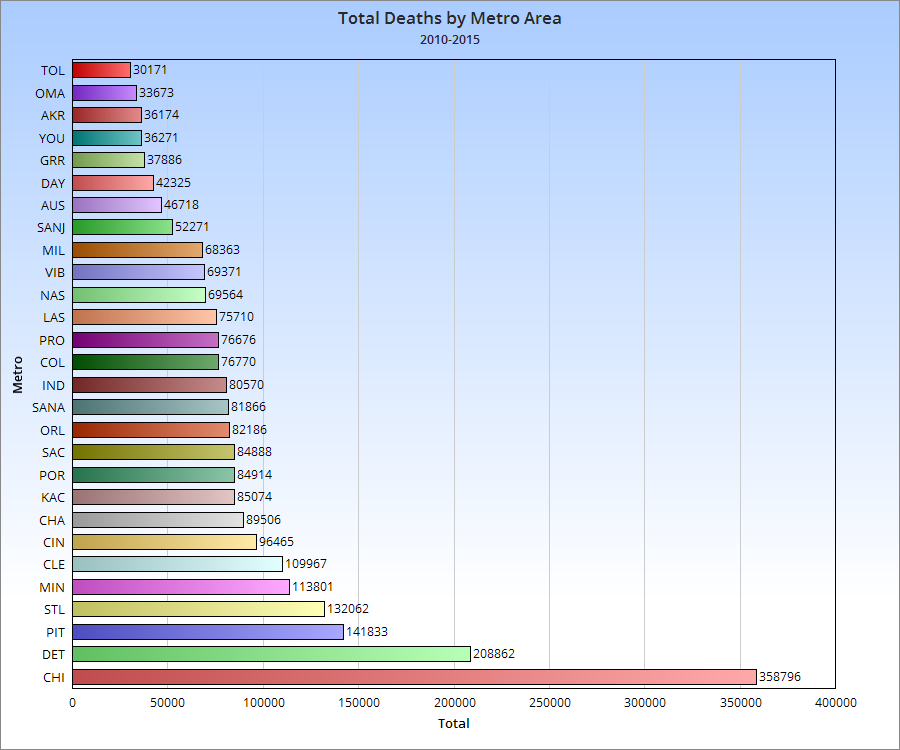
Components of Metro Area Population Change


As you can see, while Columbus has a middle of the road birth rate for its peers, its relatively low death rate means that it manages to be near the top of the its peer group in natural growth.


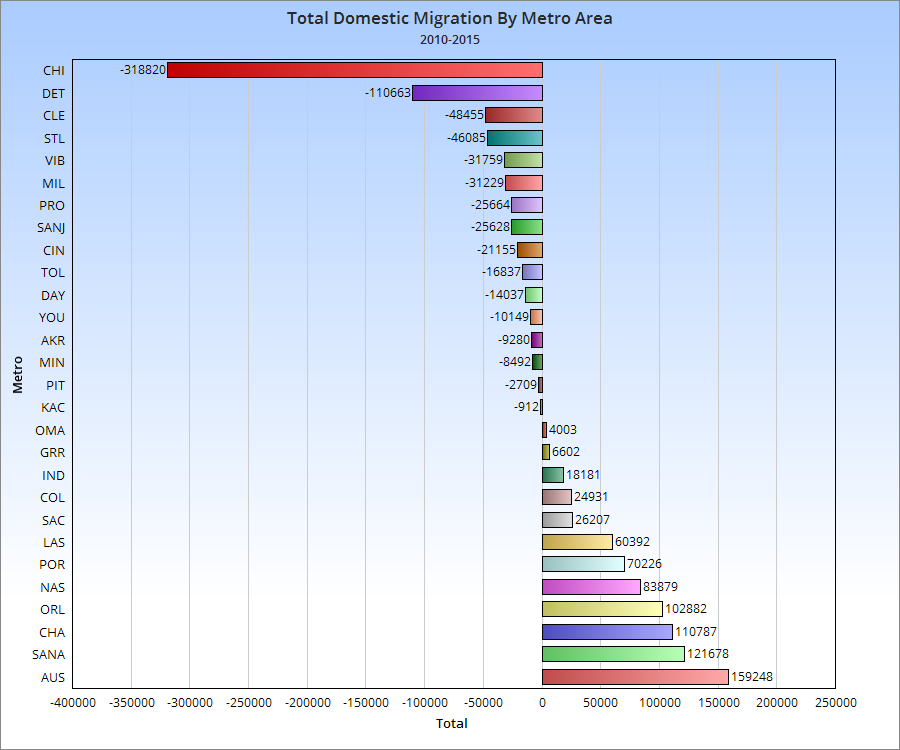
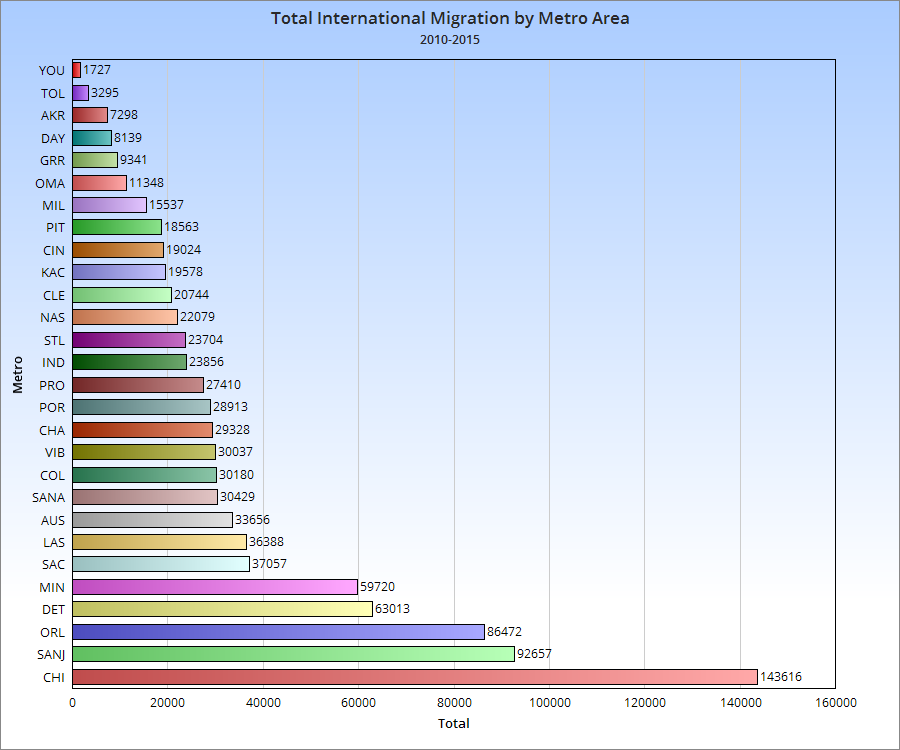
It seems that while international migration is competitive with peers in the Columbus metro, domestic migration would need to improve to truly be at the upper peer level. At the very least, it is positive.

For more local and national population and demographic data, visit:
Demographics and Population
US Census


2013 Ohio Metro Area Population Estimates


2013 Ohio metro area population estimates

The US Census released the latest population estimates for metropolitan/micropolitan areas as well as counties for the year July 1, 2012 to July 1, 2013. Here is what they found for Columbus and Ohio metros.

2013 Metro Population, Highest to Lowest
1. Cincinnati: 2,137,406
2. Cleveland: 2,064,725
3. Columbus: 1,967,066
4. Dayton: 802,489
5. Akron: 705,686
6. Toledo: 608,145
7. Youngstown: 555,506
8. Canton: 403,707
9. Springfield: 136,167
10. Mansfield: 121,773
11. Lima: 105,298

2012-2013 Total Population Change, Highest to Lowest
1. Columbus: +22,129
2. Cincinnati: +8,097
3. Akron: +729
4. Canton: +28
5. Cleveland: -14
6. Lima: -31
7. Springfield: -268
8. Toledo: -336
9. Dayton: -696
10. Mansfield: -812
11. Youngstown: -2,989

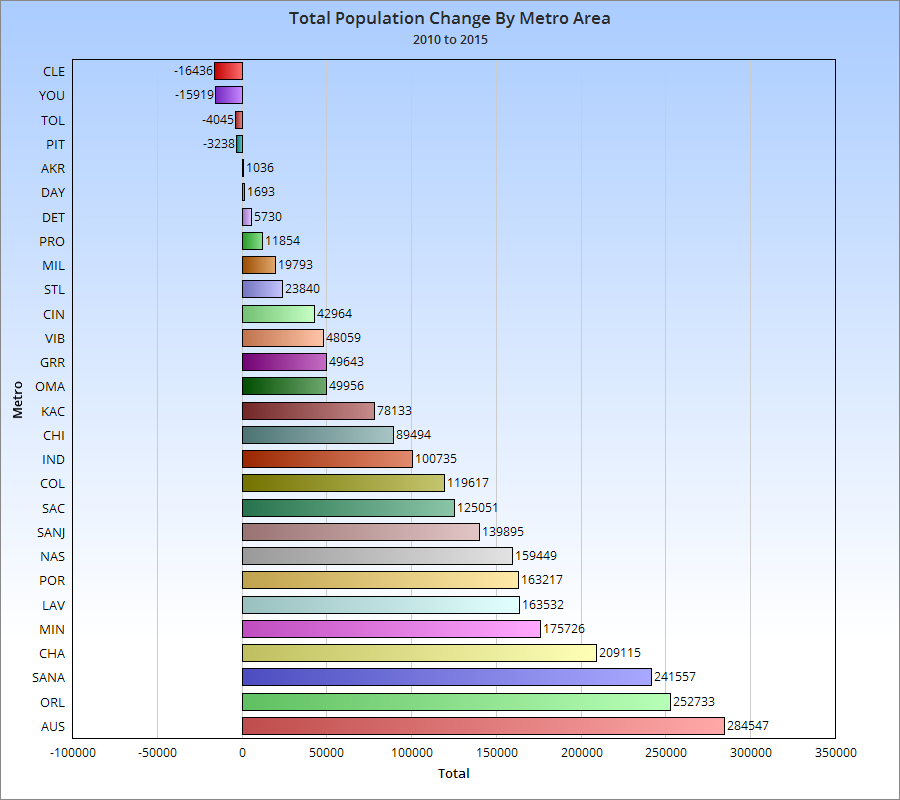
Columbus leads the pack, and by a lot. Some interesting notes about these numbers is that half of the 8 major metros are growing. Also of significance is that Cleveland barely lost at all, which may indicate that the losses there are slowing down.

Now let’s take a look at where the population changes for these metros are coming from.

Total Metro Births, 2012-2013, Highest to Lowest
1. Cincinnati: +27,366
2. Columbus: +26,464
3. Cleveland: +23,204
4. Dayton: +9,407
5. Akron: +7,548
6. Toledo: +7,198
7. Youngstown: +5,459
8. Canton: +4,349
9. Springfield: +1,577
10. Mansfield: +1,362
11. Lima: +1,245

Total Metro Deaths, 2012-2013, Highest to Lowest
1. Cleveland: -20,326
2. Cincinnati: -18,365
3. Columbus: -14,765
4. Dayton: -7,812
5. Akron: -6,784
6. Youngstown: -6,781
7. Toledo: -5,700
8. Canton: -4,119
9. Springfield: -1,612
10. Mansfield: -1,289
11. Lima: -1,045

Total Metro Natural Growth (Births vs. Deaths), 2012-2013, Highest to Lowest
1. Columbus: +11,699
2. Cincinnati: +9,001
3. Cleveland: +2,878
4. Dayton: +1,595
5. Toledo: +1,498
6. Akron: +764
7. Canton: +230
8. Lima: +200
9. Mansfield: +73
10. Springfield: -35
11. Youngstown: -1,322

Natural growth is a vital part of the growth picture for any place. For Columbus, it is roughly 50% of it’s total annual growth. For places like Youngstown, with more deaths than births, it just contributes to overall decline.

Total Metro Domestic Migration, 2012-2013, Highest to Lowest
1. Columbus: +5,749
2. Canton: -275
3. Lima: -308
4. Springfield: -343
5. Mansfield: -943
6. Akron: -1,011
7. Youngstown: -1,691
8. Toledo: -2,575
9. Dayton: -3,415
10. Cincinnati: -3,894
11. Cleveland: -5,581

Total Metro International Migration, 2012-2013, Highest to Lowest
1. Columbus: +4,689
2. Cleveland: +3,698
3. Cincinnati: +3,326
4. Dayton: +1,148
5. Akron: +1,051
6. Toledo: +674
7. Canton: +261
8. Youngstown: +185
9. Springfield: +78
10. Lima: +75
11. Mansfield: +23

Total Metro Migration, 2012-2013, Highest to Lowest
1. Columbus: +10,438
2. Akron: +40
3. Canton: -14
4. Lima: -233
5. Springfield: -265
6. Cincinnati: -568
7. Mansfield: -920
8. Youngstown: -1,506
9. Cleveland: -1,883
10. Toledo: -1,901
11. Dayton: -2,267

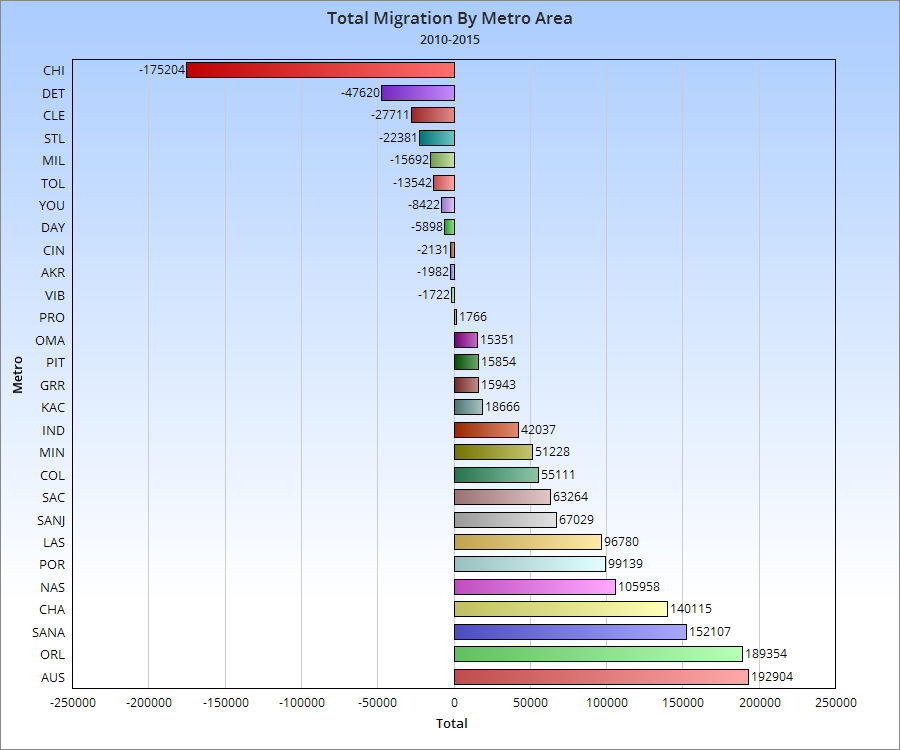
The 2nd most important part of the growth rate, migration, is also pretty bad for most metros. Only Columbus is seeing a decent rate of growth, particularly domestically.

One final question is… how are these metro growth rates changing over time? That’s a bit harder to answer, as metro boundaries change so often that it’s more difficult to determine comparable rates decade to decade. However, this is what I came up with.

Average Annual Metro Growth By Decade
Akron

1970s: -1,891
1980s: -275
1990s: +3,739
2000s: +824
2010s: +622
Cincinnati
1970s: +6,119
1980s: +9,111
1990s: +16,474
2000s: +12,052
2010s: +7,609
Cleveland
1970s: -15,108
1980s: -8,090
1990s: +4,624
2000s: -7,090
2010s: -4,172
Columbus
1970s: +9,953
1980s: +13,487
1990s: +20,752
2000s: +22,384
2010s: +21,697
Dayton
1970s: -2,246
1980s: +1,377
1990s: +432
2000s: -665
2010s: +1,089
Lima
1970s: +110
1980s: -249
1990s: -128
2000s: -214
2010s: -337
Mansfield
1970s: +121
1980s: -509
1990s: -272
2000s: -438
2010s: -901
Springfield
1970s: -688
1980s: -270
1990s: -280
2000s: -641
2010s: -722
Toledo
1970s: +1,350
1980s: -278
1990s: +503
2000s: -776
2010s: -619
Youngstown
1970s: -470
1980s: -4,605
1990s: -1,064
2000s: -3,719
2010s: -3,422

Some improved, especially the larger metros. Smaller ones tended to do worse over time.

For more information, click on the below links:
Metro Area Demographics
Columbus vs. Other Places
US Census