This collection of photos from the 1920s show the East Broad Street Boulevard. Modeled after European cities like Paris, the boulevard featured tree-lined medians that separated parked vehicles and a slower drive lane from the main traffic lanes. The boulevard, also known as the Broad Street Parkway, was in place for many years until it was ultimately removed beginning in 1932. The decision to remove the medians was to widen Broad to facilitate more car traffic.
Category Archives: Columbus History
Winter 2025-2026 Running Tally
**Here are this winter’s running statistical tally of Winter 2025-2026.
Cold Season data is for October-April, while Winter Season data is December-February only.
**Last Updated: 4/10/2026- Updated through March 31st, 2026
Temperatures
Average High Temperature
October: 67.7
November: 51.6
December: 39.8
January: 32.7
February: 40.5
March: 60.4
Cold Season Average High to Date: 48.9
Cold Seasond Average High Departure to Date: +0.8
Winter Season Average High: 37.6
Winter Season Average High Departure: -2.3
Mean High Departure from Normal
October: +2.2
November: -0.7
December: -1.7
January: -4.4
February: -0.3
March: +9.3
Average Low Temperature
October: 46.8
November: 34.1
December: 23.8
January: 15.7
February: 22.4
March: 38.5
Cold Season Average Low to Date: 30.3
Cold Season Average Low Departure to Date: -0.6
Winter Season Average Low: 20.6
Winter Season Average Low Departure: -4.0
Mean Low Departure from Normal
October: +2.0
November: -0.9
December: -3.8
January: -6.3
February: -0.4
March: +6.5
Mean Temperature
October: 57.3
November: 42.9
December: 31.8
January: 24.2
February: 31.5
March: 49.5
Cold Season Average Mean to Date: 39.5
Cold Season Average Mean Departure to Date: 0.0
Winter Season Average Mean: 29.1
Winter Season Average Mean Departure: -3.1
Mean Departure from Normal
October: +2.1
November: -0.7
December: -2.7
January: -5.4
February: -1.0
March: +7.9
Coldest High Temperature
October: 51 on the 22nd and 30th
November: 33 on the 10th
December: 18 on the 14th
January: 12 on the 28th
February: 19 on the 5th
March: 27 on the 17th
Coldest Low Temperature
October: 34 on the 24th and 25th
November: 19 on the 29th
December: 1 on the 15th
January: -9 on the 31st
February: 0 on the 2nd
March: 20 on the 17th and 18th
Coldest Mean Temperature
October: 46 on the 24th and 30th
November: 28.5 on the 10th and 29th
December: 10 on the 15th
January: 2 on the 28th
February: 10.5 on the 5th
March: 23.5 on the 17th
Warmest High Temperature
October: 85 on the 4th
November: 67 on the 5th
December: 68 on the 28th
January: 65 on the 9th
February: 65 on the 18th
March: 86 on the 22nd
Warmest Low Temperature
October: 59 on the 7th
November: 49 on the 15th
December: 40 on the 28th
January: 39 on the 9th
February: 48 on the 18th
March: 62 on the 31st
Warmest Mean Temperature
October: 70.5 on the 3rd and 4th
November: 57.5 on the 15th
December: 54 on the 28th
January: 52 on the 9th
February: 56.5 on the 18th
March: 70.5 on the 31st
Temperature Records
October
None
November
None
December
A record daily high was tied on the 28th. The high of 68 degrees tied the previous record set in 1984.
January
A record daily high was set on the 9th. The high of 65 degrees broke the old record of 62 set in 1946 and 1949.
A record daily low was set on the 31st. The low of -9 degrees broke the old record of -6 set in 2004.
The period of January 24-January 31st featured 8 consecutive highs below 20 degrees. This ties the record for the longest such consecutive streak, matching similar records set 1/10-1/17/1893 and 2/6-2/13/1899.
February
None
March
A daily record warm low was set on the 7th. The low of 59 degrees broke the old record of 56 set in 1974.
A daily record warm low was set on the 10th. The low of 56 degrees broke the old record of 53 set in 1879.
A daily record high was set on the 22nd. The high of 86 degrees broke the old record of 85 set in 2012. This also broke the record for the warmest temperature ever recorded in March.
Precipitation
Total Precipitation Days
October: 7
November: 16
December: 19
January: 21
February: 14
March: 18
Monthly Precipitation Total
October: 3.88″
November: 2.32″
December: 2.50″
January: 1.63″
February: 2.27″
March: 5.62″
Cold Season Total to Date: 18.22″
Winter Season Total to Date: 6.40″
Monthly Precipitation Departure from Normal
October: +0.98″
November: -0.57″
December: -0.63″
January: -1.37″
February: -0.14″
March: +2.00″
Cold Season Departure from Normal to Date: +0.27″
Winter Season Departure from Normal: -2.14″
Greatest Precipitation
October: 1.84″ on the 7th
November: 0.70″ on the 25th
December: 0.60″ on the 18th
January: 1.09″ on the 25th
February: 1.14″ on the 19th
March: 1.03″ on the 27th
Monthly Snowfall
October: 0″
November: 1.8″
December: 12.2″
January: 13.1″
February: 3.2″
March: 3.6″
Cold Season Total to Date: 33.9″
Winter Season Total: 28.5″
Through March 31st, the winter of 2025-2026 is the 26th snowiest on record. December was the 9th snowiest, January the 24th snowiest, February tied for 25th least snowiest and March was the 40th snowiest.
Monthly Snowfall Departure from Normal
October: -0.2″
November: +0.6″
December: +7.1″
January: +3.6″
February: -4.4″
March: -0.5″
Cold Season Snowfall Departure to Date: +6.2″
Winter Season Departure from Normal: +6.3″
Greatest Snowfall
October: 0″
November: 1.3″ on the 10th
December: 5.4″ on the 13th
January: 11.9″ on the 25th
February: 1.5″ on the 6th
March: 3.0″ on the 2nd
Precipitation Records
October
10/7/2025: Record daily precipitation of 1.84″, breaking the old record of 1.61″ set in 1998.
November
None
December
12/2/2025: Record daily snowfall of 4.7″, breaking the old record of 3.0″ set in 1936.
12/13/2025: Record daily snowfall of 5.4″, breaking the old record of 3.6″ set in 1945.
January
1/25/2026: Record daily snowfall of 11.9″, breaking the old record of 4.7″ set in 1988.
1/25/2026: Record daily precipitation of 1.09″, breaking the old record of 0.68″ set in 1952.
February
None
March
None
Largest Measurable Snowfalls by Date
1. 1/25/2026: 11.9″
2. 12/13/2025: 5.4″
3. 12/2/2025: 4.7″
4. 3/2/2026: 3.0″
5. 12/31/2025: 1.6″
6. 2/6/2026: 1.5″
7. 11/10/2025: 1.3″
8. 2/22/2026: 0.9″
9. 2/23/2026: 0.7″
10. 11/9/2025, 12/30/2025: 0.5″
11. 3/17/2026: 0.4″
12. 1/15/2026: 0.3″
13. 1/19/2026, 1/22/2026, 1/26/2026, 3/16/2026: 0.2″
14. 1/1/2026, 1/17/2026, 1/24/2026, 2/25/2026: 0.1″
December 2, 2025 Event
December 13, 2025 Event
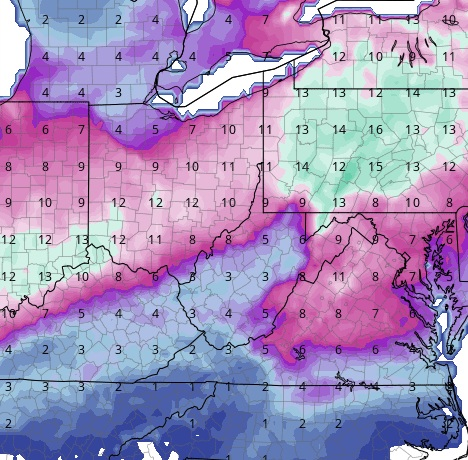
January 25, 2026 Event
Total Snow Days
October: 0
November: 9
December: 12
January: 16
February: 10
March: 6
Deepest Snow Depth
October: 0
November: 1″ on the 10th
December: 5″ on the 2nd and 14th
January: 12″ on the 26th
February: 8″ on the 1st, 2nd and 3rd
March: 2″ on the 2nd
Days with Snow Depth of 1″+
October: 0
November: 1
December: 11
January: 9
February: 14
March: 1
Average Daily Snow Depth by Month
October: 0
November: Trace
December: 1.1″
January: 2.3″
Feburary: 2.5″
March: 0.1″
Average Daily Wind Speed in MPH
October: 6.8
November: 8.2
December: 9.2
January: 9.8
February: 7.6
March: 10.4
Highest Wind Gust in MPH
October: 42 on the 21st
November: 43 on the 5th and 26th
December: 51 on the 29th
January: 49 on the 19th
February: 60 on the 20th
March: 69 on the 22nd
Clear Days by Month
October: 10
November: 4
December: 1
January: 2
February: 2
March: 2
Partly Cloudy Days by Month
October: 16
November: 15
December: 12
January: 10
February: 18
March: 14
Cloudy Days by Month
October: 5
November: 11
December: 18
January: 19
February: 8
March: 15
Columbus Annexation History Map
This interactive map on Columbus annexation history gives detailed information on every single annexation the city has done since the 1830s. Columbus annexation has been generally slowing down over the years, particularly since the 1970s, but it still happens once in a while. This map provides a great source for seeing exactly how Columbus has grown over its history.
Politics and Ohio’s Economic Performance
For this post, I want to focus on politics and Ohio’s economic performance in relation to the party in power. There’s been much said over whether the economy does better under Republicans or Democrats at the national level, and I wanted to see if national politics played any role in the economic performance of Columbus and Ohio overall. Now, to put it simply, I really just looked at Bureau of Labor Statistics to see how the economy performed under different administrations. It’s not necessarily going to be a very deep analysis beyond that. In recent surveys, many user responses chose political content as something I should contribute to the site more often. While I do not want to make the site overtly political, I think there can be a balance by using a data-driven approach. This is what I used in past posts relating to politics, from Covid numbers to voting totals.
In any case, we have to determine what administrations we’re going to look at. First, the criteria is that they have to be completed adminisrations, as we will look at entire 4-year periods. The data for the BLS for Ohio goes back to 1976, but only to 1990 for Columbus itself. Therefore, for the state we will use Carter, Reagan, Bush, Clinton, Bush II, Obama and Trump for the state numbers, and Clinton, Bush II, Obama and Trump for city numbers. Will the state numbers follow the same patterns as the city, or not?
For this post, it’s all about Ohio.
Let’s look at the overall stats of each president. These will be Labor Force (people within the job market), Employment (people in the labor force with jobs), Unemployment (people in the labor force without jobs), and Unemployment Rate (percent of the labor force without jobs).
State of Ohio | Labor Force Data | |||
President | Figure at Term Beginning | Figure at Term End | Net Change | % Change |
Jimmy Carter (D) 1/1977-1/1981 | 4,781,086 | 5,085,673 | +304,587 | +6.37 |
Ronald Reagan (R) 1st Term 1/1981-1/1985 | 5,085,673 | 5,088,875 | +3,202 | +0.06 |
Ronald Reagan (R) 2nd Term 1/1985-1/1989 | 5,088,875 | 5,316,349 | +227,474 | +4.47 |
George H.W. Bush (R) 1/1989-1/1993 | 5,316,349 | 5,478,918 | +162,569 | +3.06 |
Bill Clinton (D) 1st Term 1/1993-1/1997 | 5,478,918 | 5,684,684 | +205,766 | +3.76 |
Bill Clinton (D) 2nd Term 1/1997-1/2001 | 5,684,684 | 5,802,000 | +117,316 | +2.06 |
George W. Bush (R) 1st Term 1/2001-1/2005 | 5,802,000 | 5,851,991 | +49,991 | +0.86 |
George W. Bush (R) 2nd Term 1/2005-1/2009 | 5,851,991 | 5,960,636 | +108,645 | +1.86 |
Barack Obama (D) 1st Term 1/2009-1/2013 | 5,960,636 | 5,705,642 | -254,994 | -4.28 |
Barack Obama (D) 2nd Term 1/2013-1/2017 | 5,705,642 | 5,791,153 | +85,511 | +1.50 |
Donald Trump (R) 1st Term 1/2017-1/2021 | 5,791,153 | 5,720,805 | -70,348 | -1.21 |
Joe Biden (D) 1/2021-1/2025 | 5,720,805 | 5,922,243 | +201,438 | +3.52 |
Total Labor Force Change by Entire Presidency
1. Bill Clinton: +323,082
2. Jimmy Carter: +304,587
3. Ronald Reagan: +232,676
4. Joe Biden: +201,438
5. George H.W. Bush: +162,569
6. George W. Bush: +158,636
7. Donald Trump: -70,348
8. Barack Obama: -169,483
Total by Party
Democratic: +659,624
Republican: +483,533
Next up, Employment.
State of Ohio | Employment Data | |||
President | Figure at Term Beginning | Figure at Term End | Net Change | % Change |
Jimmy Carter (D) 1/1977-1/1981 | 4,423,538 | 4,629,708 | +206,170 | +4.66 |
Ronald Reagan (R) 1st Term 1/1981-1/1985 | 4,629,708 | 4,633,809 | 4,101 | +0.09 |
Ronald Reagan (R) 2nd Term 1/1985-1/1989 | 4,633,809 | 5,032,921 | +399,112 | +8.61 |
George H.W. Bush (R) 1/1989-1/1993 | 5,032,921 | 5,092,311 | +59,390 | +1.18 |
Bill Clinton (D) 1st Term 1/1993-1/1997 | 5,092,311 | 5,396,922 | +304,611 | +5.98 |
Bill Clinton (D) 2nd Term 1/1997-1/2001 | 5,396,922 | 5,577,863 | +180,941 | +3.35 |
George W. Bush (R) 1st Term 1/2001-1/2005 | 5,577,863 | 5,484,332 | -93,531 | -1.68 |
George W. Bush (R) 2nd Term 1/2005-1/2009 | 5,484,332 | 5,437,168 | -47,164 | -0.86 |
Barack Obama (D) 1st Term 1/2009-1/2013 | 5,437,168 | 5,279,345 | -157,823 | -2.90 |
Barack Obama (D) 2nd Term 1/2013-1/2017 | 5,279,345 | 5,489,730 | +210,385 | +3.99 |
Donald Trump (R) 1st Term 1/2017-1/2021 | 5,489,730 | 5,370,247 | -119,483 | -2.18 |
Joe Biden (D) 1/2021-1/2025 | 5,370,247 | 5,651,168 | +280,921 | +5.23 |
Total Employment Change by Entire Presidency
1. Bill Clinton: +485,552
2. Ronald Reagan: +403,213
3. Joe Biden: +280,921
4. Jimmy Carter: +206,170
5. George H.W. Bush: +59,390
6. Barack Obama: +52,562
7. Donald Trump: -119,483
8. George W. Bush: -140,695
Total by Party
Democratic: +1,025,205
Republican: +202,425
Now Unemployment.
State of Ohio | Unemployment Data | |||
President | Figure at Term Beginning | Figure at Term End | Net Change | % Change |
Jimmy Carter (D) 1/1977-1/1981 | 357,548 | 455,965 | +98,417 | +27.53 |
Ronald Reagan (R) 1st Term 1/1981-1/1985 | 455,965 | 455,066 | -899 | -0.2 |
Ronald Reagan (R) 2nd Term 1/1985-1/1989 | 455,066 | 283,428 | -171,638 | -37.72 |
George H.W. Bush (R) 1/1989-1/1993 | 283,428 | 386,607 | +103,179 | +36.40 |
Bill Clinton (D) 1st Term 1/1993-1/1997 | 386,607 | 287,762 | -98,845 | -25.57 |
Bill Clinton (D) 2nd Term 1/1997-1/2001 | 287,762 | 224,137 | -63,625 | -22.11 |
George W. Bush (R) 1st Term 1/2001-1/2005 | 224,137 | 367,659 | +143,522 | +64.03 |
George W. Bush (R) 2nd Term 1/2005-1/2009 | 367,659 | 523,468 | +155,809 | +42.38 |
Barack Obama (D) 1st Term 1/2009-1/2013 | 523,468 | 426,297 | -97,171 | -18.56 |
Barack Obama (D) 2nd Term 1/2013-1/2017 | 426,297 | 301,423 | -124,874 | -29.29 |
Donald Trump (R) 1st Term 1/2017-1/2021 | 301,423 | 350,558 | +49,135 | +16.30 |
Joe Biden (D) 1/2021-1/2025 | 350,558 | 271,075 | -79,483 | -22.67 |
Total Unemployment Change by Entire Presidency
1. Barack Obama: -222,045
2. Ronald Reagan: -172,537
3. Bill Clinton: -162,470
4. Joe Biden: -79,483
5. Donald Trump: +49,135
6. Jimmy Carter: +98,417
7. George H.W. Bush: +103,179
8. George W. Bush: +299,331
Total by Party
Democratic: -365,581
Republican: +279,108
And finally, the Unemployment Rate
State of Ohio | Unemployment Rate Data | ||
President | Figure at Term Beginning | Figure at Term End | Net Change |
Jimmy Carter (D) 1/1977-1/1981 | 7.5 | 9.0 | +1.5 |
Ronald Reagan (R) 1st Term 1/1981-1/1985 | 9.0 | 8.9 | -0.1 |
Ronald Reagan (R) 2nd Term 1/1985-1/1989 | 8.9 | 5.3 | -3.6 |
George H.W. Bush (R) 1/1989-1/1993 | 5.3 | 7.1 | +1.8 |
Bill Clinton (D) 1st Term 1/1993-1/1997 | 7.1 | 5.1 | -2.0 |
Bill Clinton (D) 2nd Term 1/1997-1/2001 | 5.1 | 3.9 | -1.2 |
George W. Bush (R) 1st Term 1/2001-1/2005 | 3.9 | 6.3 | +2.4 |
George W. Bush (R) 2nd Term 1/2005-1/2009 | 6.3 | 8.8 | +2.5 |
Barack Obama (D) 1st Term 1/2009-1/2013 | 8.8 | 7.5 | -1.3 |
Barack Obama (D) 2nd Term 1/2013-1/2017 | 7.5 | 5.2 | -2.3 |
Donald Trump (R) 1st Term 1/2017-1/2021 | 5.2 | 6.1 | +0.9 |
Joe Biden (D) 1/2021-1/2025 | 6.1 | 4.6 | -1.5 |
Total Unemployment Rate Change by Entire Presidency
1. Ronald Reagan: -3.7
2. Barack Obama: -3.6
3. Bill Clinton: -3.2
4. Joe Biden: -1.5
5. Donald Trump: +0.9
6. Jimmy Carter: +1.5
7. George H.W. Bush: +1.8
8. George W. Bush: +4.9
Total by Party
Democratic: -6.8
Republican: +3.9
Presidents Ranked by Ohio Performance Overall Per Average Rank Position
1. Bill Clinton/Ronald Reagan: 2.0
2. Joe Biden: 3.75
3. Barack Obama: 4.25
4. Jimmy Carter: 4.5
5. Donald Trump: 6.0
6. George H.W. Bush: 7.0
7. George W. Bush: 7.5
It seems pretty clear based on this that Ohio does significantly better when Democrats are in the Oval Office. They produced 5x the number of jobs and moved the unemployment rate down by an average of -1.7 points, while Republicans moved it up by an average of almost 1 point. Every single metric measured by the BLS did better under Democrats. Only Reagan really stood out for Republicans while even Carter- regularly derided as a terrible president- did better than all 3 other Republicans on the list. In regards to the two most recent presidents from both parties, Biden clearly had much more favorable numbers than Trump did in his first term.
Now, does this trend translate to the more local level? In an upcoming post, I will examine how the Columbus Metro performed
Strange Columbus- 1955 Nuclear Test Fallout
From 1945 until an atmospheric test moratorium in July, 1962, atomic bomb testing in Nevada was so common that Las Vegas tourists would hold parties just to watch the tests from their hotel rooms. Little was known, at least in the beginning, about the effects of nuclear fallout, or just how far it could actually spread.
On April 18, 1955, during what was known as Operation Teapot, the Columbus Dispatch reported that radiation from the testing site had reached Columbus.
The radiation had come from the MET test which occurred on April 15, 1955. The bomb was 22 kilotons in size. The video above is from the MET test itself.
Events like this happened several times as the jet stream carried radioactive fallout across the country, and the 1955 nuclear test fallout wouldn’t be the last. It’s unclear whether this fallout had any substantial health impacts long-term, locally or otherwise, but today we understand that even relatively low doses of radiation increase one’s risk for developing cancers down the road. Luckily, these increased levels tended to last a day or two only.