

Finding accurate Columbus crime statistics can be difficult. The FBI uses its Uniform Crime Reporting to gather comparable data on every city. Unfortunately, not all cities report accurately or completely and the reported numbers don’t always match up. For example, Columbus police reported 111 homicides in 2018, but only 110 of them are listed in the UCR data. This likely has something to do with the way that the UCR classifies homicides versus the way the city does, or because the city later updated numbers after reporting to the UCR. This is most common with the murder data, as sometimes victims die in a different year than they were injured in, or from events retroactively adding to past years. Additionally, what is reported to US by police departments does not include adjudication results, meaning they may have reported an incident as a crime that was later ruled justified in a court of law.
Having said all that, the UCR is the most consistent source and offers data back nearly 40 years for Columbus. Because of this, I have opted to use it for this page.
Click on any graph to open a larger version.
**Last Updated: 7/7/2026- Updated the 2026 homicide map and data through the end of June.
2026 Homicide Tracker
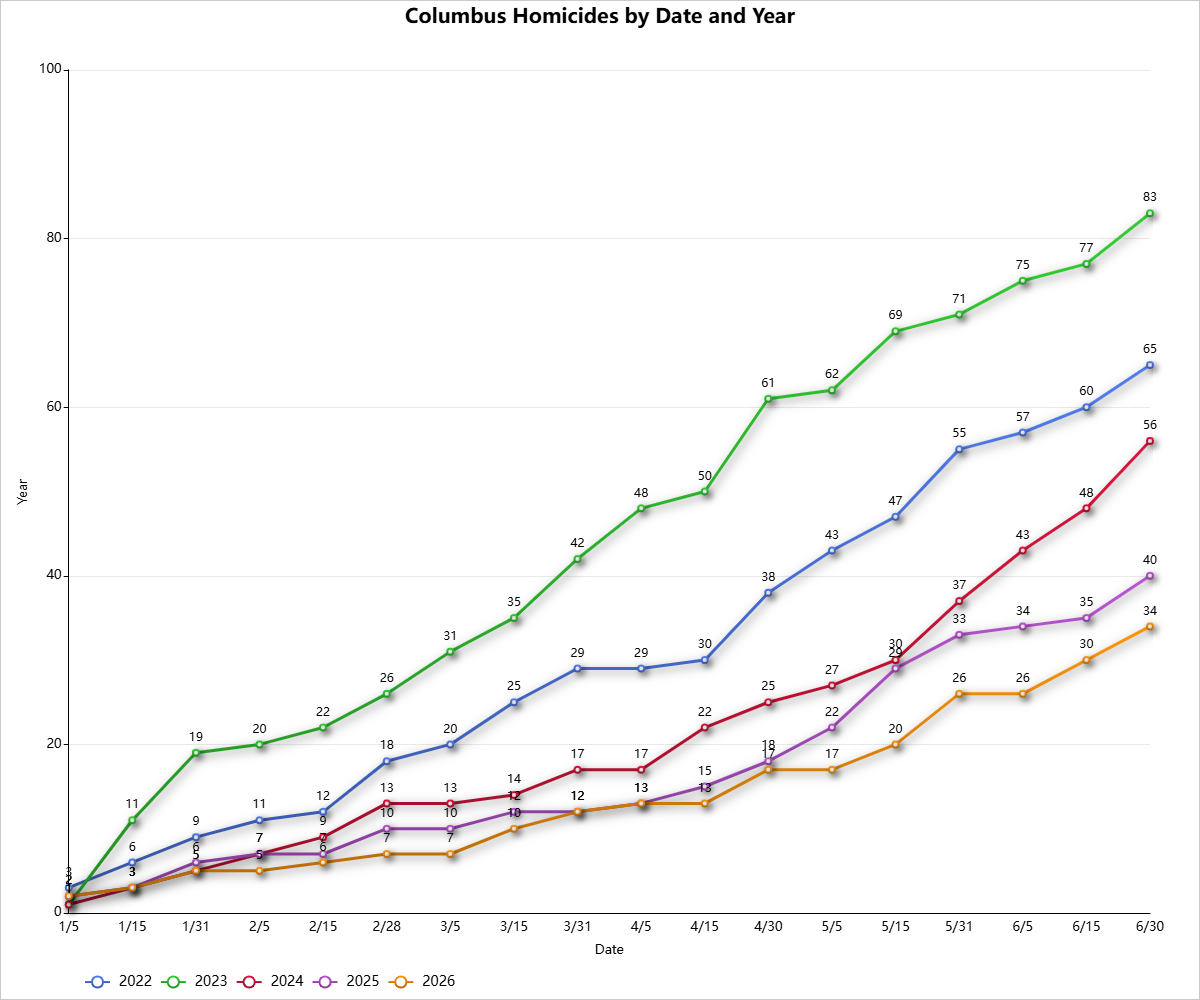
Through the end of June, Columbus had had 34 homicides. This remains one of the lowest totals to date since at least the mid-1980s.
2025 Homicide Tracker
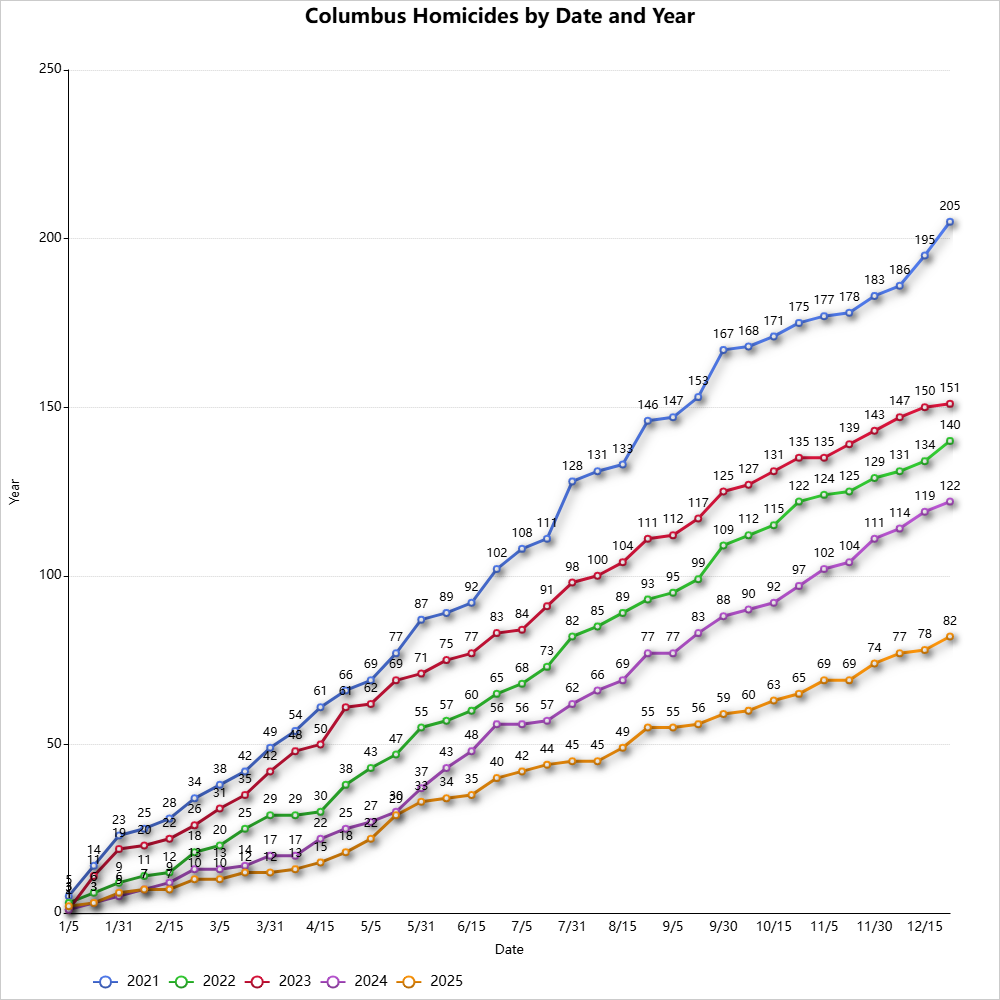
While the graph above shows 82 homicides, Columbus police reported 84 for 2025 in total. 2 of the homicides did not have specific dates attached. Regardless, the total of 84 for the year represented about a 31% decrease over 2024, a phenomenal drop for a single year. There may be future adjustments.
Previous Years
2024 Crime
2023 Crime
2022 Crime
FBI Uniform Crime Reporting Data
*The data is accurate as per the Uniform Crime Report through March 5, 2026, though 2025 data is preliminary.
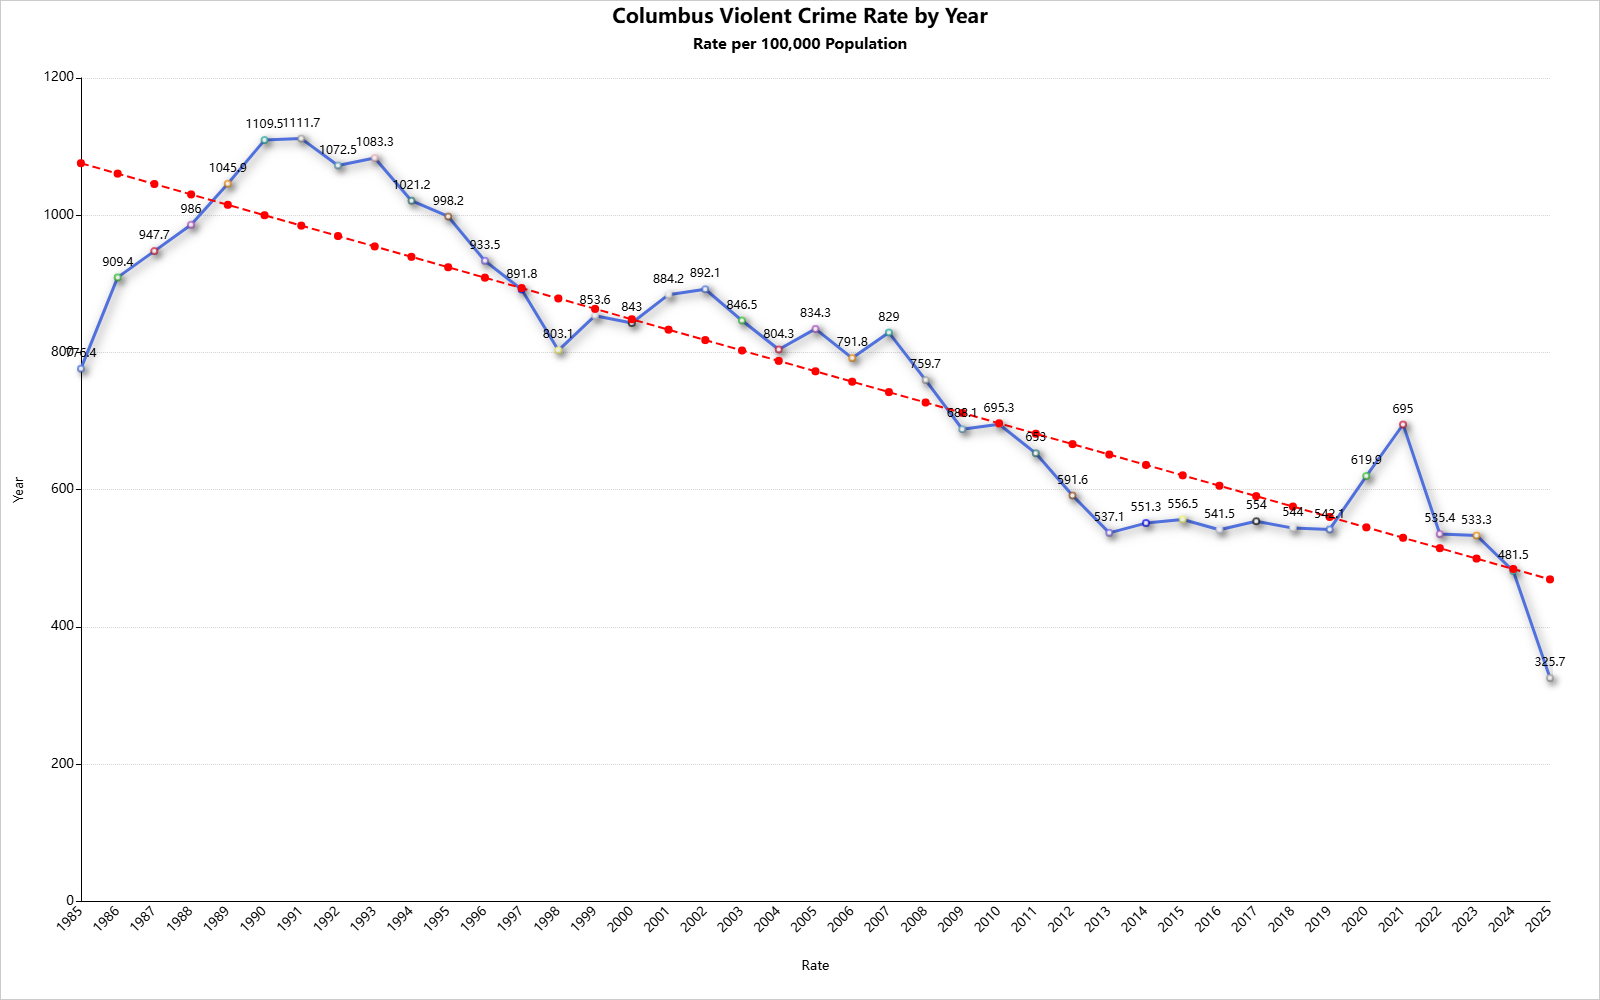
Violent Crime
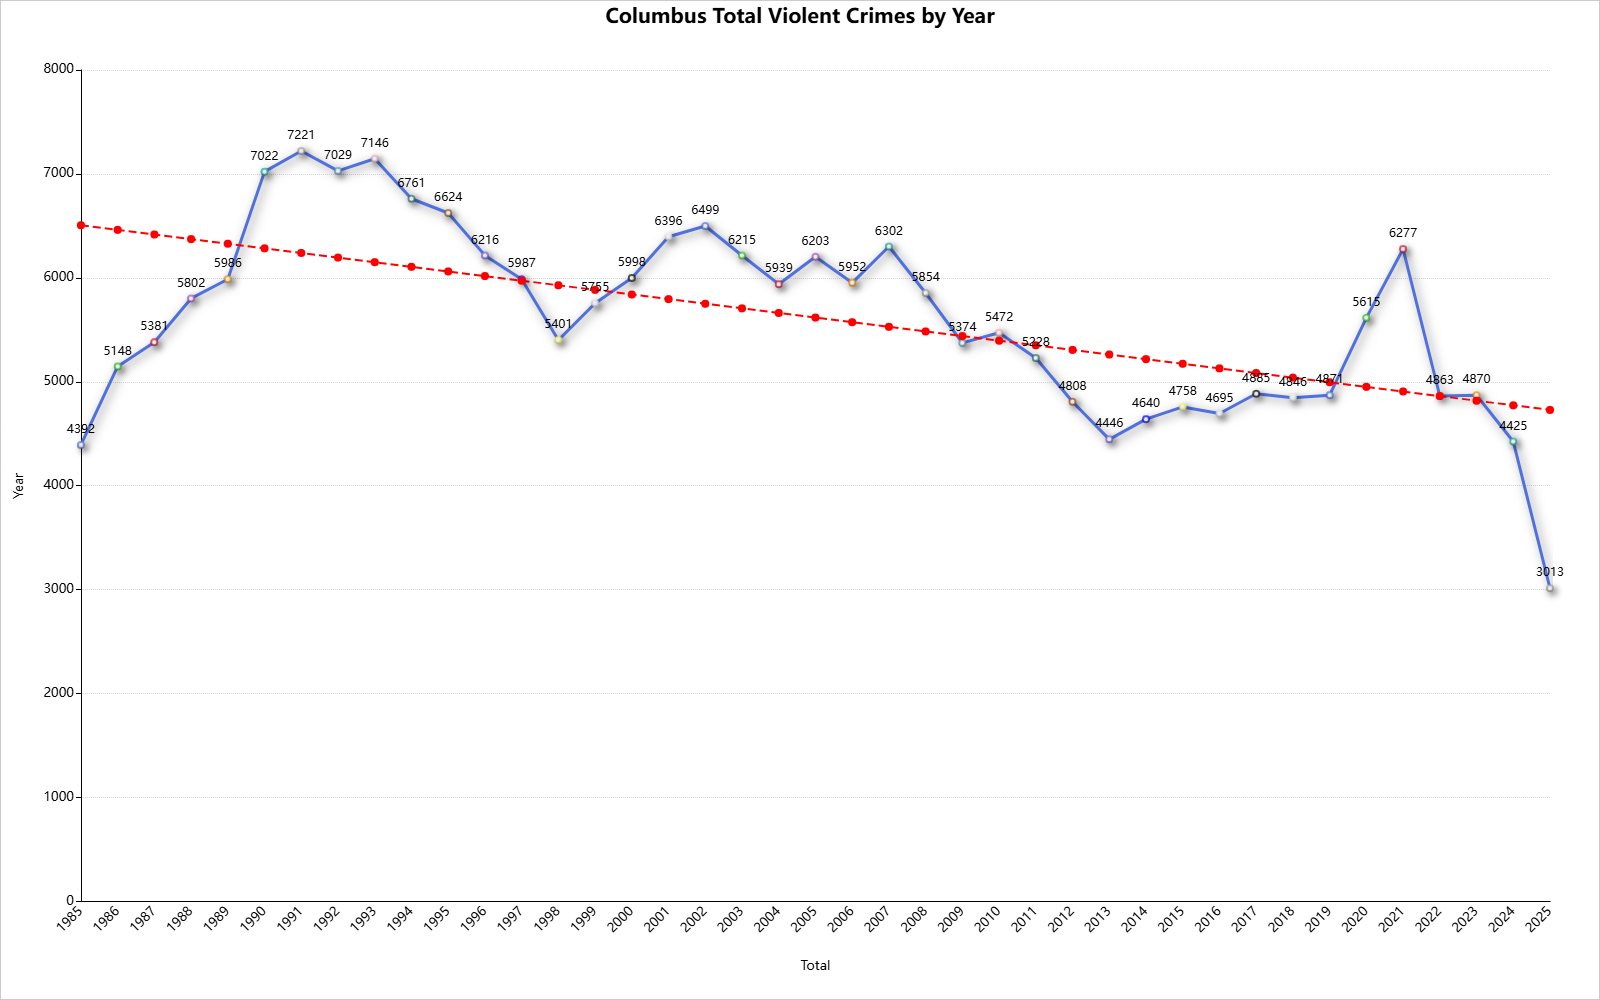
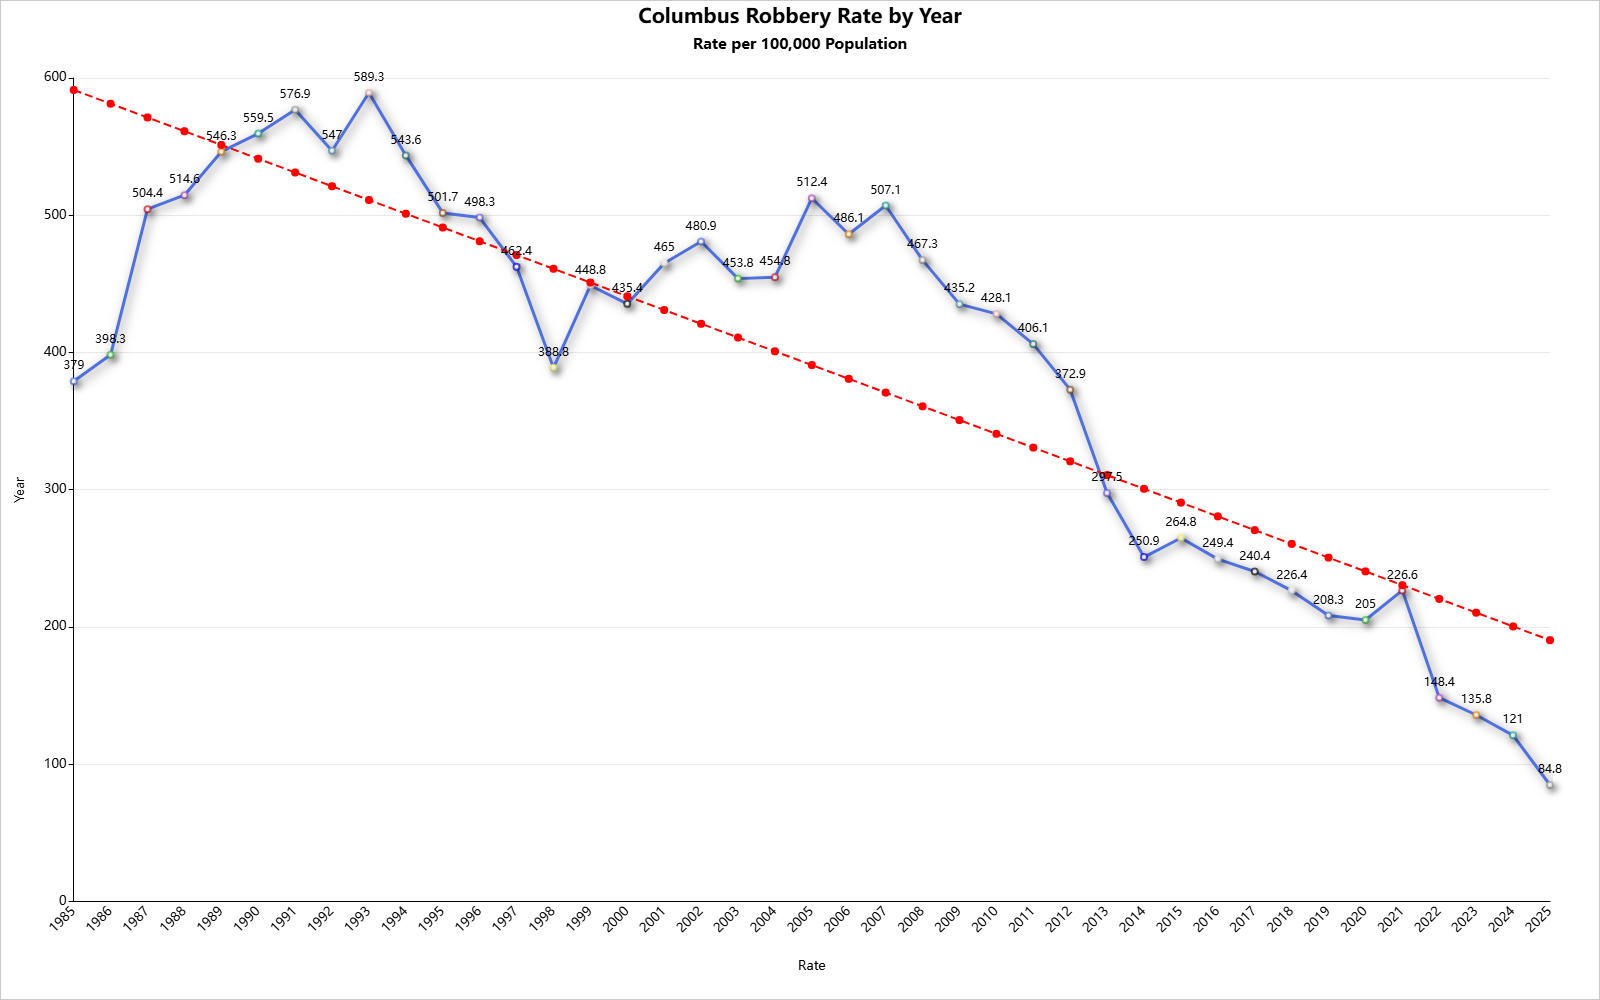
Overall, violent crime has been on a downward trend the last 40 years. 2024 was the lowest since 1985, and 2025’s preliminary looks even better.
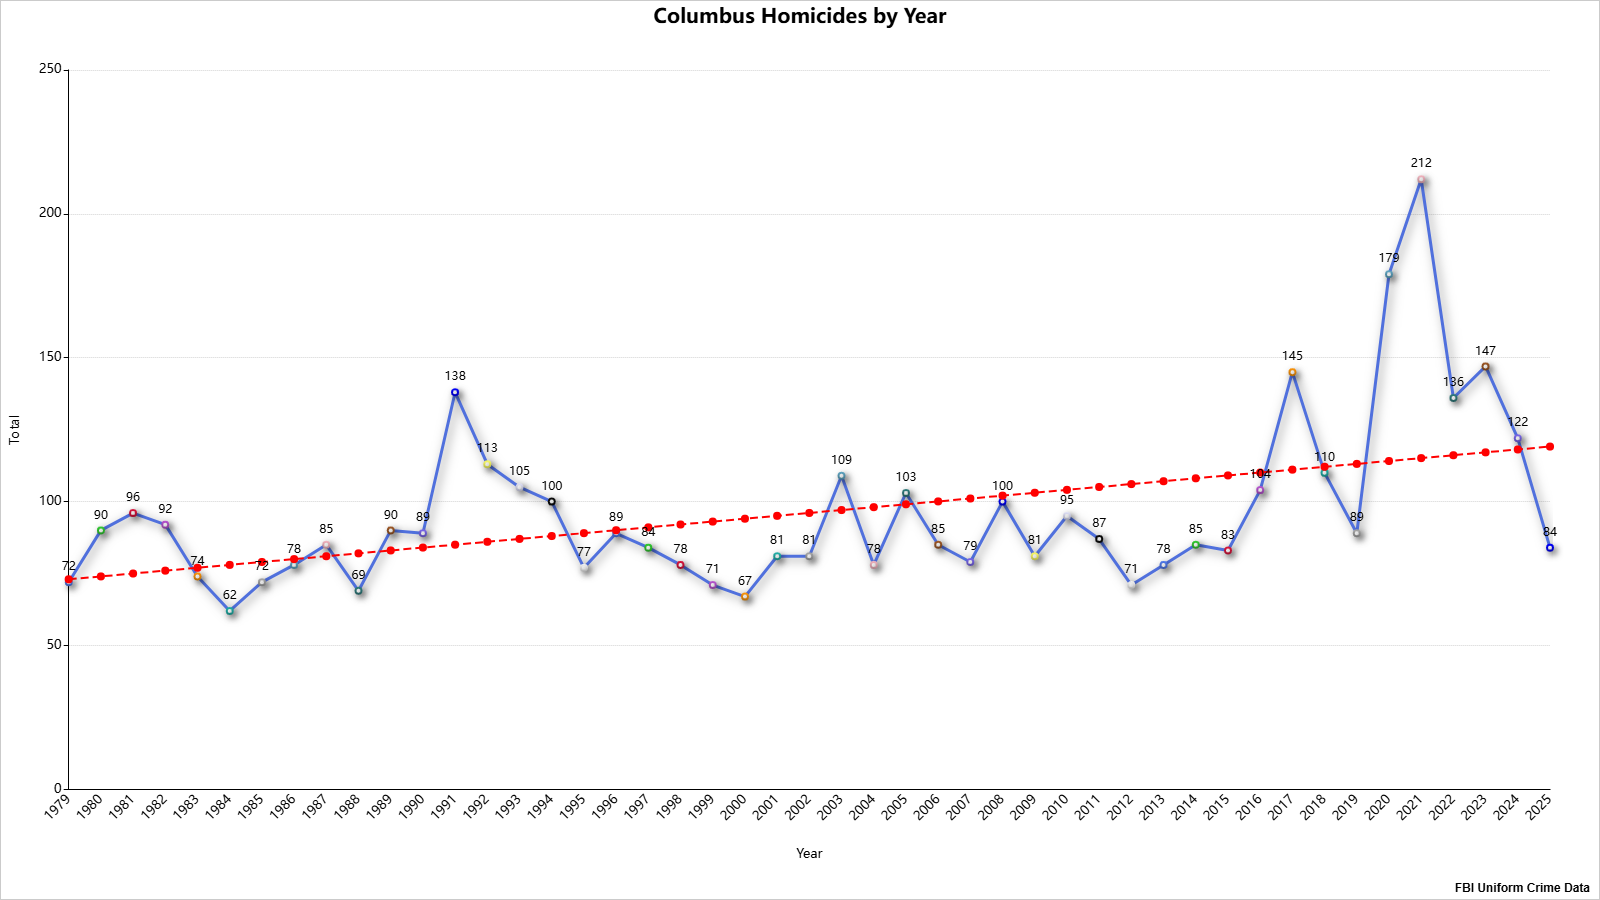

Homicides have not followed trends for most other crime types. There were two significant spikes in homicides since 1979. The first occurred 1990-1992 during the crack epidemic, and the second occurred 2016-2024. This most recent and more significant spike was consistent for several years. It’s unclear what the reasons are for the suddent rise during the period, but it was abrupt.

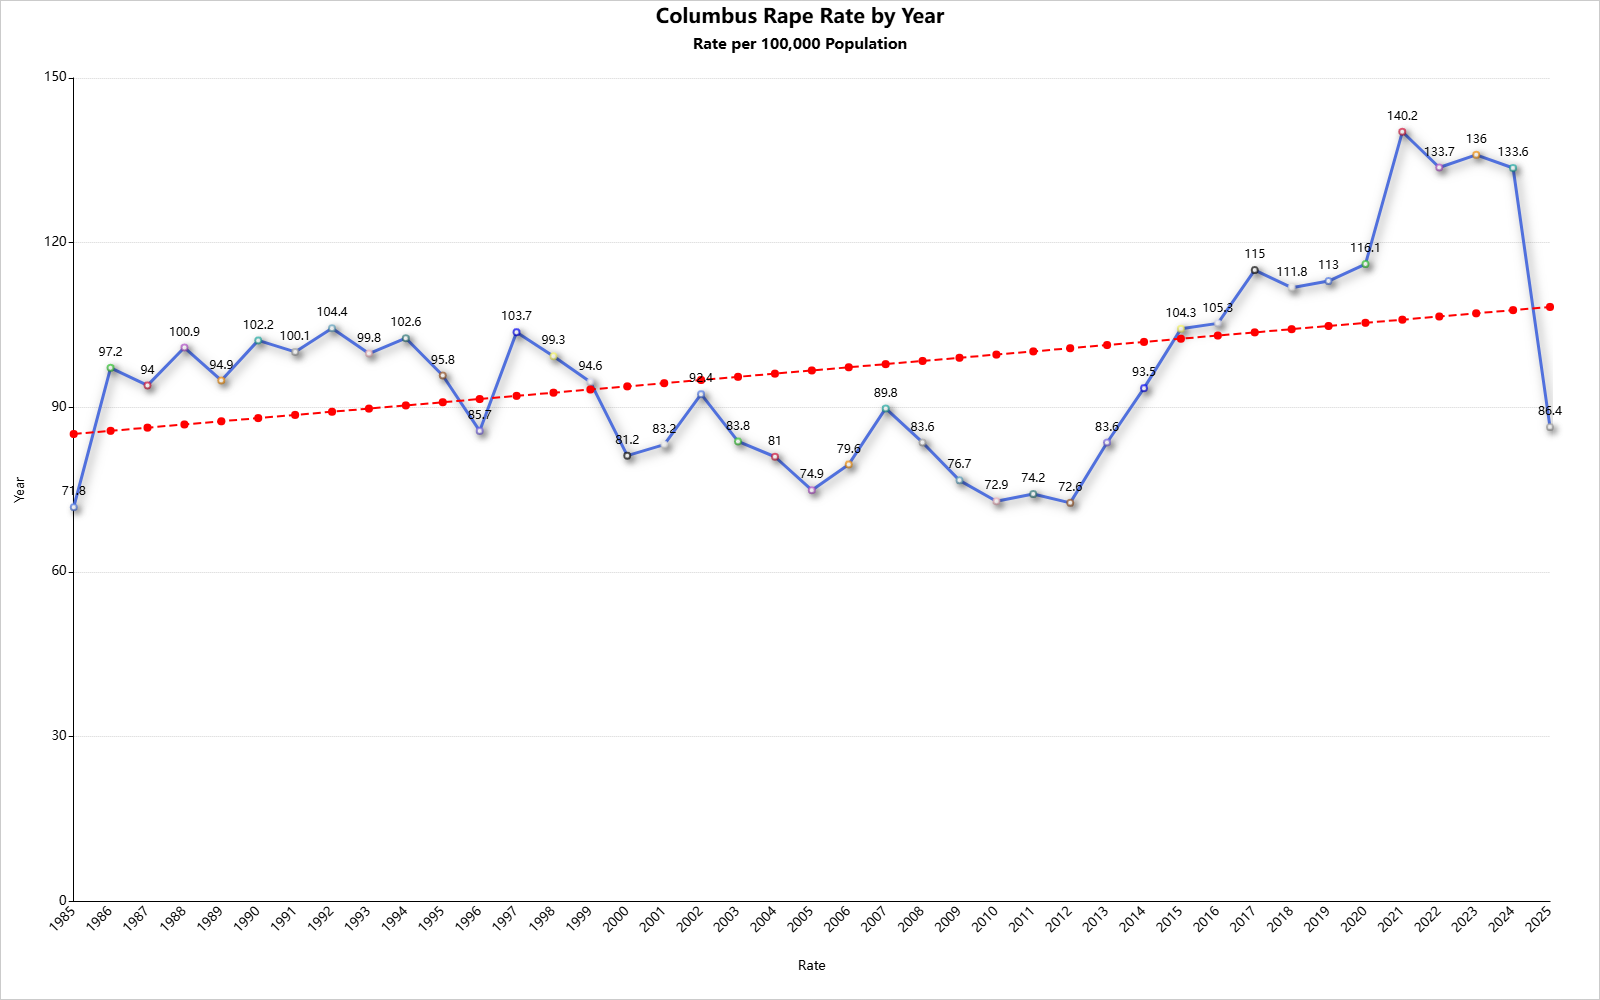
The definition of rape was significantly expanded in 2013, so the numbers after that date are generally higher than before and are not necessarily directly comparable.

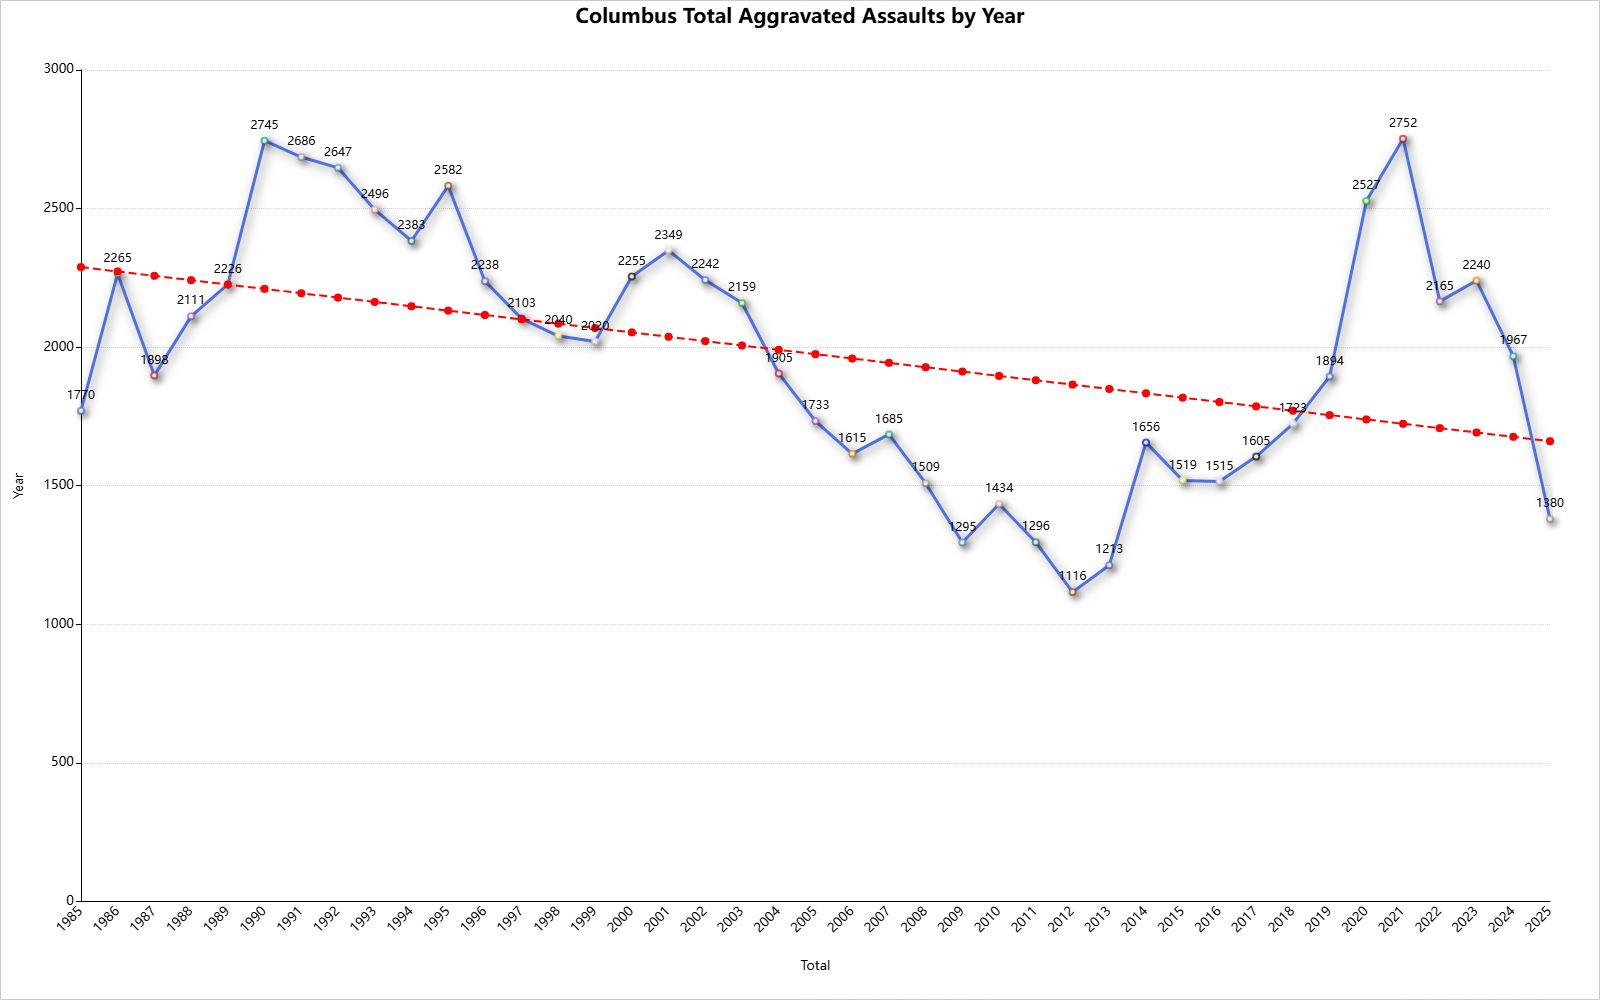
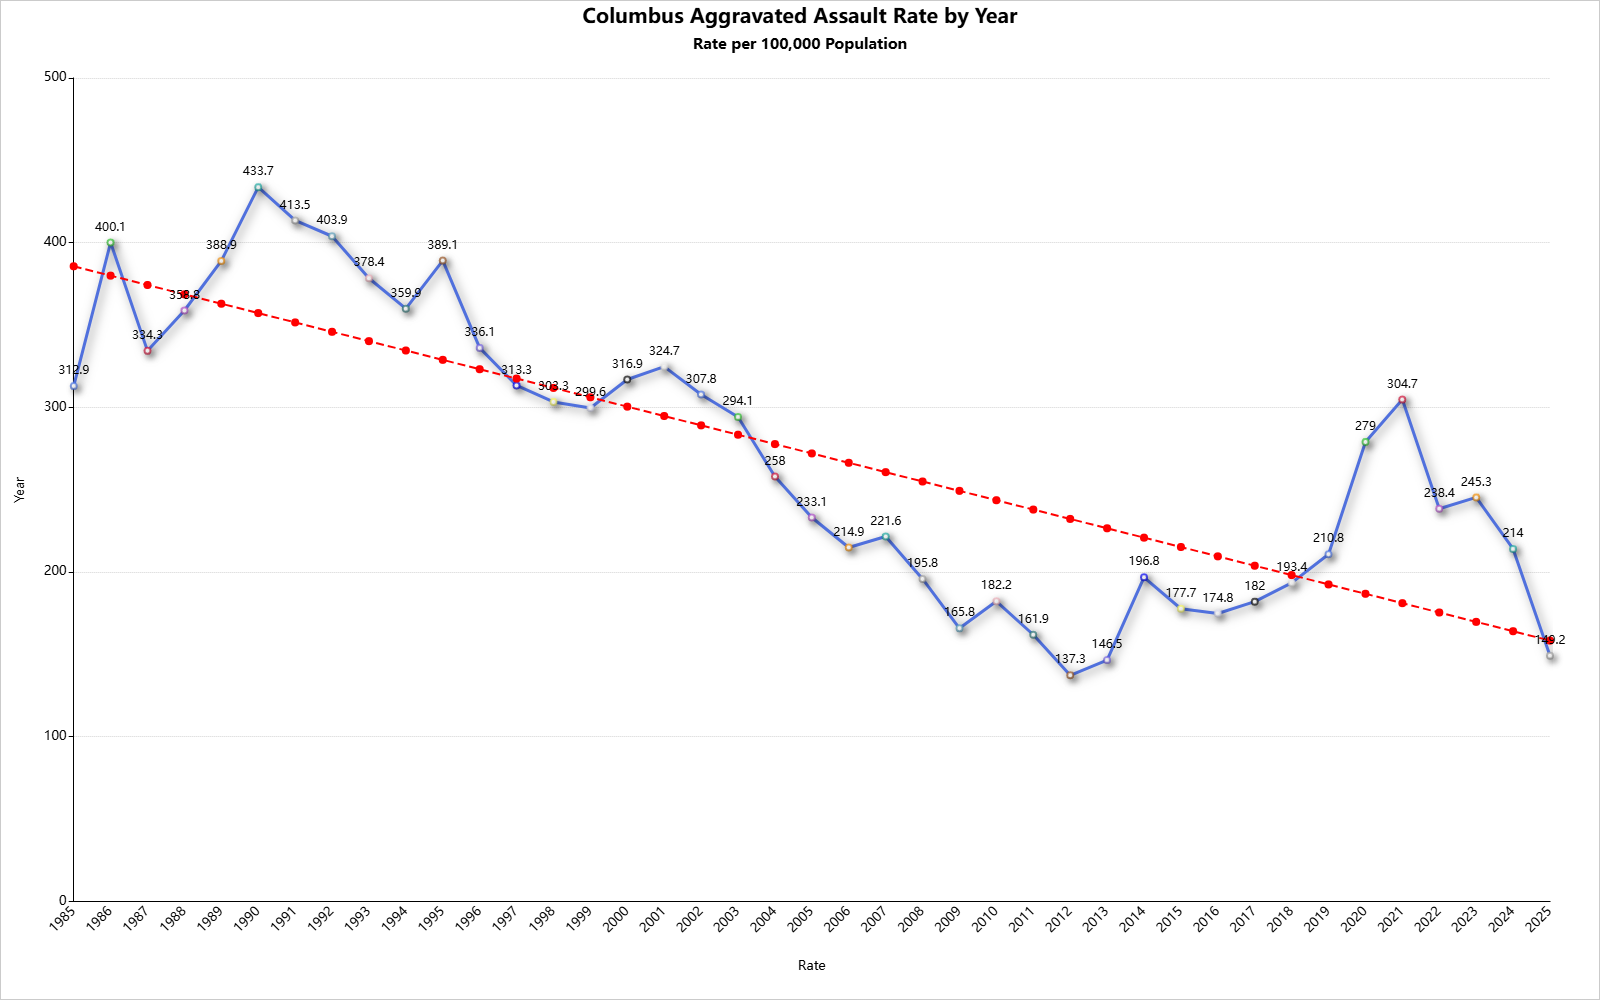
Aggravated assaults have also been trending down over time, but there was a significant spike beginning in the latter half of the 2010s and peaking in 2021. The rate during the spike, however, never came close to matching the historic high in the 1980s and early 1990s.
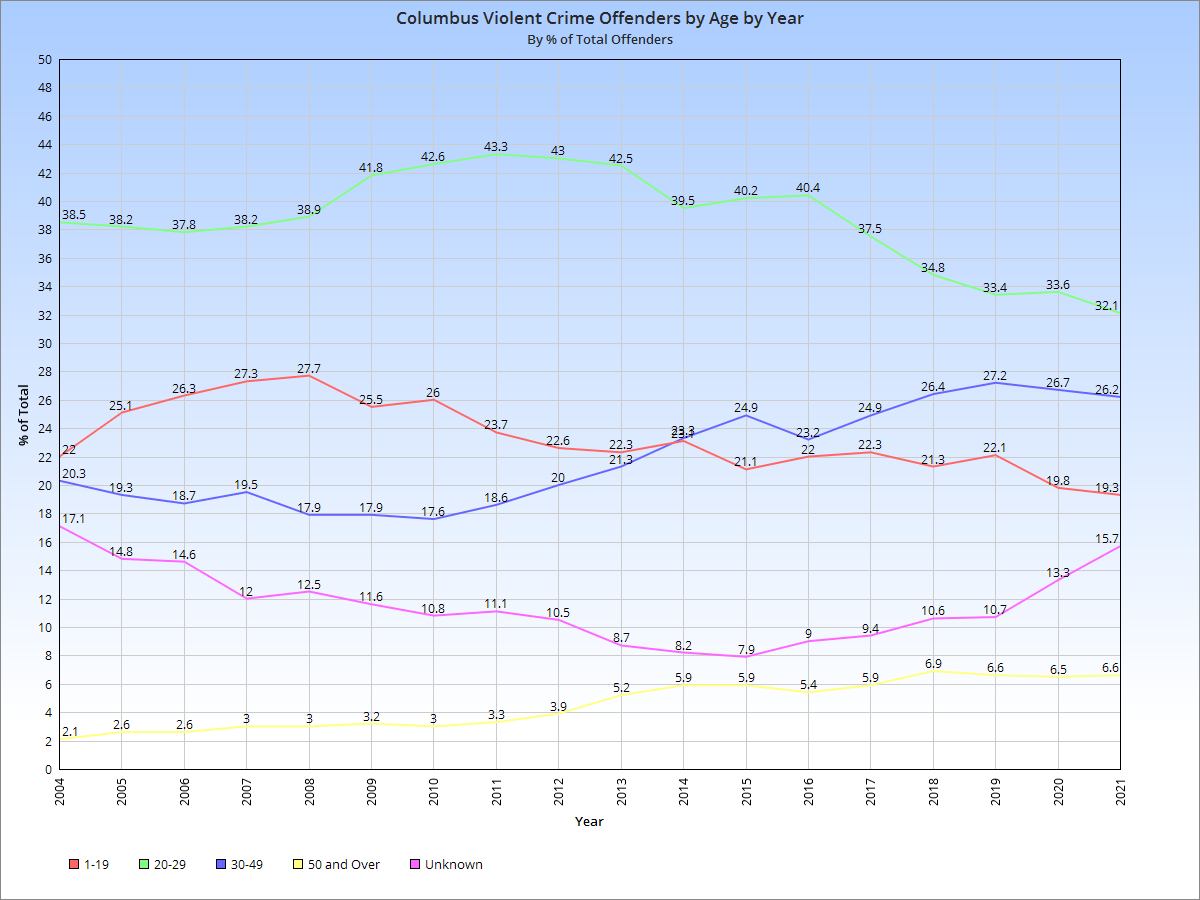
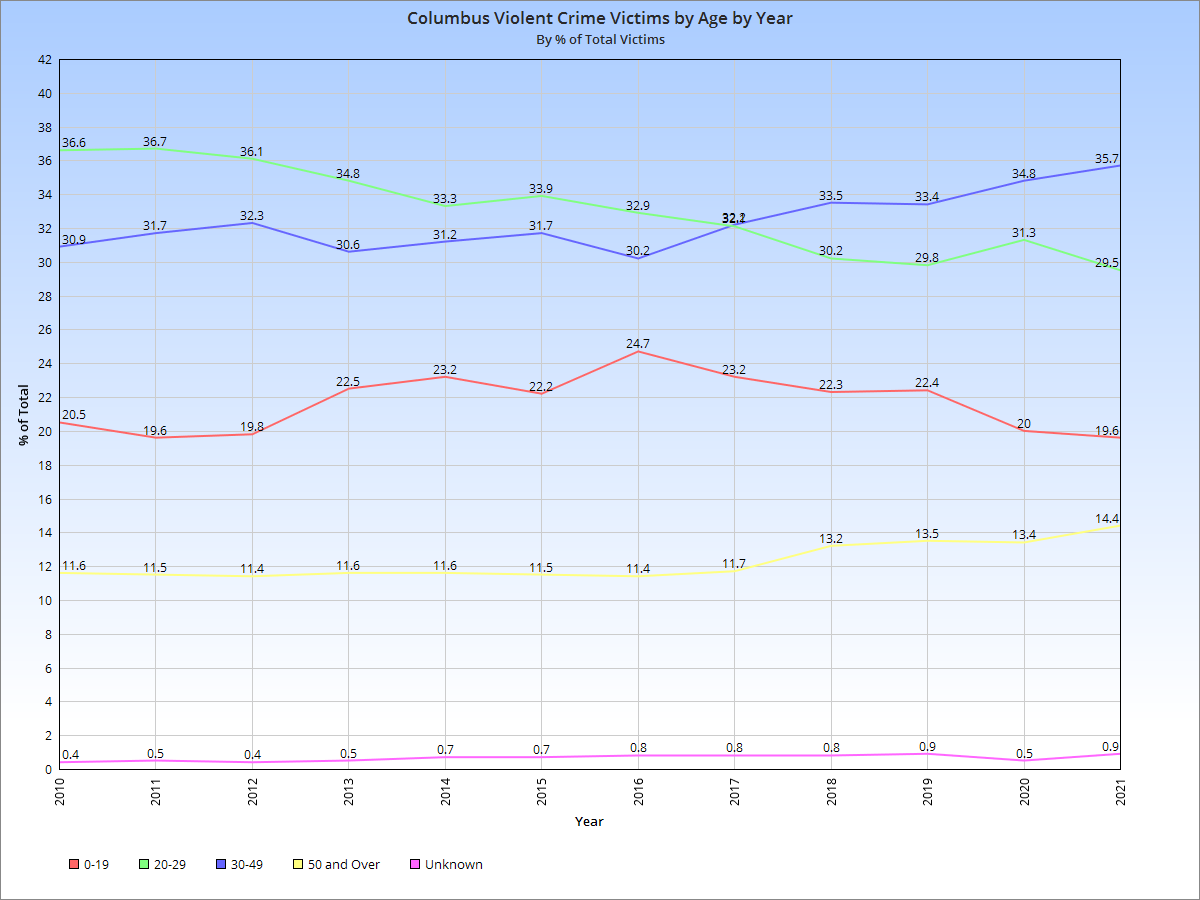
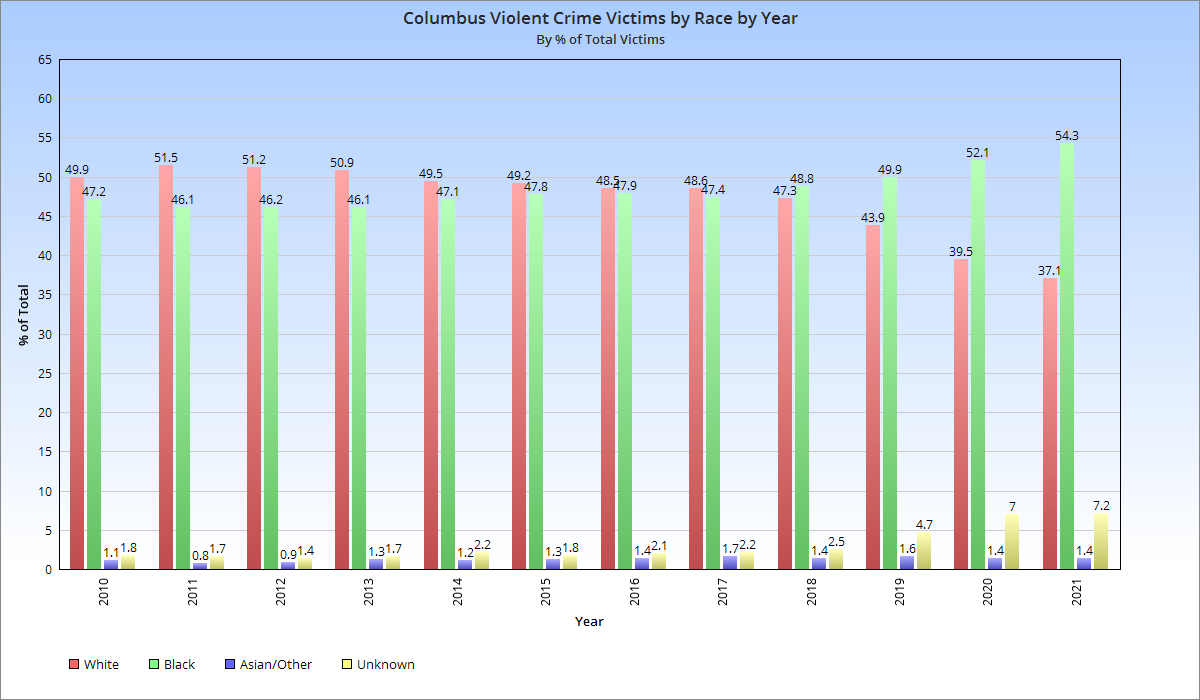
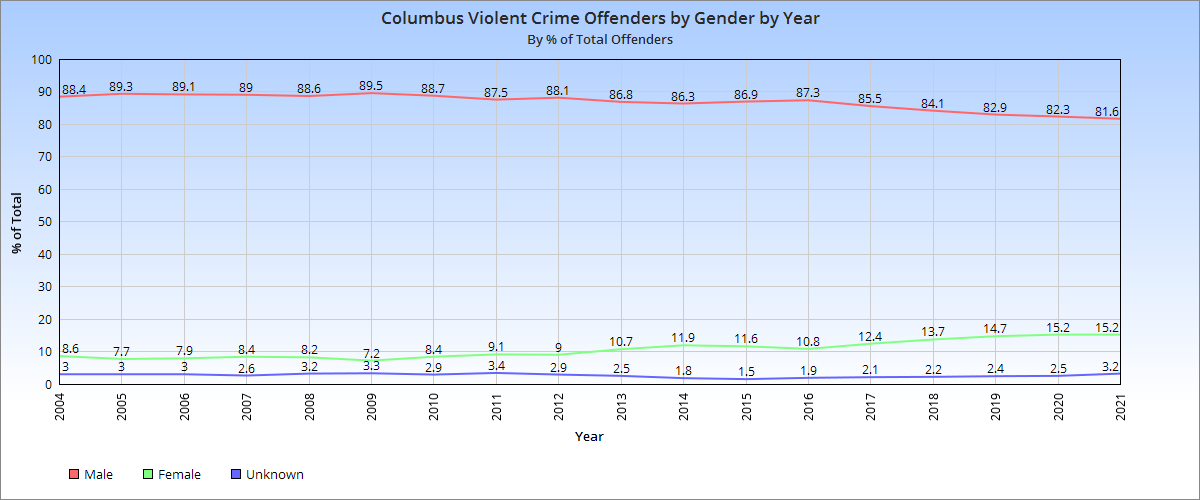
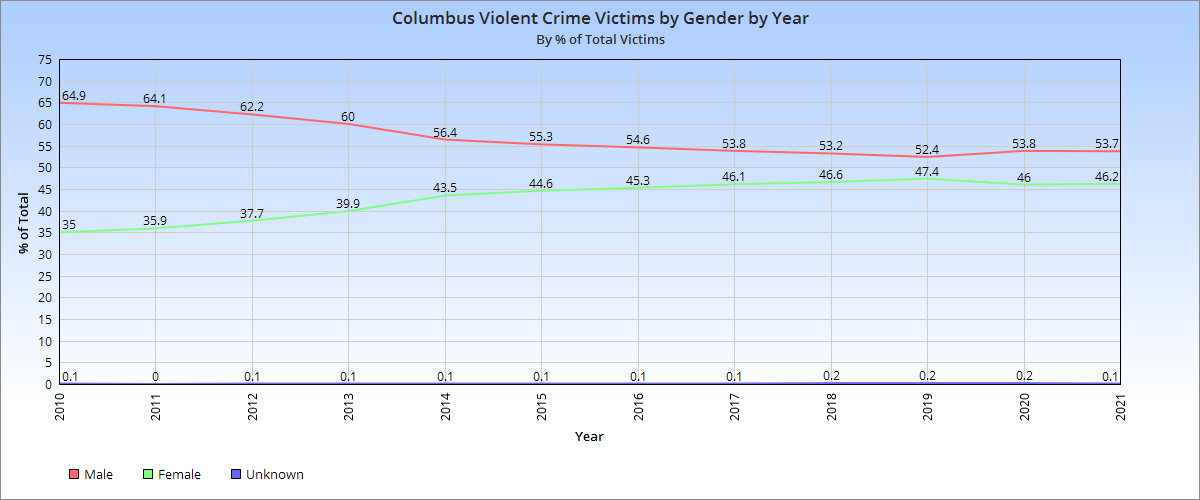
The following date breaks down violent crime incidents by both offender and victim by race, gender and age. Because some individual crimes are committed by multiple people, the total offenders will not match total reported crimes. Offender data is available since 2004 and victim data since 2010.
Violent Crime Offenders and Victims by Age
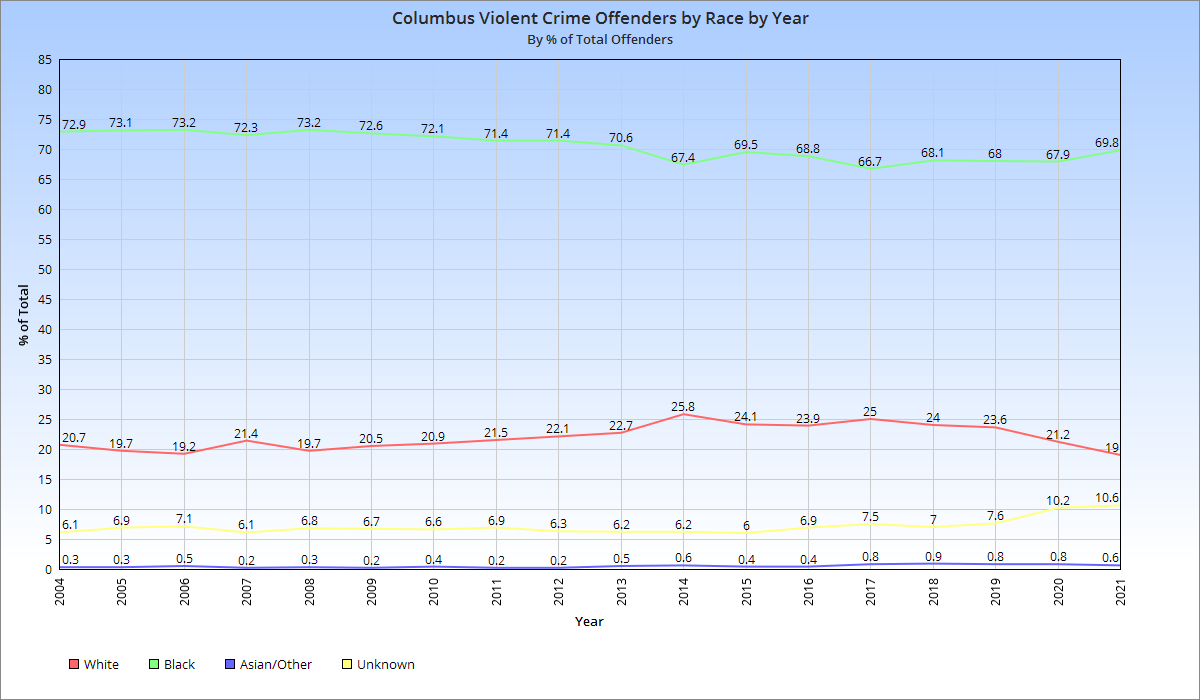
Violent Crime Offenders and Victims by Race
Violent Crime Offenders and Victims by Gender
Property Crime
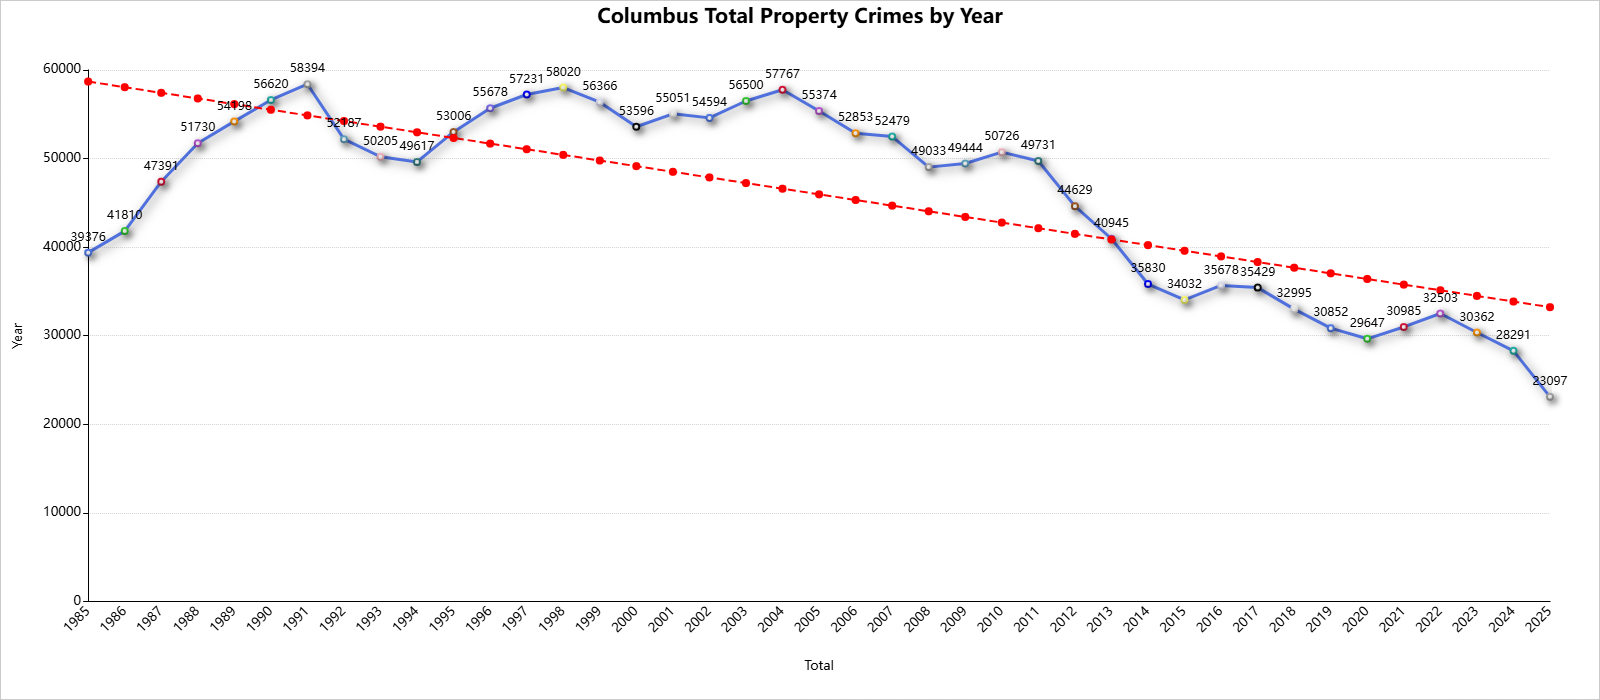
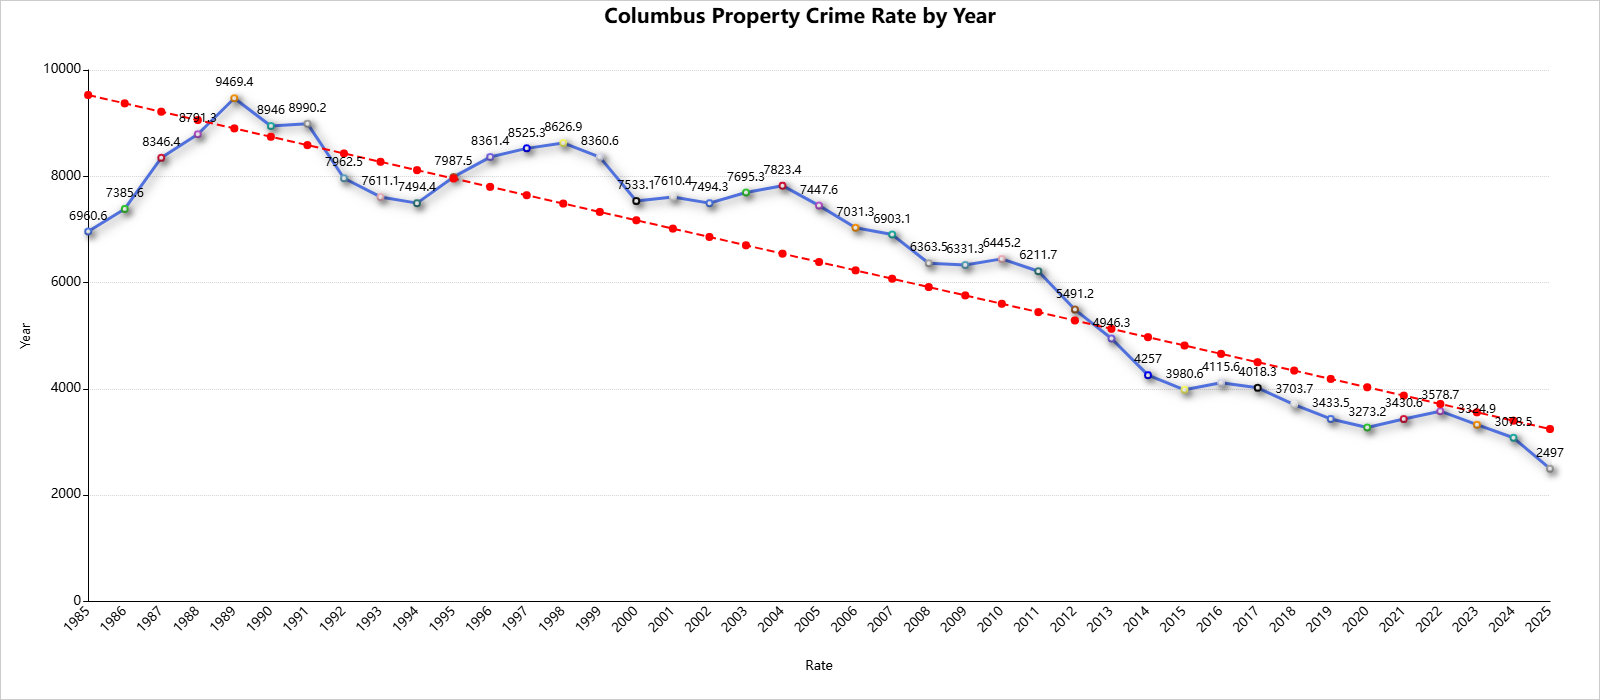
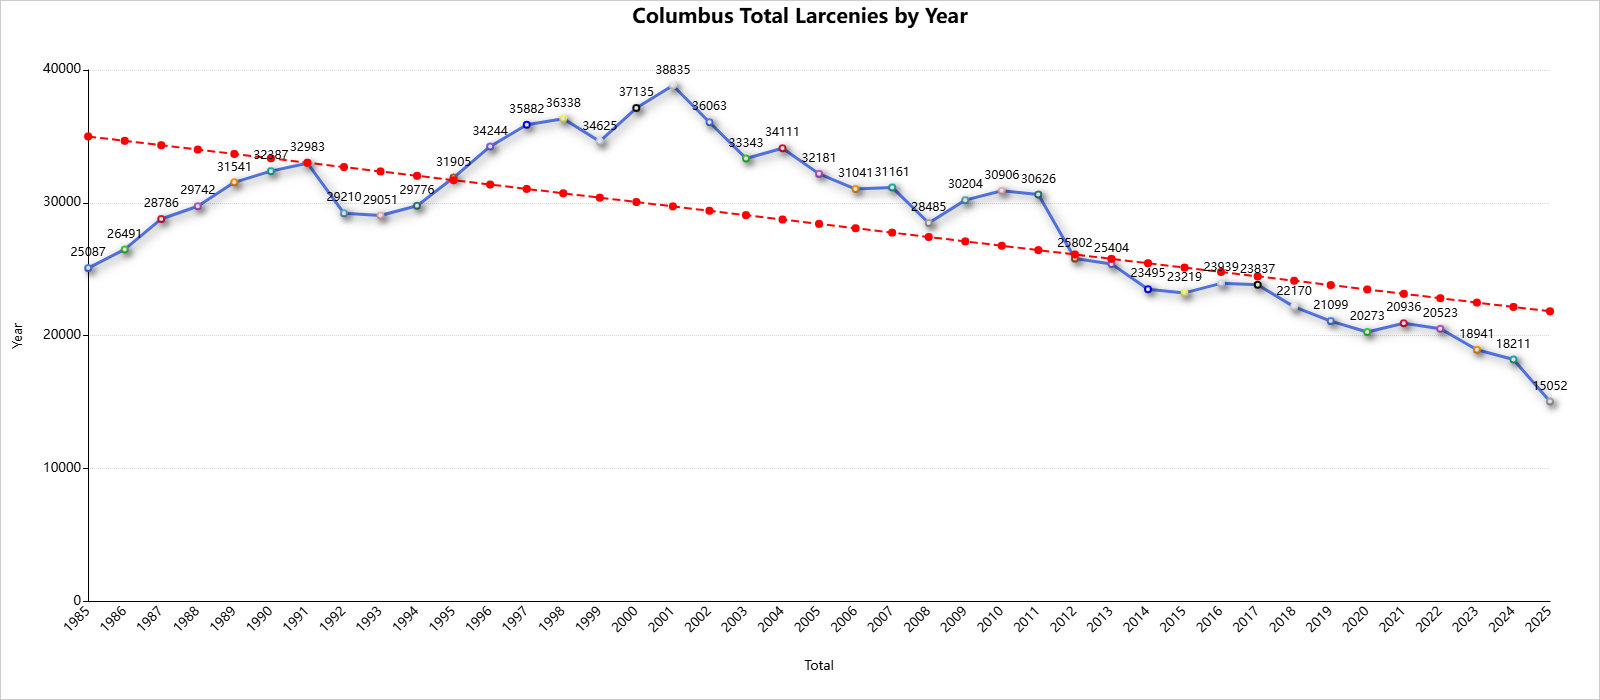
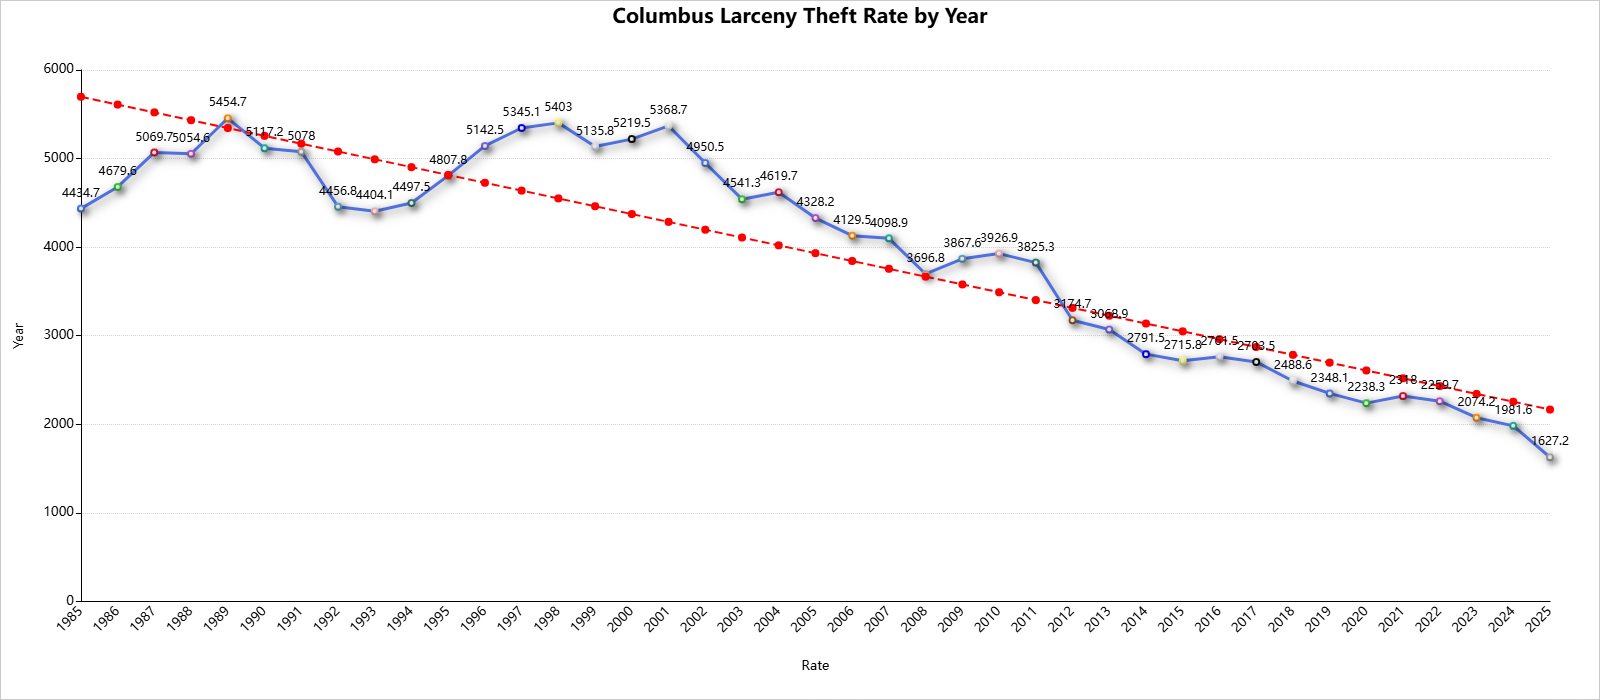
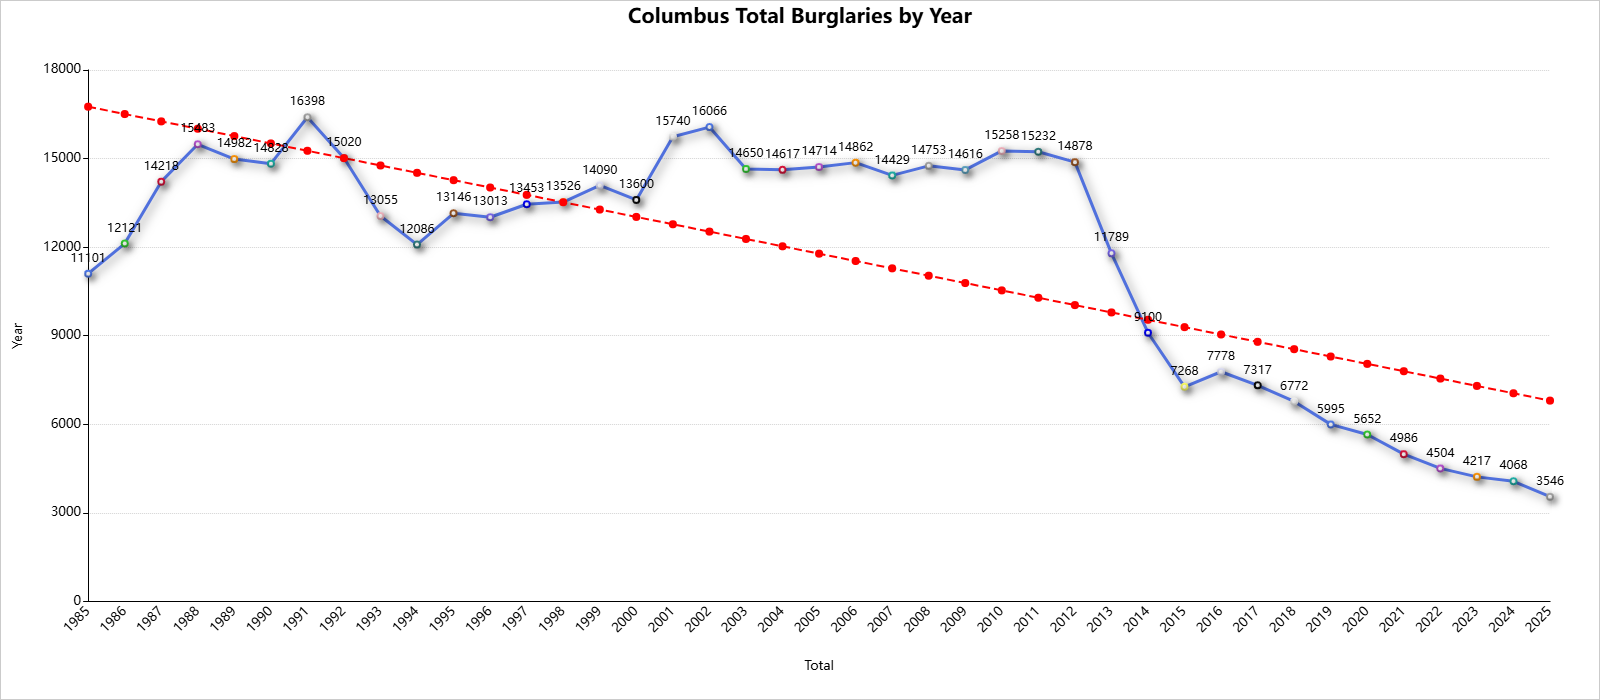
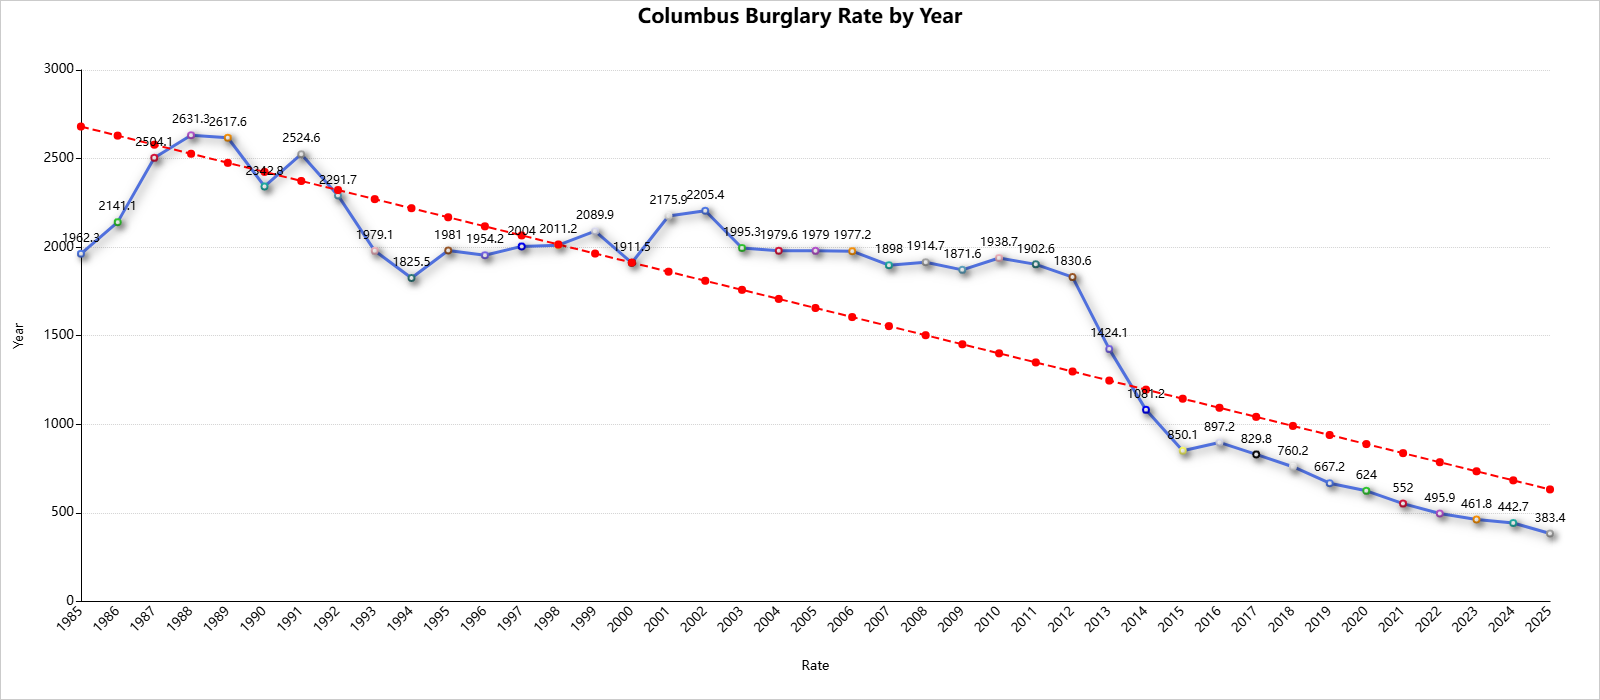
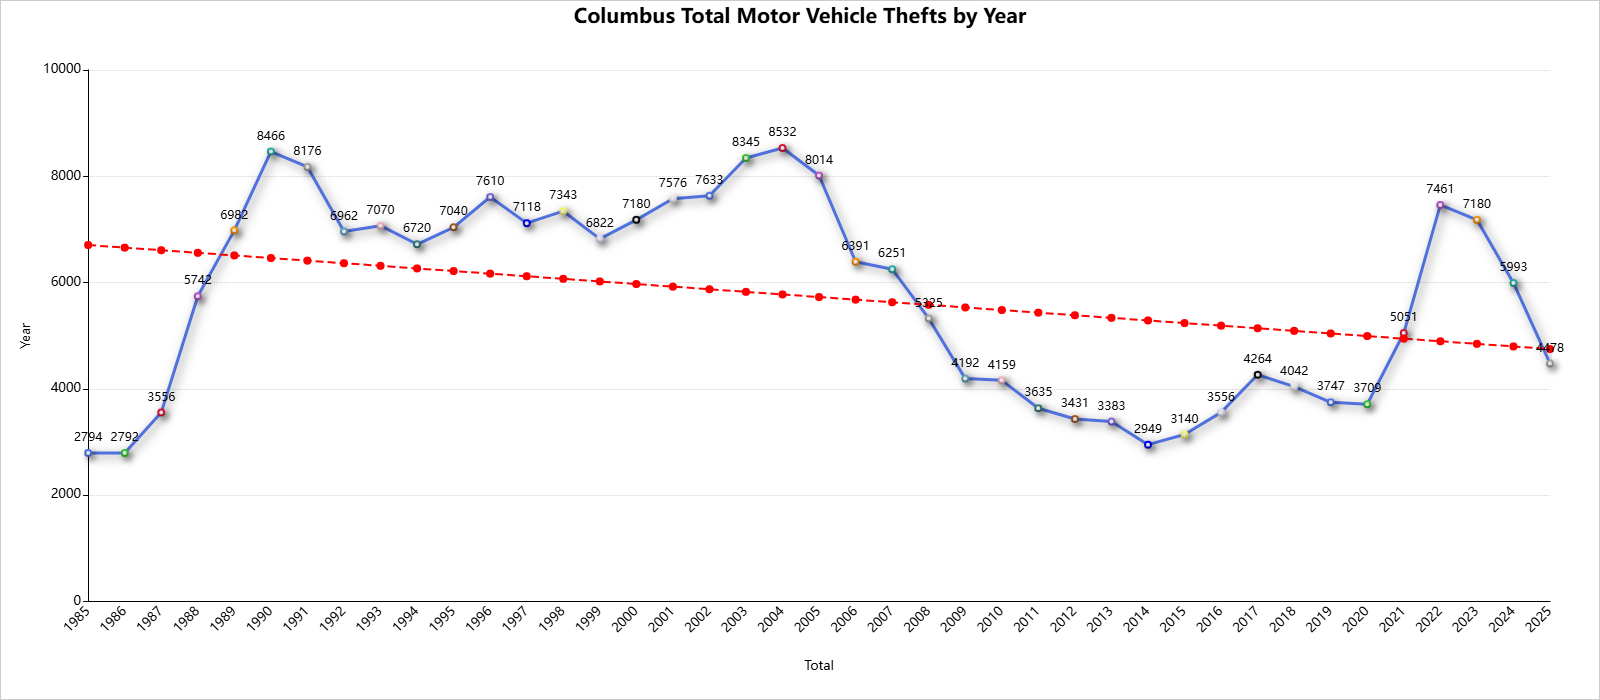
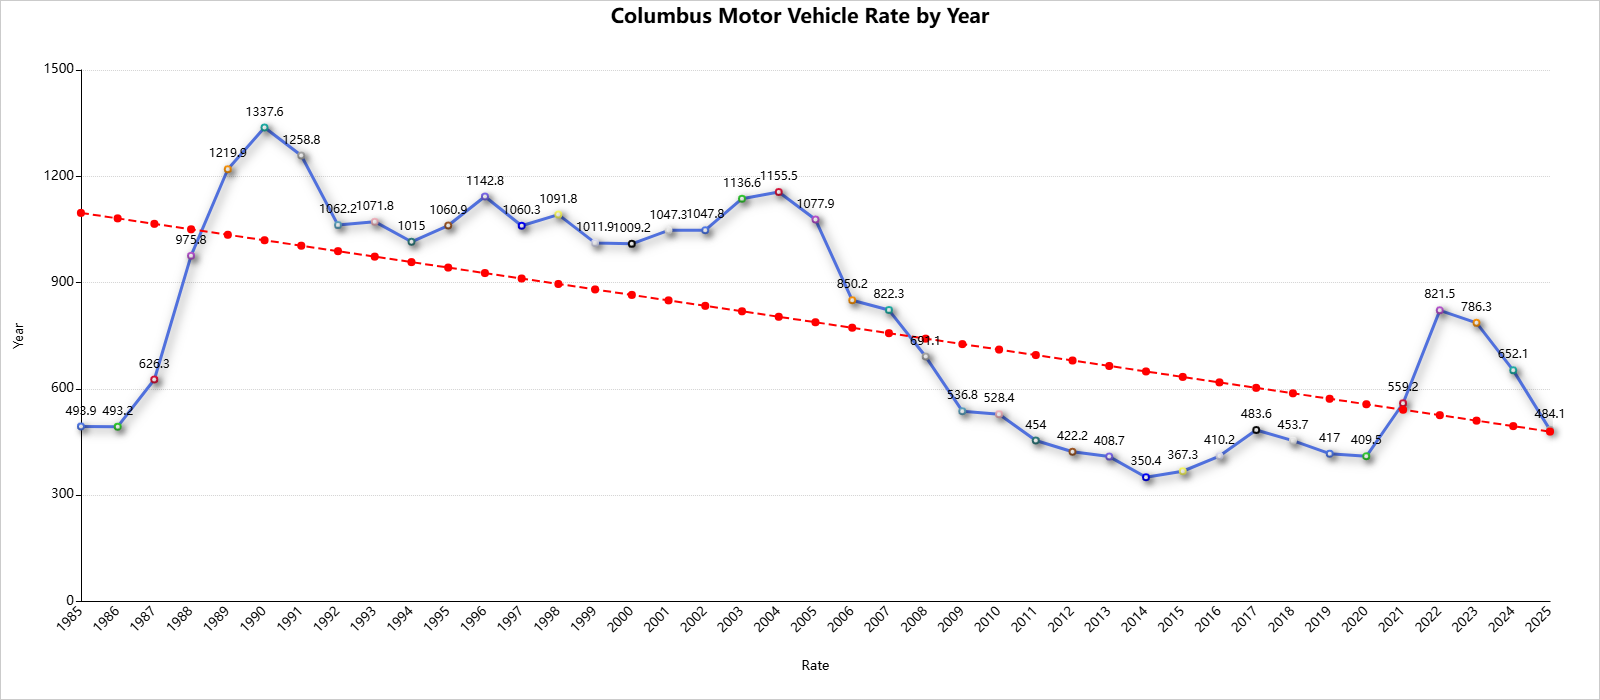
Motor vehicle thefts have been the only property crime to see an increase in recent years, and it has been a fairly massive spike. This is almost entirely attributed to thefts of Kias and Hyundais. These pushed total thefts to their highest level in 17 years in 2022, but totals and rate are still below most years between the late 1980s-about 2004.
For information on Ohio’s far too many cold cases, visit
Ohio Cold Cases
You can search cases by city, date, victim name or other information.
And for a decent interactive crime map, the 10TV 10TV Crime Tracker is one where you can search through crimes based on dates, crime types and other data.
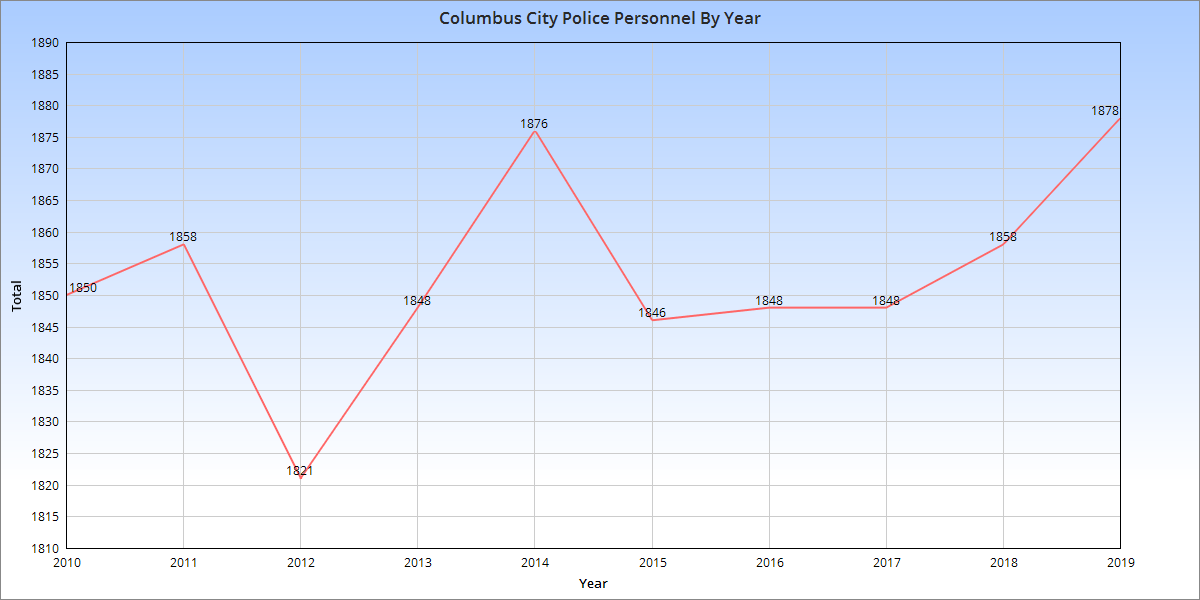
Columbus Police Statistics
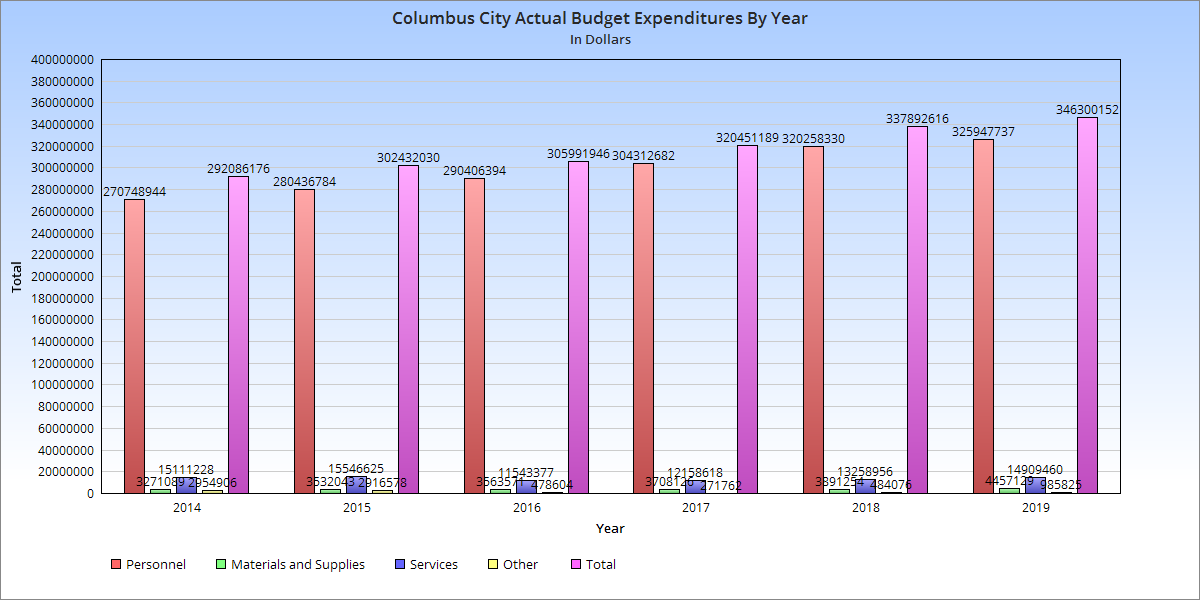
Financial Data
Physical Characteristics
Columbus Murders by Census Tract by Year
2009 Murders
2008 Murders
**Coming Soon**
2007 Murders
2006 Murders
2005 Murders
To see more local population and demographics data, visit:
Population and Demographics