**Last Updated: 5/23/2026- Updated overall metro, city and industry through 2025, and GDP data through 2024.
Columbus economic data generally goes back to 1990 and comes from the Bureau of Labor Statistics.
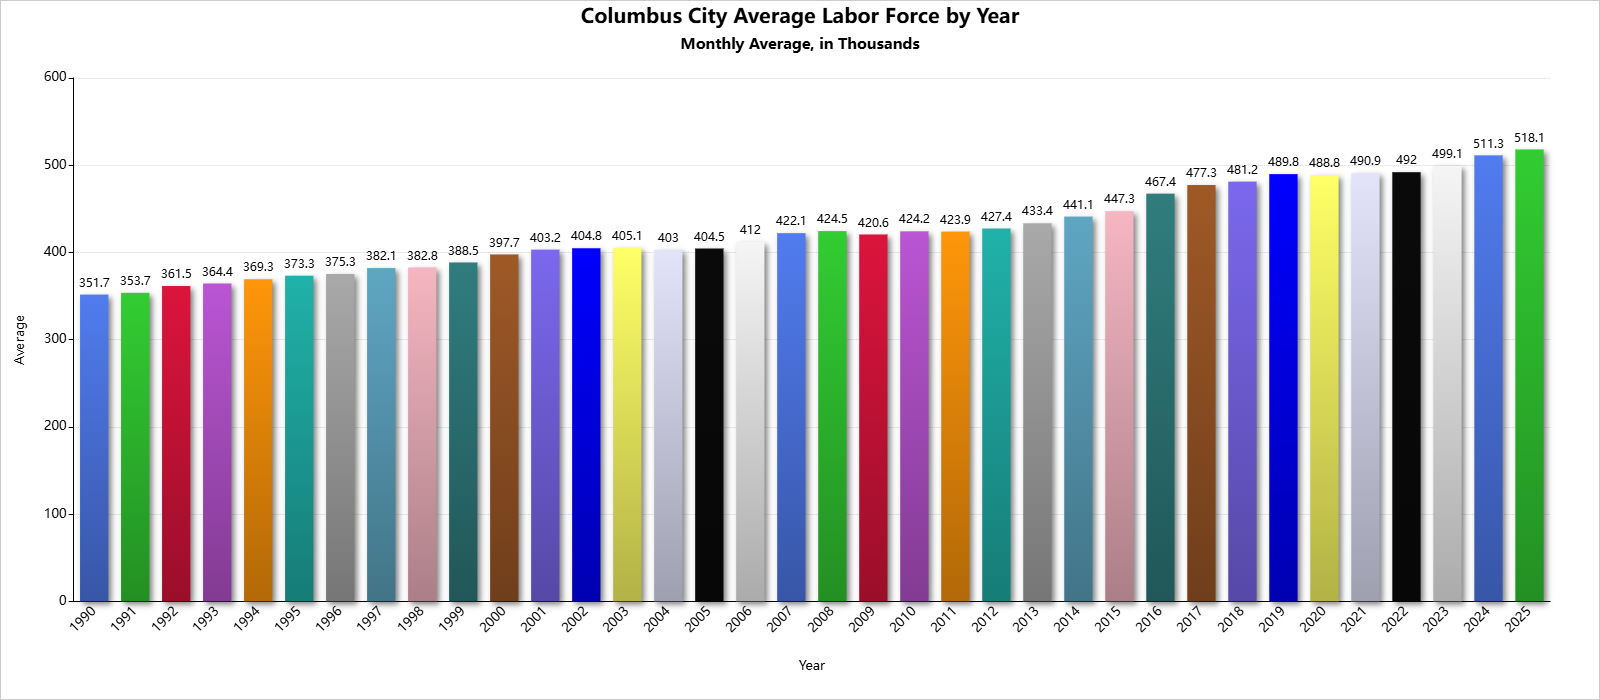
The first statistic we’ll look at is the Civilian Labor Force, which measures how many people are considered to be within the local labor force, either as employed or unemployed and looking for work.
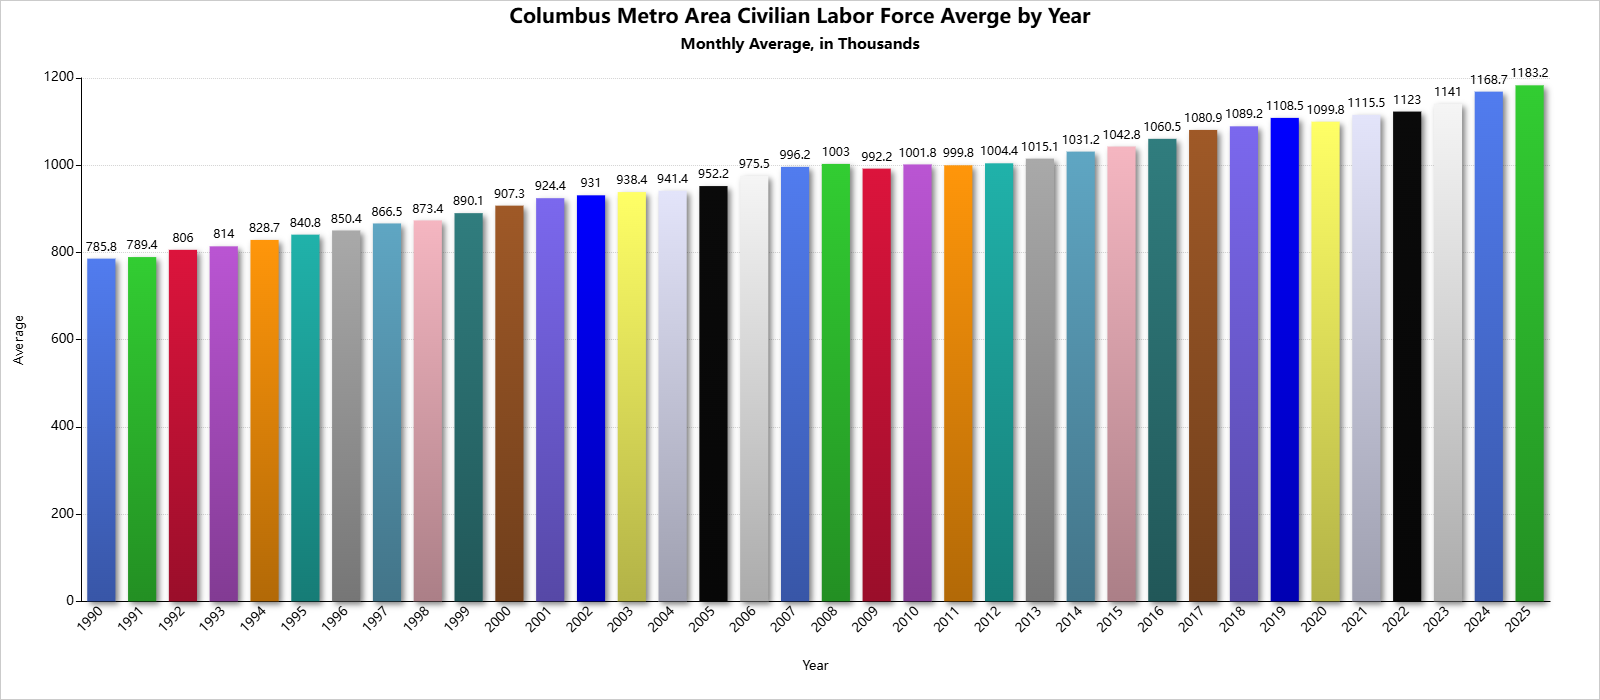
Columbus’ civilian labor force has been growing fairly steadily throughout the past 30+ years, with only very small drops during the Great Recession and Covid.
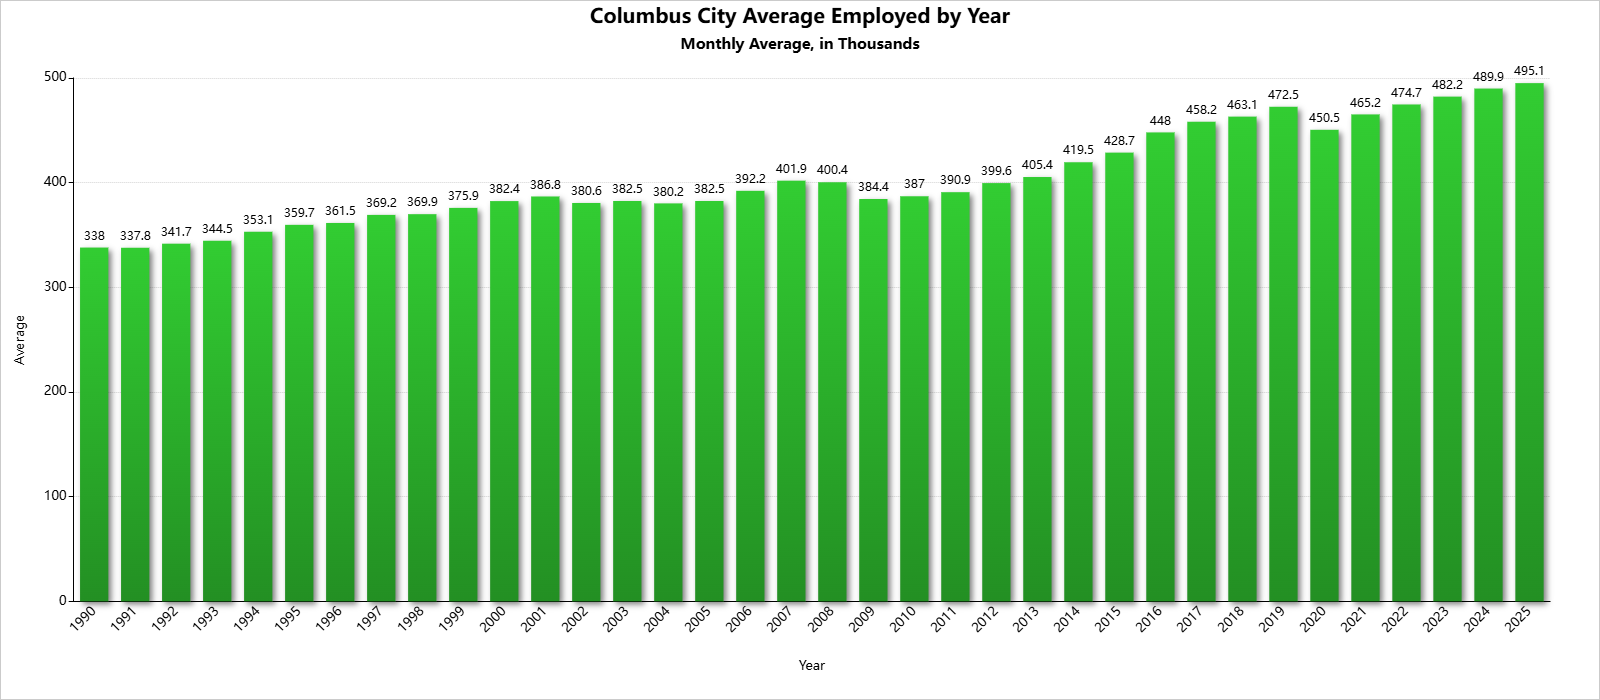
Next up is the number of people employed within the labor force.
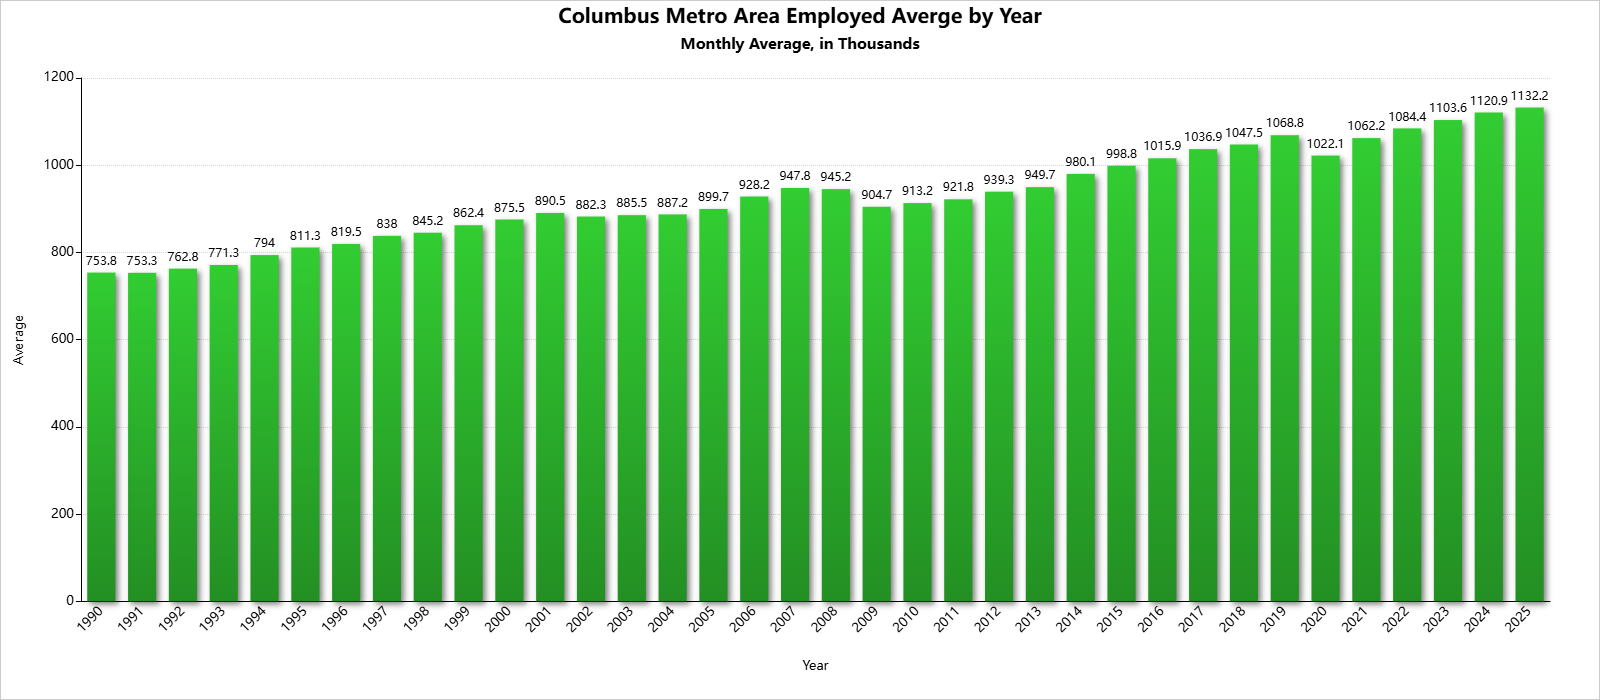
The aforementioned drops are a little more pronounced in the employed statistic.
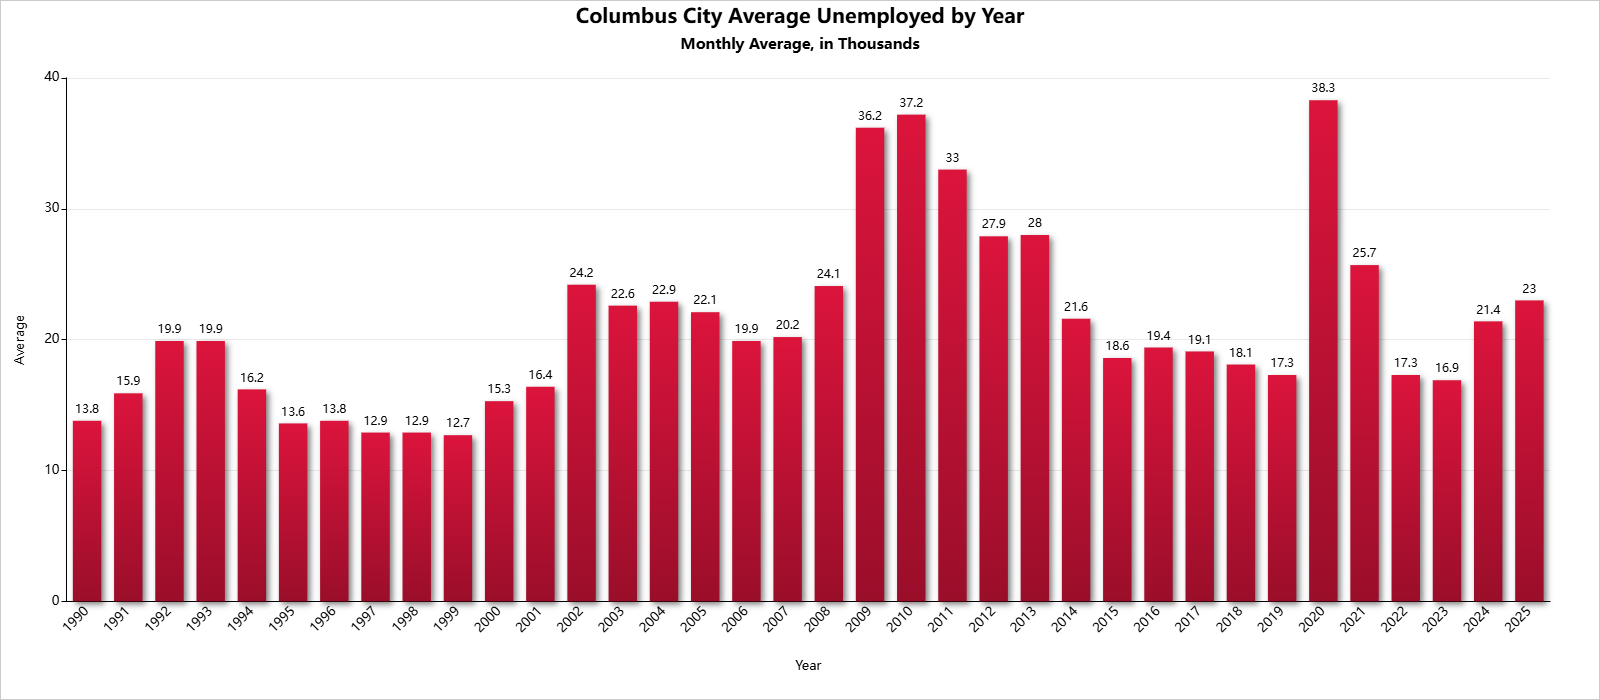
And the total people who were unemployed within the labor force.
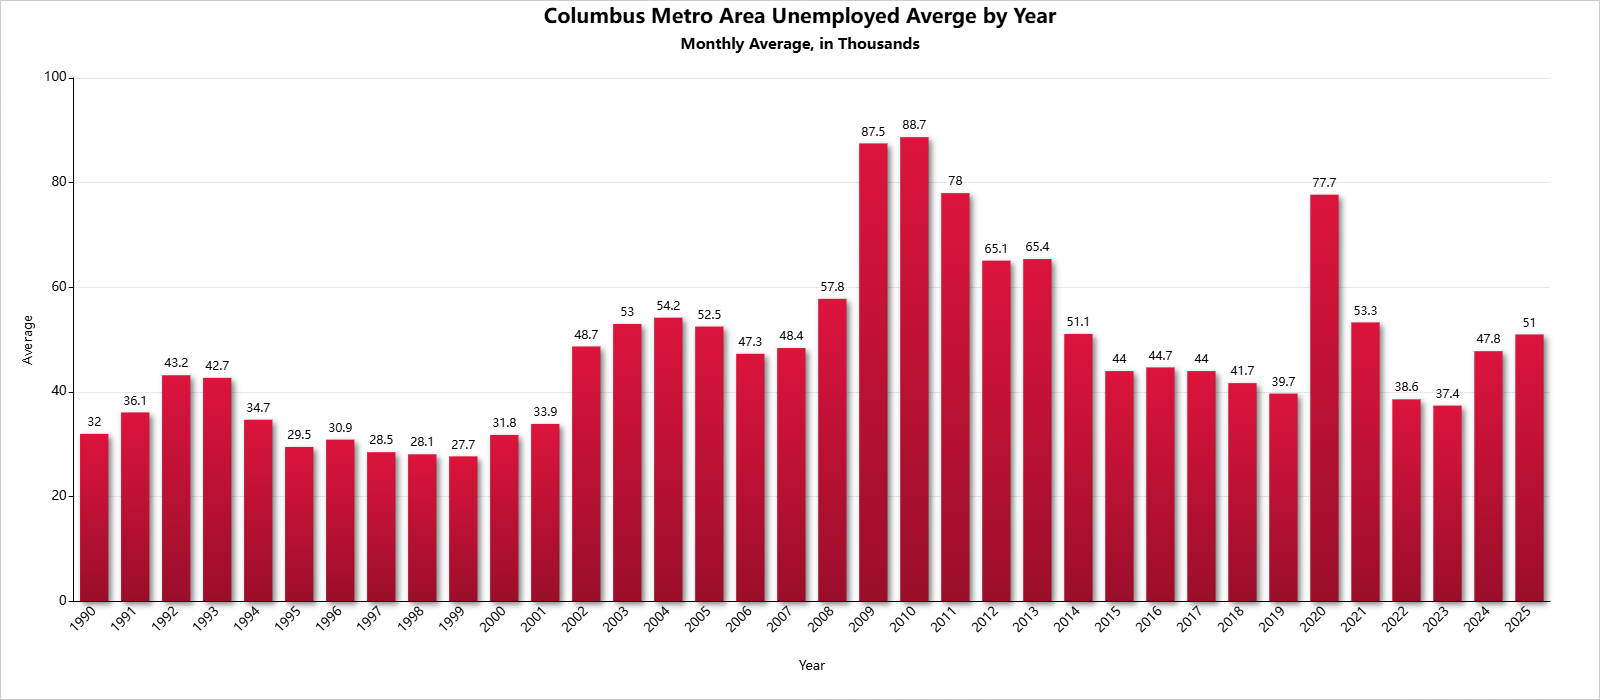
The unemployed data and unemployment rate are really where the economic downturns really show up well. The Great Recession produced the worst and longest-lasting decline, with the Covid crash being more severe, but much shorter-lived in the data.
And finally the unemployment rate.
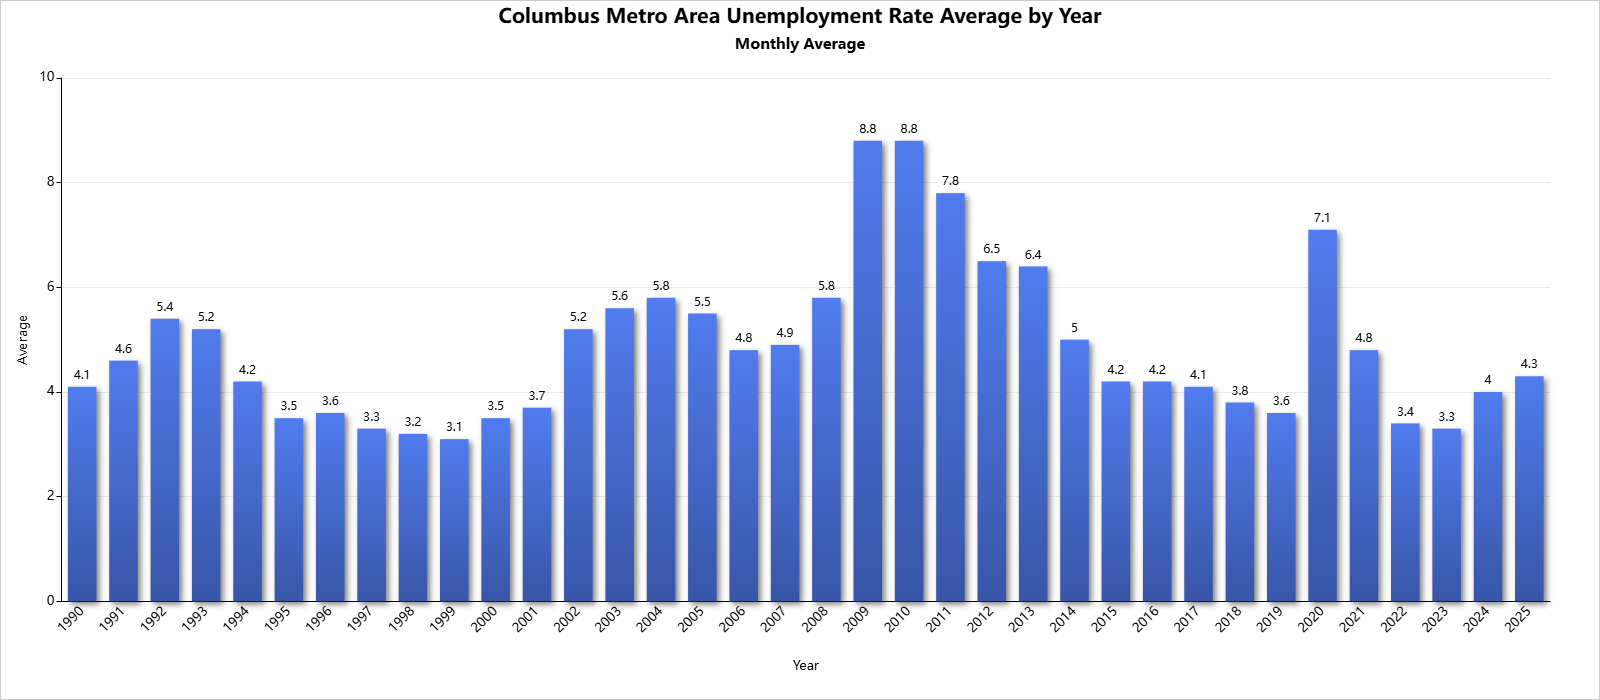
2022 was the first year since 1999 that saw the average unemployment rate falling under 3.5%, a remarkably long stretch of somewhat stagnantly higher unemployment rates, and the rate in 2023 matched the lowest since at least 1990.
Data for the City of Columbus only is also available going back to 1990.
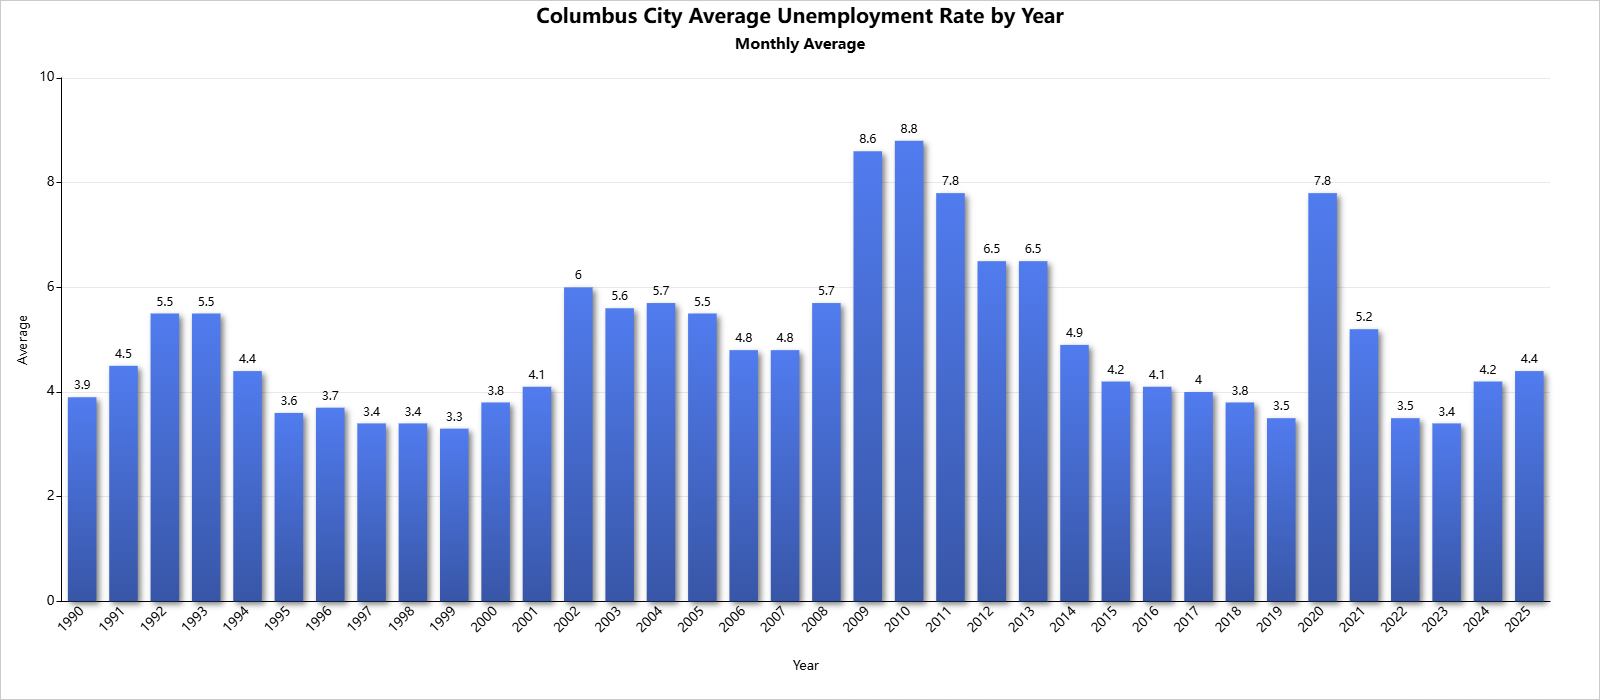
The city generally followed the same patterns as the overall metro, with the 2008-2010 Great Recession having a much longer, but in some cases less severe than the Covid downturns. The city has recovered to pre-pandemic levels and in 2023 reached the best overall economic state since the 1990s.
Metro Area Jobs by Industry
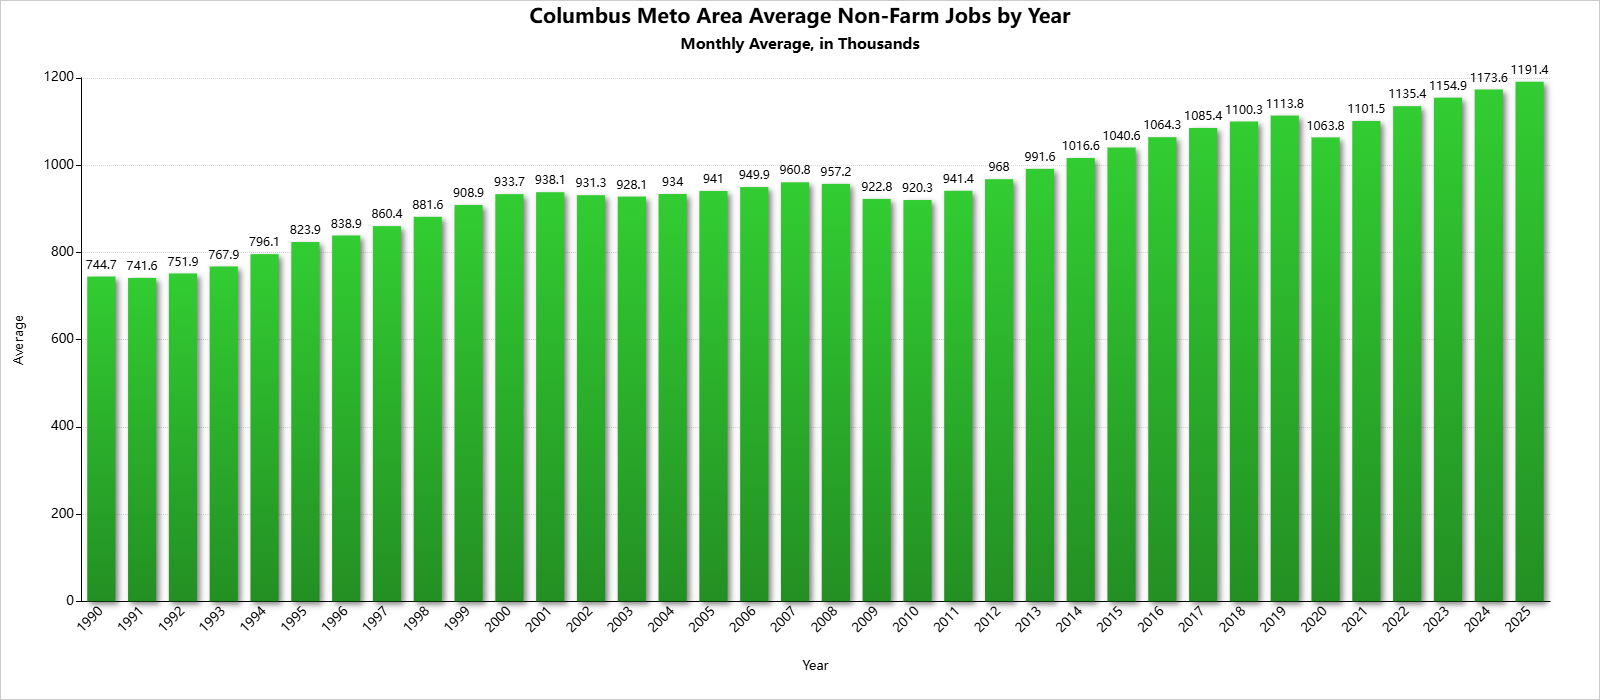
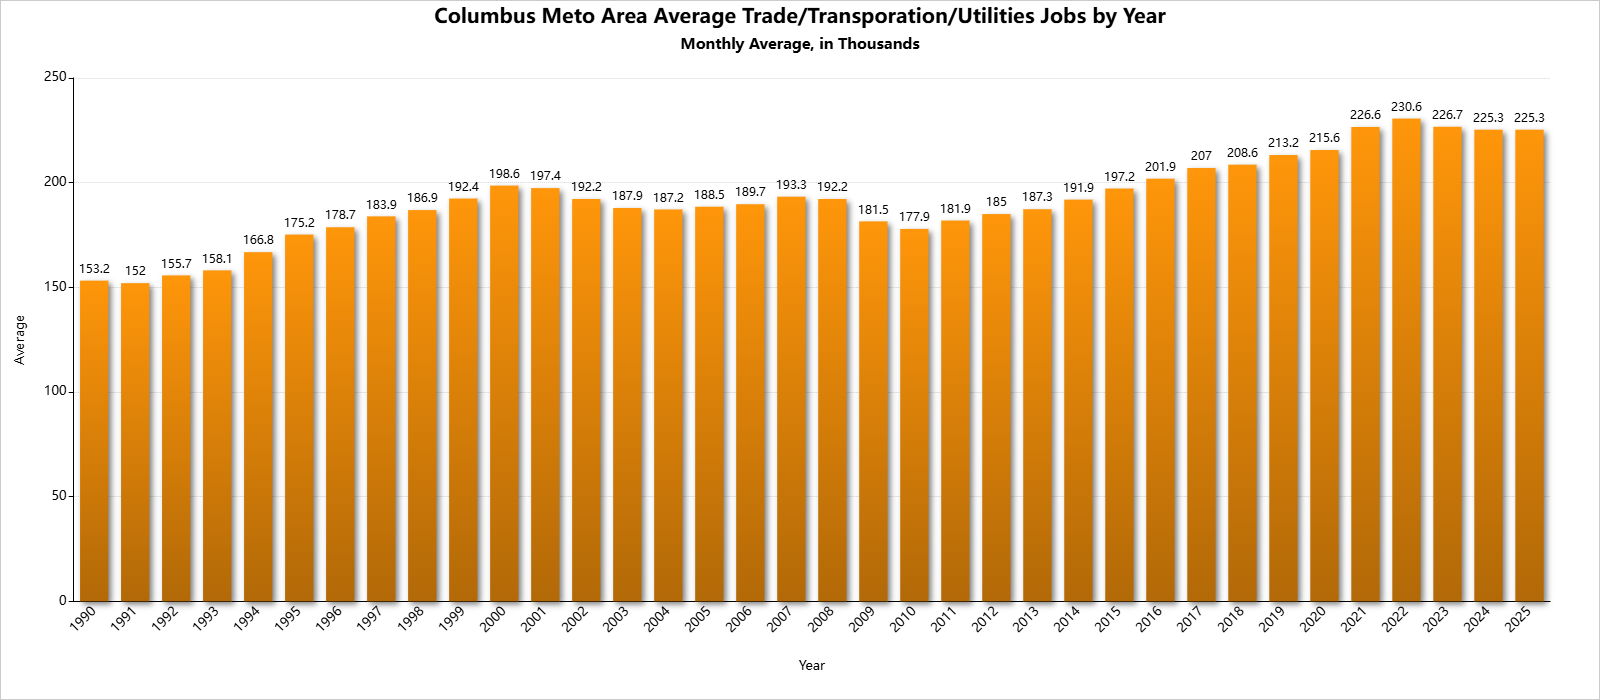
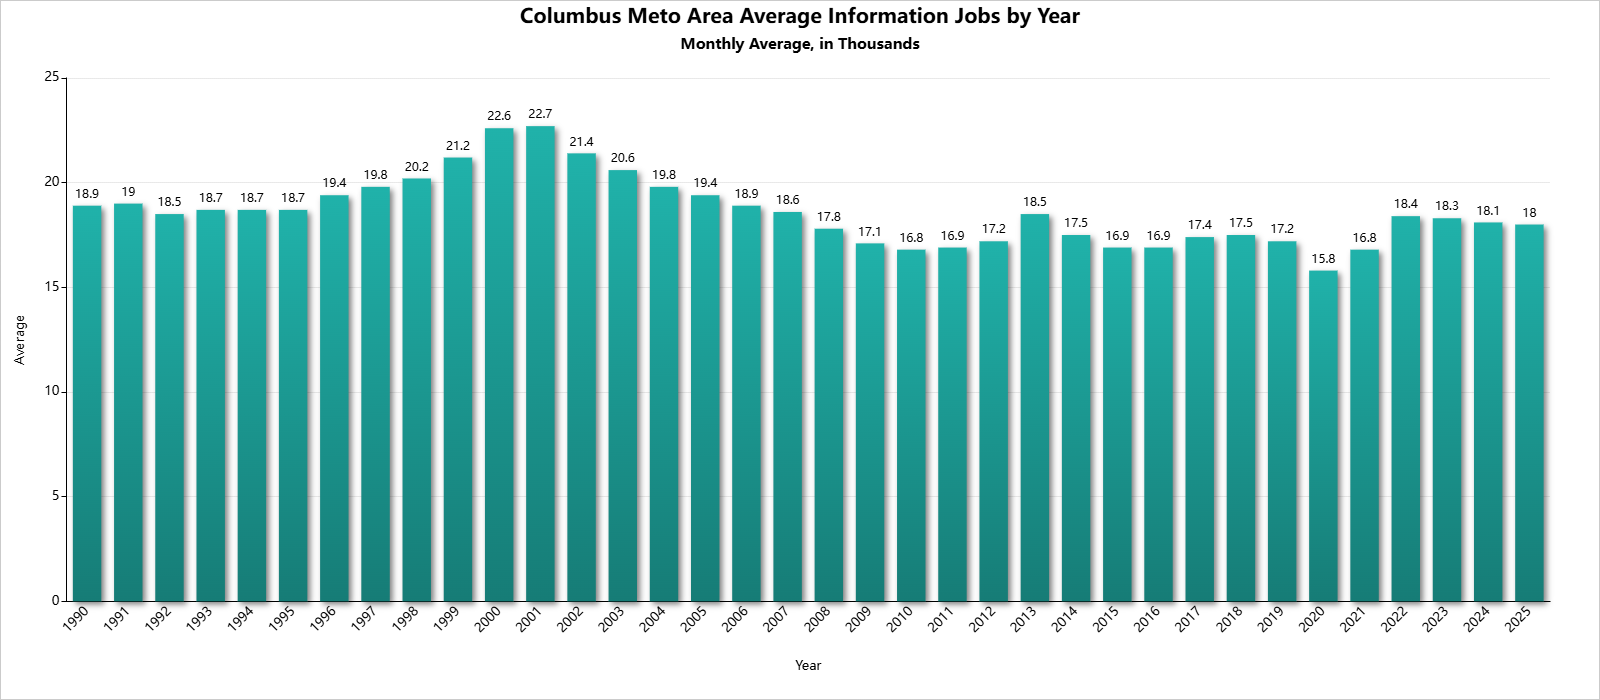
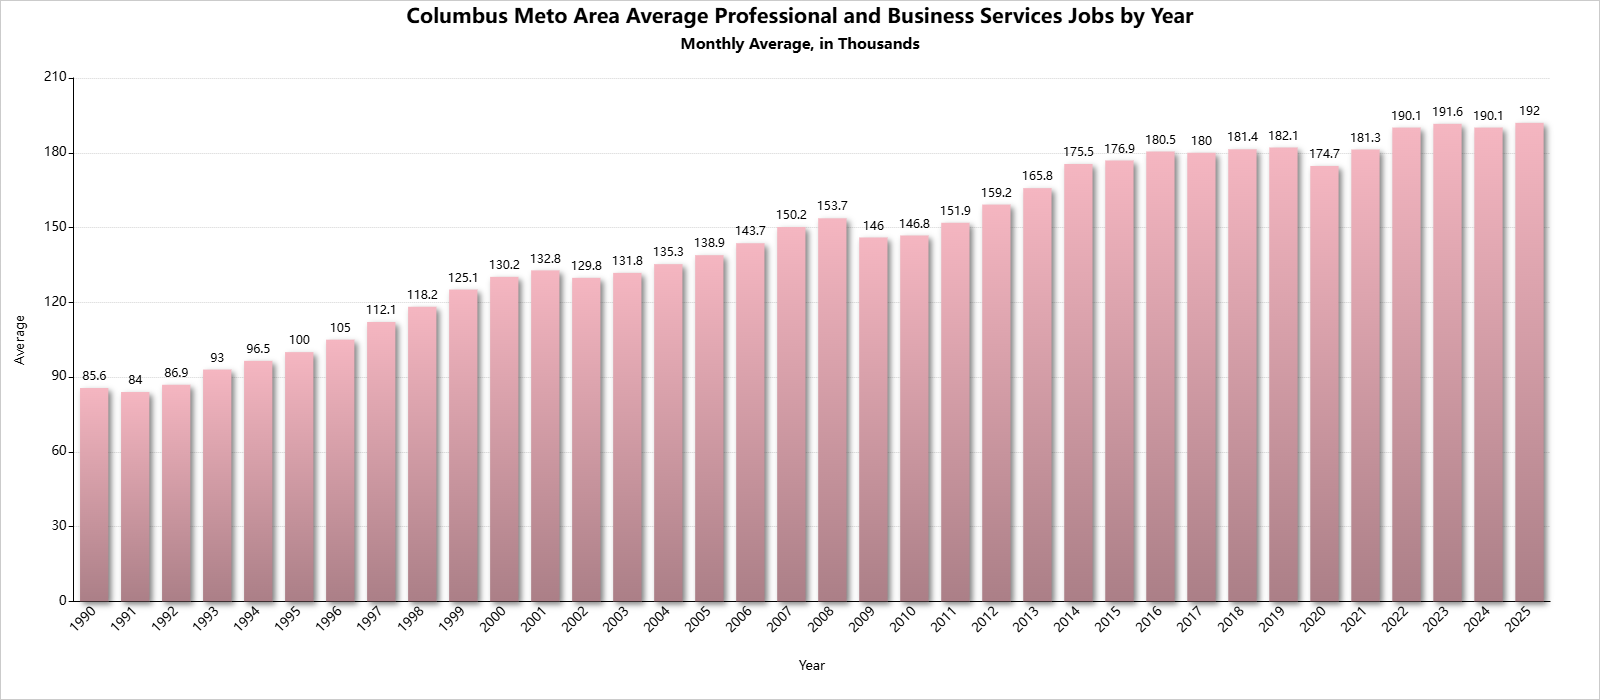
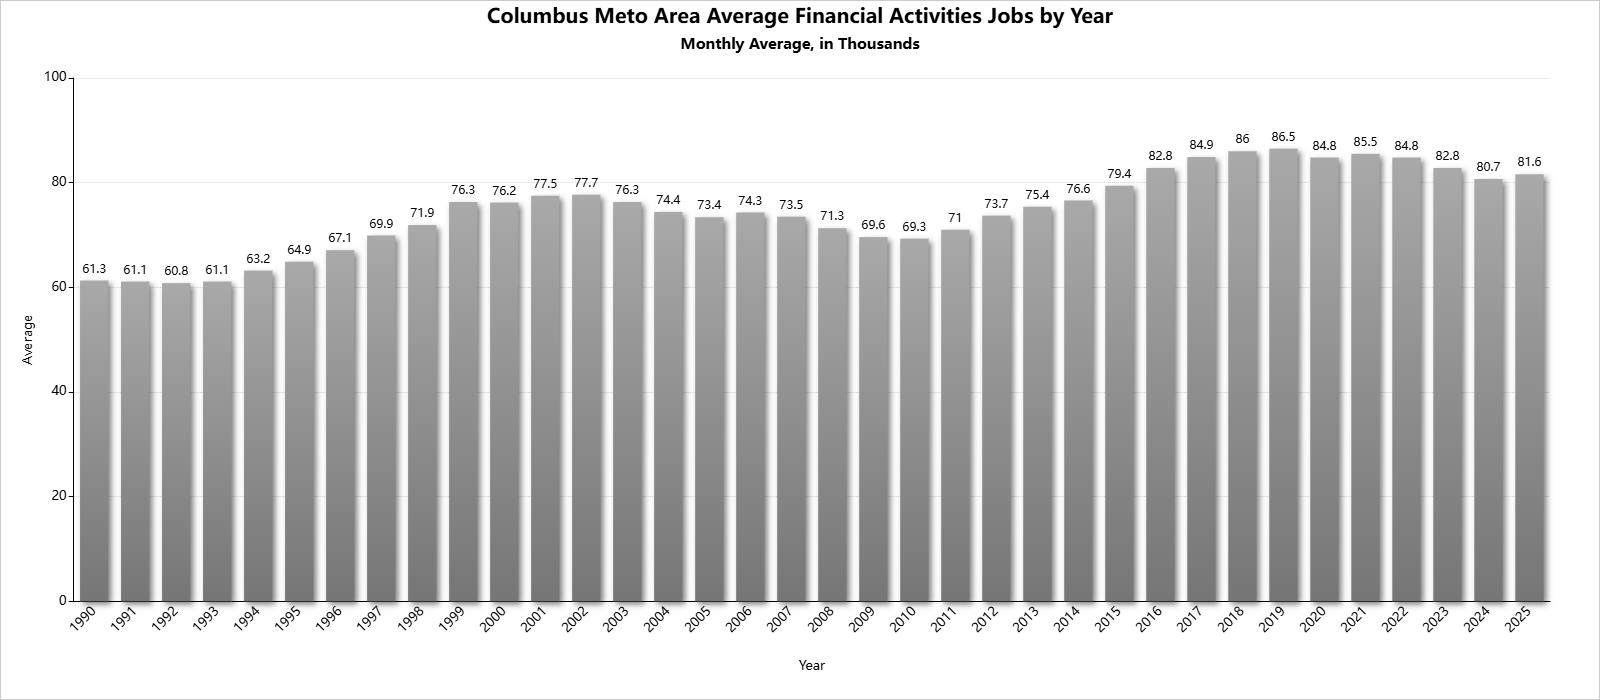
Here is how the number of jobs by industry break down as a % of total non-farm jobs.
Rank | 1990 | 1995 | 2000 | 2005 | 2010 | 2015 | 2020 | 2025 |
1 | Trade Transportation Utilities: 20.57% | Trade TransportationUtilities: 21.26% | Trade Transportation Utilities: 21.27% | Trade TransportationUtilities: 20.03% | Trade TransportationUtilities: 19.33% | Trade TransportationUtilities: 18.95% | Trade TransportationUtilities: 20.27% | Trade TransportationUtilities: 18.91% |
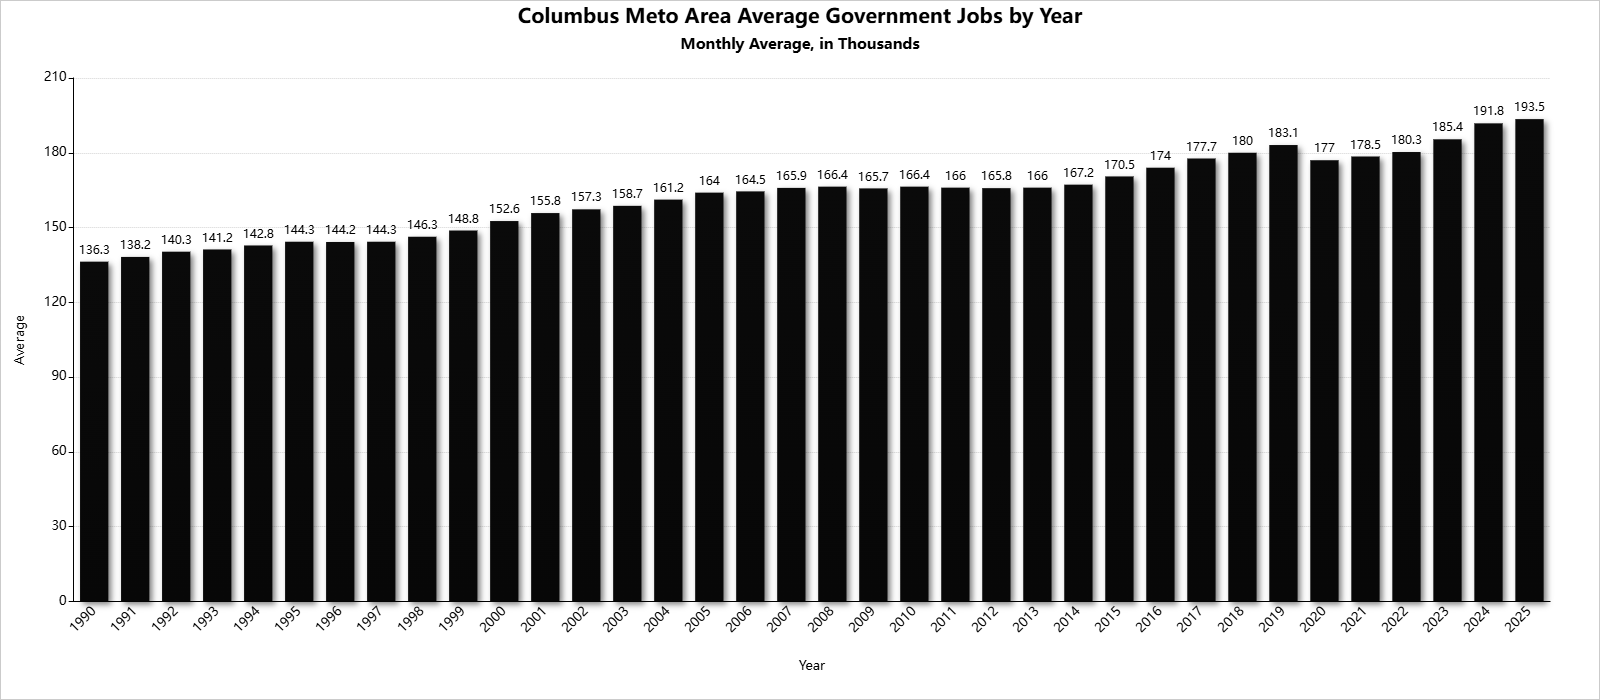
2 | Government: 18.3% | Government: 17.51% | Government: 16.34% | Government: 17.43% | Government: 18.08% | Professional and Business Services: 17.0% | Government: 16.64% | Government: 16.24% |
3 | Manufacturing: 13.47% | Manufacturing: 12.51% | Professional and Business Services: 13.94% | Professional and Business Services: 14.76% | Professional and Business Services: 15.95% | Government: 16.38% | Professional and Business Services: 16.42% | Professional and Business Services: 16.12% |
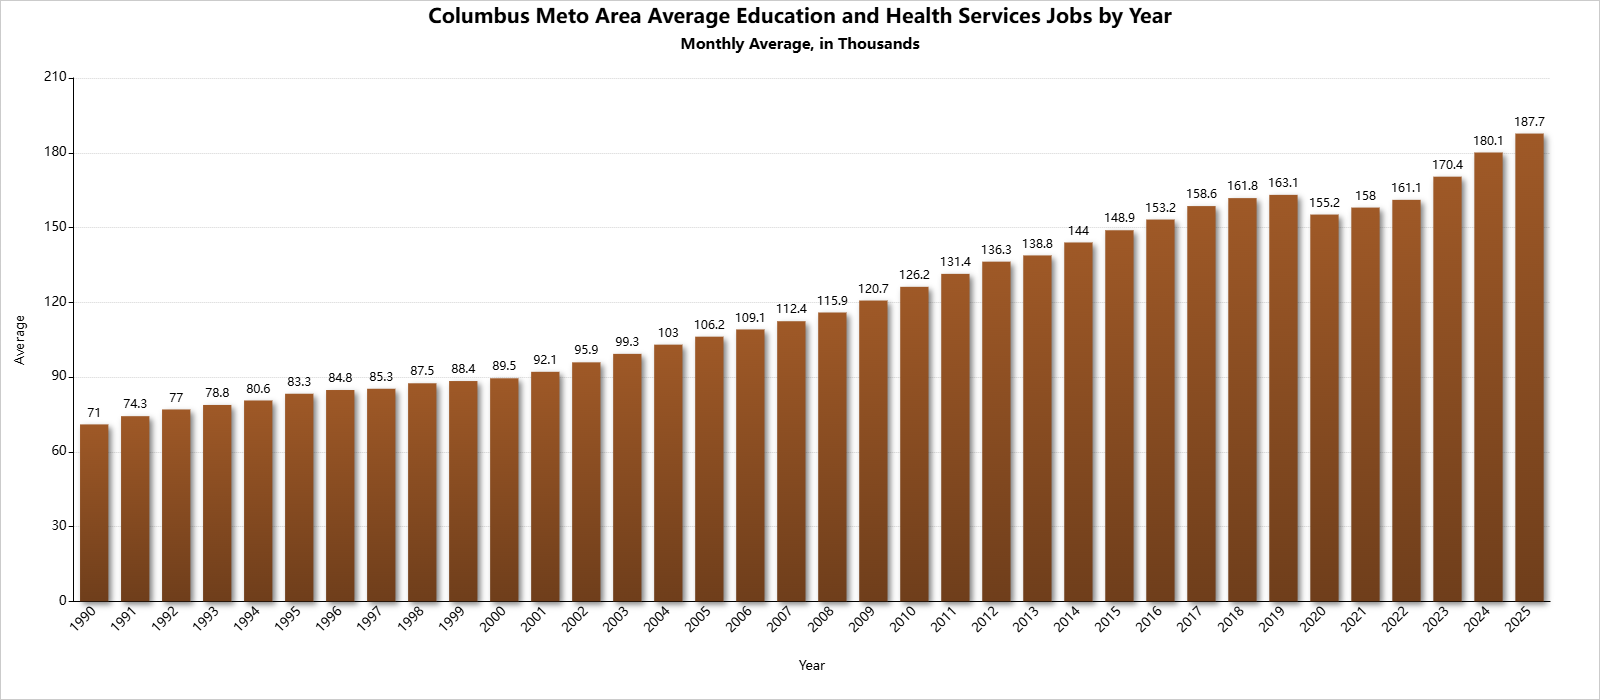
4 | Professional and Business Services: 11.49% | Professional and Business Services: 12.14% | Manufacturing: 11.16% | Education and Health Services: 11.29% | Education and Health Services: 13.71% | Education and Health Services: 14.31% | Education and Health Services: 14.59% | Education and Health Services: 15.75% |
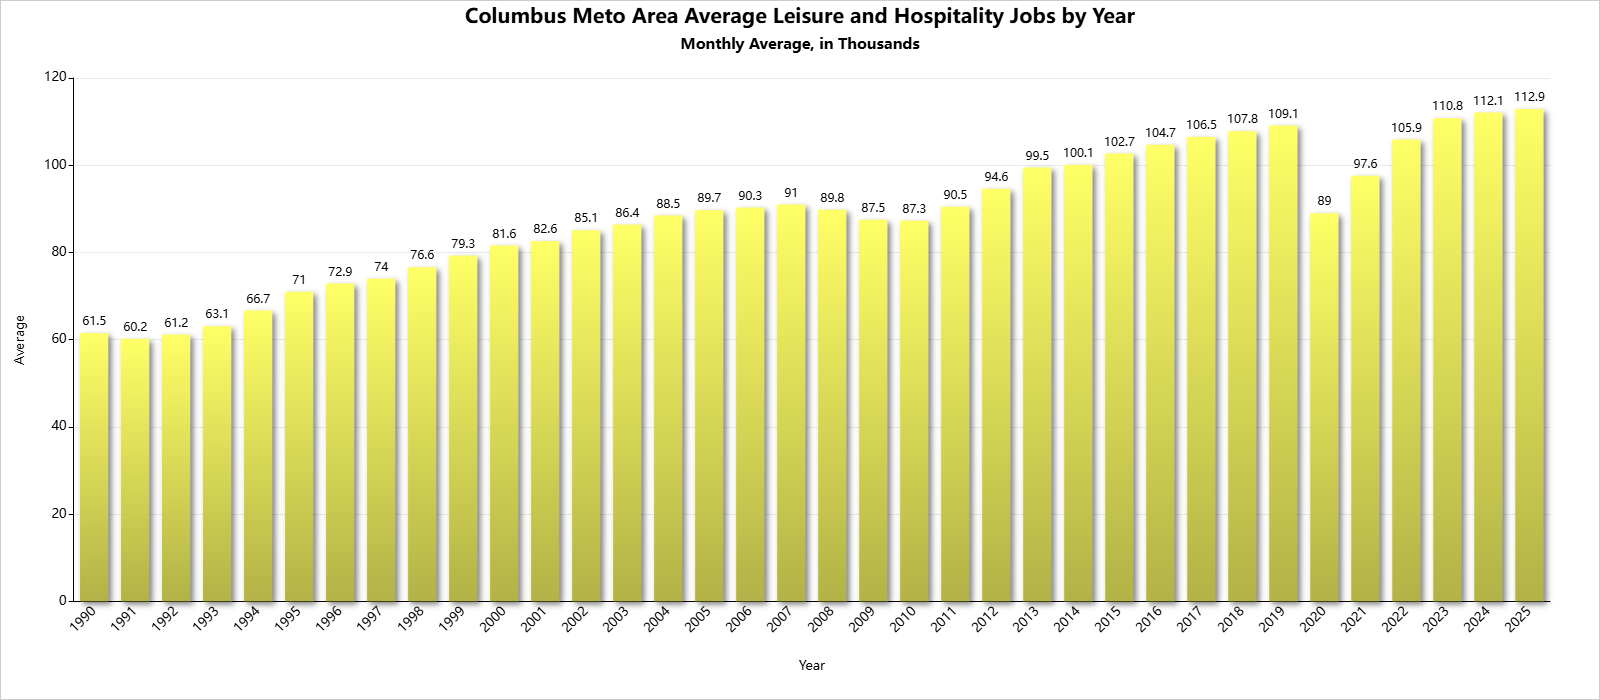
5 | Education and Health Services: 9.53% | Education and Health Services: 10.11% | Education and Health Services: 9.59% | Leisure and Hospitality: 9.53% | Leisure and Hospitality: 9.49% | Leisure and Hospitality: 9.87% | Leisure and Hospitality: 8.37% | Leisure and Hospitality: 9.48% |
6 | Leisure and Hospitality: 8.26% | Leisure and Hospitality: 8.62% | Leisure and Hospitality: 8.74% | Manufacturing: 8.64% | Financial Services: 7.53% | Financial Services: 7.63% | Financial Services: 7.97% | Financial Activities: 6.85% |
7 | Finacial Activities: 8.23% | Financial Activities: 7.88% | Financial Activities: 8.16% | Financial Services: 7.8% | Manufacturing: 7.06% | Manufacturing: 6.89% | Manufacturing: 6.6% | Manufacturing: 6.45% |
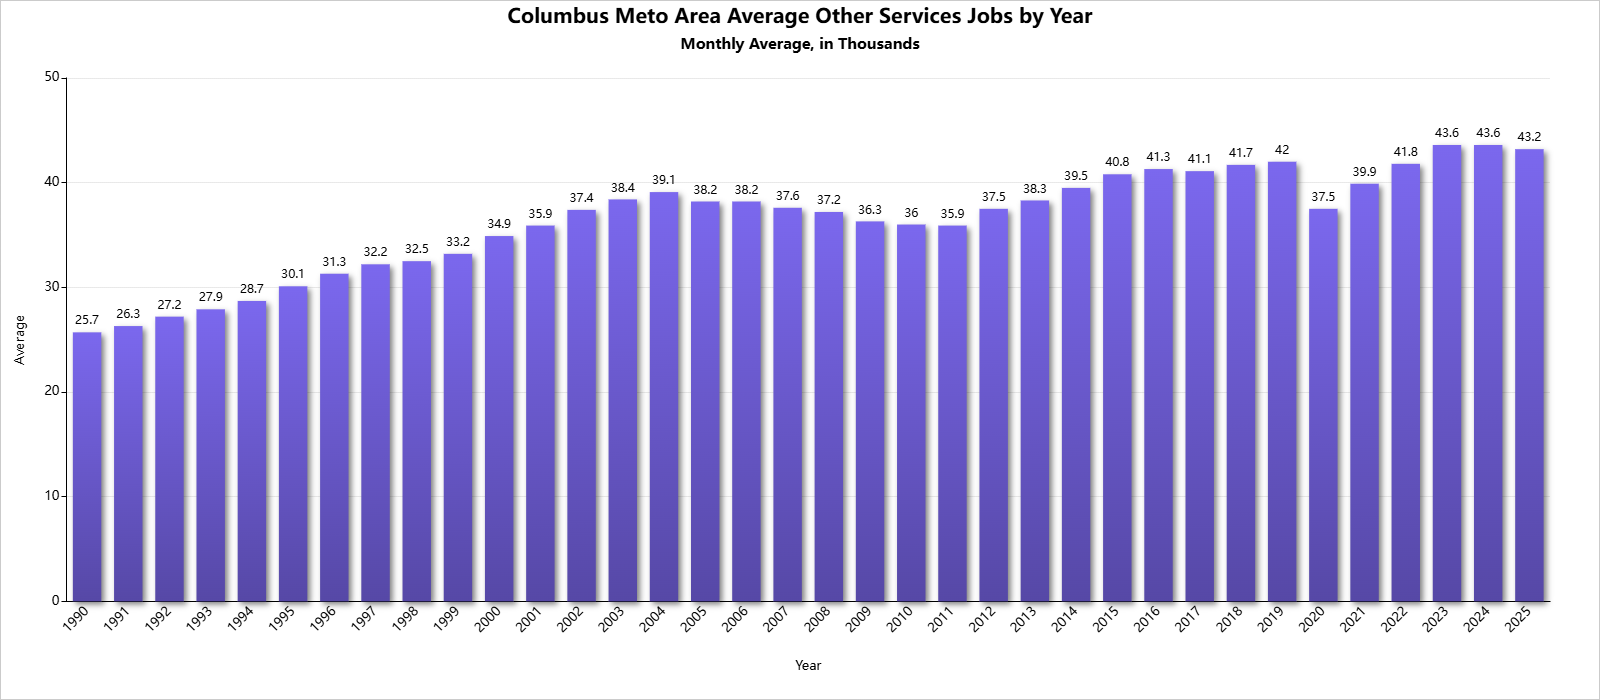
8 | Mining Logging Construction: 4.15% | Mining Logging Construction: 4.04% | Mining Logging Construction: 4.64% | Mining Logging Construction: 4.41% | Other Services: 3.91% | Other Services: 3.92% | Mining Logging Construction: 4.12% | Mining Logging Construction: 5.08% |
9 | Other Services: 3.45% | Other Services: 3.65% | Other Services: 3.74% | Other Services: 4.06% | Mining Logging Construction: 3.1% | Mining Logging Construction: 3.43% | Other Services: 3.53% | Other Services: 3.63% |
10 | Information: 2.54% | Information: 2.27% | Information: 2.42% | Information: 2.06% | Information: 1.83% | Information: 1.62% | Information: 1.49% | Information: 1.51% |
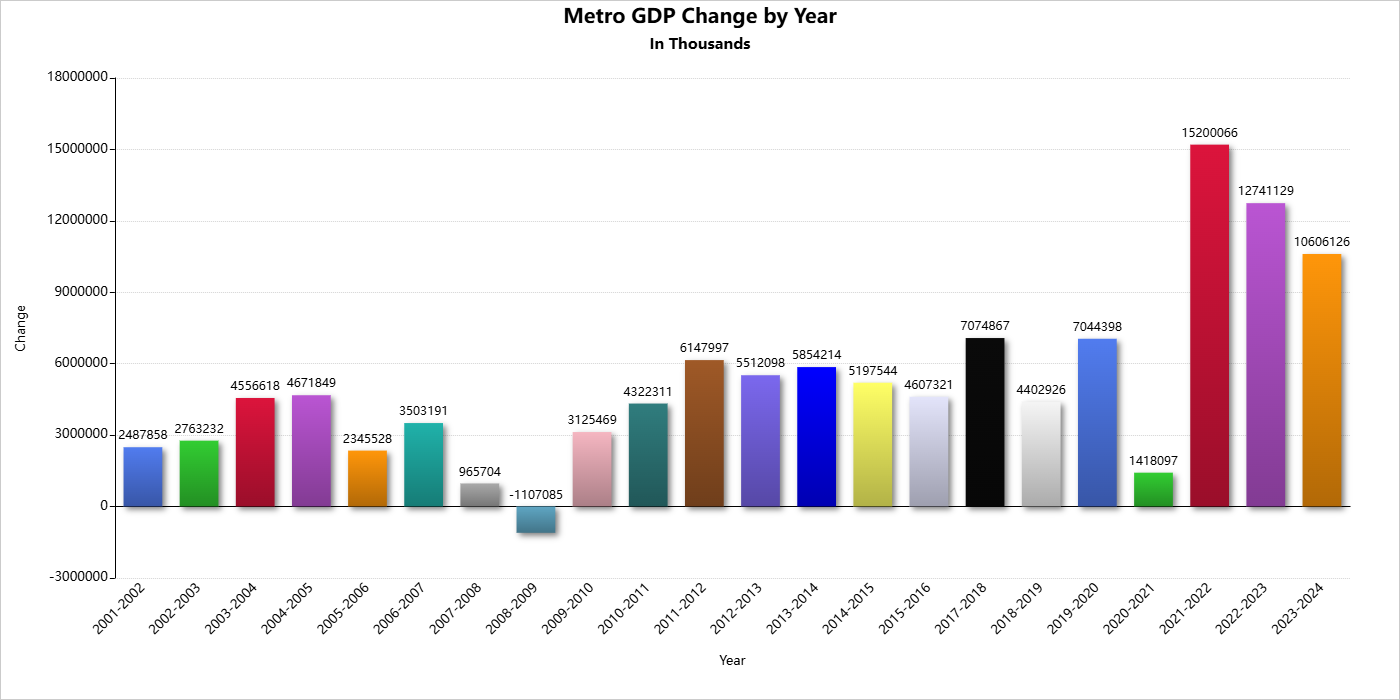
County and Metro Gross Domestic Product
County GDP in Thousands of Dollars | ||||||||||||||||||||||||
County | 2001 | 2002 | 2003 | 2004 | 2005 | 2006 | 2007 | 2008 | 2009 | 2010 | 2011 | 2012 | 2013 | 2014 | 2015 | 2016 | 2017 | 2018 | 2019 | 2020 | 2021 | 2022 | 2023 | 2024 |
Delaware | $3,354,994 | $3,837,051 | $4,634,863 | $5,205,253 | $5,831,222 | $6,305,299 | $6,835,261 | $7,110,708 | $7,221,291 | $7,672,323 | $8,290,189 | $9,007,980 | $9,609,412 | $9,966,724 | $10,360,376 | $10,707,994 | $11,628,551 | $12,243,911 | $13,449,703 | $13,458,233 | $14,958,154 | $16,423,887 | $17,780,821 | $19,132,707 |
Fairfield | $2,352,505 | $2,526,414 | $2,657,191 | $2,815,577 | $=2,921,730 | $2,986,896 | $3,128,287 | $3,178,375 | $3,123,523 | $3,341,718 | $3,474,622 | $3,625,633 | $3,765,145 | $3,964,113 | $4,051,435 | $4,319,564 | $4,536,406 | $4,528,420 | $4,848,948 | $4,951,752 | $5,507,076 | $5,954,000 | $6,504,510 | $6,849,195 |
Franklin | $52,352,768 | $54,193,517 | $55,453,825 | $58,312,692 | $61,803,782 | $63,614,540 | $66,353,781 | $67,305,785 | $66,299,092 | $68,300,990 | $71,206,829 | $76,199,577 | $80,404,981 | $85,207,020 | $89,112,886 | $92,597,258 | $97,564,396 | $100,592,118 | $105,256,639 | $105,999,383 | $117,054,801 | $125,924,201 | $134,481,840 | $141,972,302 |
Hocking | $425,873 | $464,376 | $475,565 | $495,239 | $524,866 | $542,614 | $567,006 | $554,609 | $545,735 | $559,281 | $567,036 | $581,116 | $594,981 | $597,614 | $607,369 | $629,322 | $632,148 | $629,779 | $661,609 | $661,664 | $707,957 | $756,720 | $795,601 | $842,643 |
Licking | $3,966,627 | $3,799,032 | $3,894,430 | $4,106,216 | $4,281,620 | $4,308,915 | $4,428,711 | $4,562,674 | $4,533,042 | $4,640,555 | $4,888,227 | $4,988,015 | $5,155,816 | $5,438,727 | $5,777,428 | $5,960,861 | $6,191,705 | $6,616,482 | $7,186,190 | $7,688,024 | $8,714,064 | $9,481,441 | $10,517,804 | $11,122814 |
Madison | $875,151 | $929,880 | $1,036,174 | $1,195,553 | $1,209,528 | $1,251,158 | $1,1,261,297 | $1,239,130 | $1,148,767 | $1,237,438 | $1,383,212 | $1,502,229 | $1,566,186 | $1,655,546 | $1,714,262 | $1,800,065 | $1,927,043 | $1,935,965 | $1,973,073 | $2,007,571 | $2,286,221 | $2,518,674 | $2,816,851 | $2,973,661 |
Morrow | $403,809 | $431,249 | $448,324 | $486,506 | $506,658 | $495,673 | $535,888 | $497,613 | $487,066 | $518,787 | $568,540 | $610,705 | $627,526 | $605,106 | $664,151 | $674,066 | $608,966 | $639,556 | $703,177 | $700,145 | $751,091 | $804,509 | $876,573 | $909,857 |
Perry | $426,294 | $467,938 | $477,025 | $493,486 | $522,606 | $531,707 | $570,650 | $564,818 | $561,117 | $603,181 | $676,124 | $637,366 | $700,962 | $668,121 | $660,691 | $682,627 | $753,378 | $767,377 | $778,488 | $774,226 | $814,986 | $869,065 | $934,106 | $937,164 |
Pickaway | $1,209,218 | $1,191,746 | $1,302,924 | $1,363,847 | $1,303,637 | $1,285,539 | $1,401,670 | $1,450,818 | $1,506,788 | $1,592,578 | $1,613,538 | $1,560,701 | $1,560,518 | $1,495,248 | $1,627,504 | $1,636,457 | $1,719,141 | $1,776,991 | $1,874,049 | $1,982,385 | $2,267,279 | $2,500,128 | $2,624,032 | $2,577,627 |
Union | $2,549,504 | $2,563,398 | $2,787,512 | $3,250,082 | $3,490,651 | $3,419,487 | $3,162,468 | $2,746,193 | $2,677,217 | $2,762,256 | $2,883,101 | $2,986,093 | $3,225,986 | $3,467,508 | $3,687,169 | $3,862,378 | $4,383,725 | $4,617,786 | $4,660,907 | $4,587,497 | $4,949,317 | $5,519,450 | $5,579,447 | $6,199,741 |
Metro Total | $67,916,743 | $70,404,601 | $73,167,833 | $77,724,451 | $82,396,300 | $84,741,828 | $88,245,019 | $89,210,723 | $88,103,638 | $91,229,107 | $95,551,418 | $101,699,415 | $107,211,513 | $113,065,727 | $118,263,271 | $122,870,592 | $129,945,459 | $134,348,385 | $141,392,783 | $142,810,880 | $158,010,946 | $170,752,075 | $182,911,585 | $193,517,711 |