From 1945 until an atmospheric test moratorium in July, 1962, atomic bomb testing in Nevada was so common that Las Vegas tourists would hold parties just to watch the tests from their hotel rooms. Little was known, at least in the beginning, about the effects of nuclear fallout, or just how far it could actually spread.
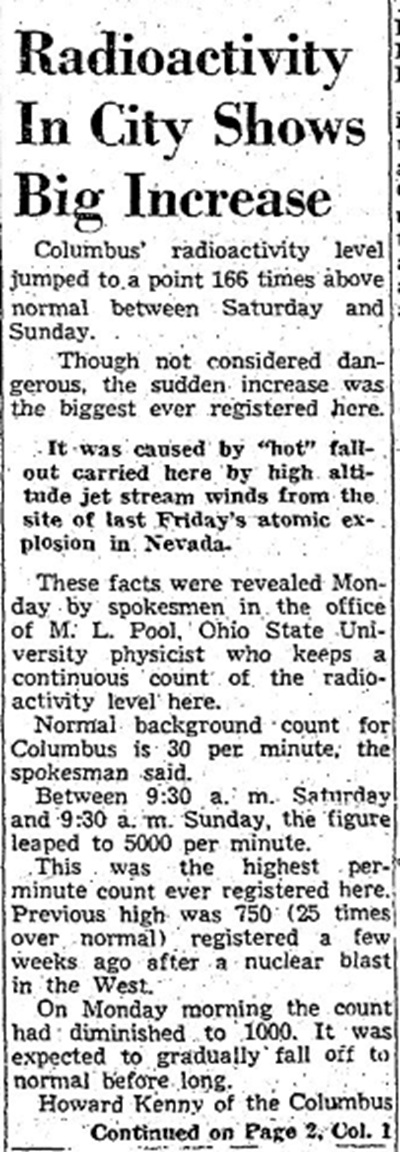
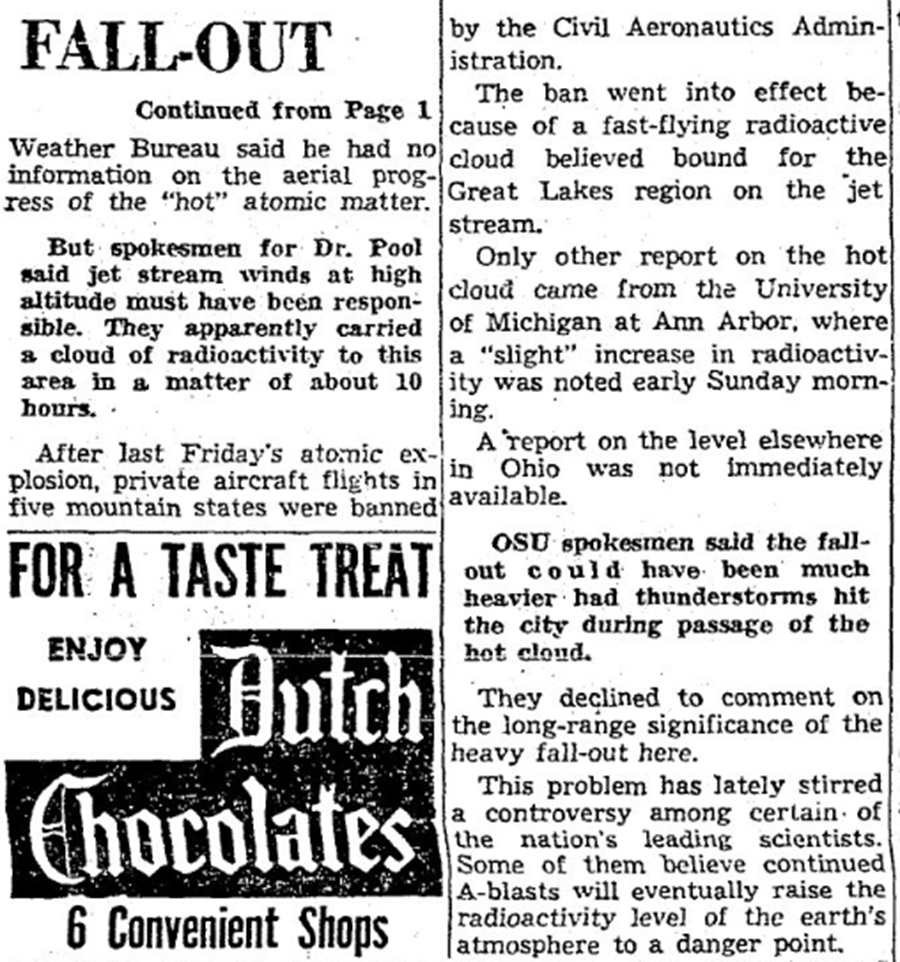
On April 18, 1955, during what was known as Operation Teapot, the Columbus Dispatch reported that radiation from the testing site had reached Columbus.
The radiation had come from the MET test which occurred on April 15, 1955. The bomb was 22 kilotons in size. The video above is from the MET test itself.
Events like this happened several times as the jet stream carried radioactive fallout across the country, and the 1955 nuclear test fallout wouldn’t be the last. It’s unclear whether this fallout had any substantial health impacts long-term, locally or otherwise, but today we understand that even relatively low doses of radiation increase one’s risk for developing cancers down the road. Luckily, these increased levels tended to last a day or two only.
The US Census has released 2024 city population estimates. These estimates are for all incorporated places.
First, let’s look at the top 25 largest Ohio cities on July 1, 2024. Purple cities moved up in the ranking since 2020 and red moved down.
Rank
City
2020
2023
2024
1
Columbus
905,939
920,569
933,263
2
Cleveland
372,626
364,276
365,379
3
Cincinnati
309,561
312,703
314,915
4
Toledo
270,877
265,798
265,638
5
Akron
190,408
189,142
189,664
6
Dayton
137,677
135,936
136,346
7
Parma
81,121
79,310
79,,350
8
Canton
70,743
69,230
69,211
9
Lorain
65,218
65,413
65,751
10
Hamilton
63,393
63,516
63,953
11
Youngstown
60,047
59,195
59,123
12
Springfield
58,644
58,041
58,138
13
Kettering
57,860
57,035
57,028
14
Elyria
52,668
53,181
53,604
15
Middletown
50,986
51,882
52,291
16
Newark
49,970
51,162
51,424
17
Cuyahoga Falls
51,116
50,865
50,979
18
Lakewood
50,940
49,564
49,517
19
Dublin
49,315
49,292
49,456
20
Euclid
49,689
48,439
48,421
21
Beavercreek
46,562
47,327
48,012
22
Mansfield
47,530
47,676
47,593
23
Mentor
47,442
47,000
47,113
24
Delaware
41,327
45,364
46,521
25
Strongsville
46,487
45,719
45,768
Columbus gained 12,694 residents July 1, 2023 to July 1, 2024. This was the 14th highest numeric change of all US cities at or above 20,000 in population. In doing so, it became Ohio’s all-time largest city by population in history, surpassing Cleveland’s historic high of 914,80 in 1950.
90% of Columbus metro places were either steady or saw outright growth 2023-2024. These numbers are much improved from the Covid era where many places were seeing population declines, especially the larger cities and suburbs.
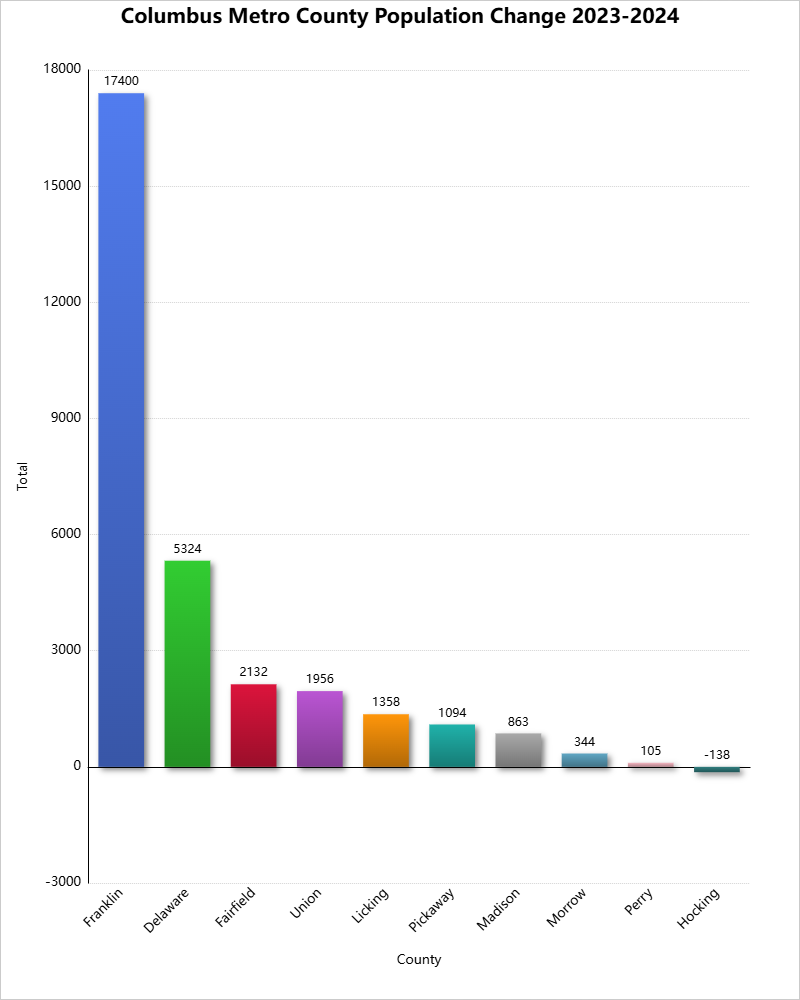
Columbus’ growth represented 73% of Franklin County’s total growth 2023-2024 and 84.1% of the county’s growth 2020-2024. Additionally, Columbus alone repesented 41.8% of the metro’s growth 2023-2024 and 31.6% of the metro’s growth 2020-2024.
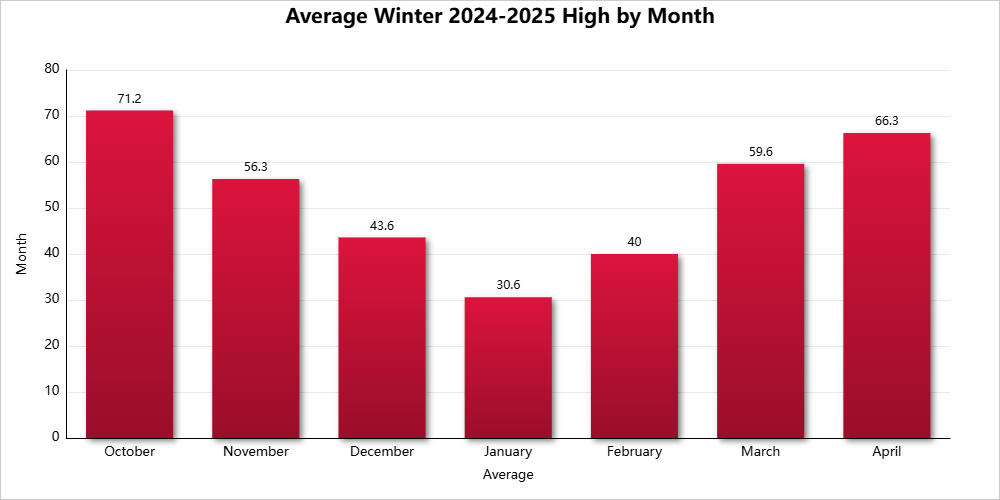
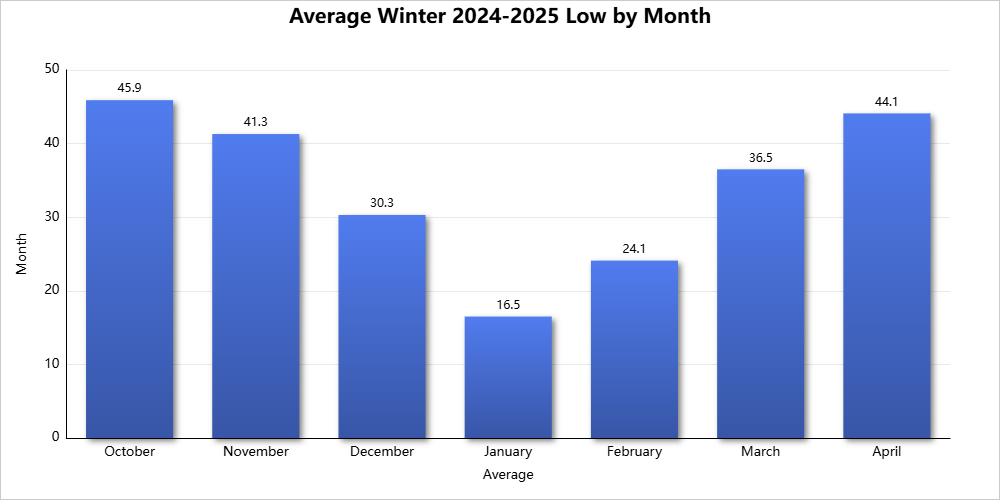
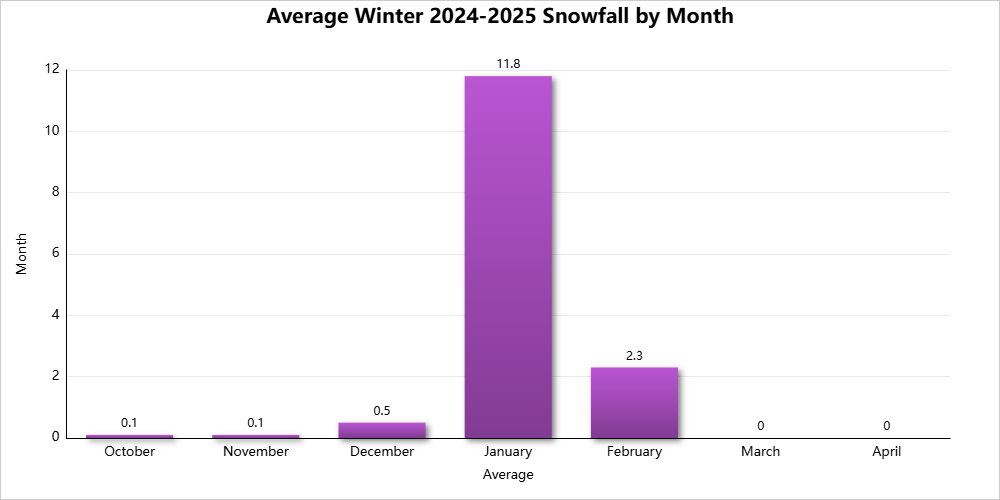
Winter 2024-2025 was the 4th season in a row in which snowfall was well below normal. Only a single winter in the past 10- 2017-2018- has had above normal snowfall, and only just. Two others- 2018-2019 and 2020-2021- had near normal snowfall, though still slightly below the 30-year average, and the other 7 have been significantly below normal. Average winter snowfall for the past decade has been just 17.8″, more than 10″ below the 1991-2020 average. Additionally, the 2024-2025 season lacked a 6″ snowfall, either daily or in any single event. There has been no 6″ snowfall since February 22, 2015, the second longest such period since records began. The December-February period was colder than normal, and it was the coldest heart of winter since 2014-2015. This was thanks largely to January, which also featured the majority of the season’s snowfall.
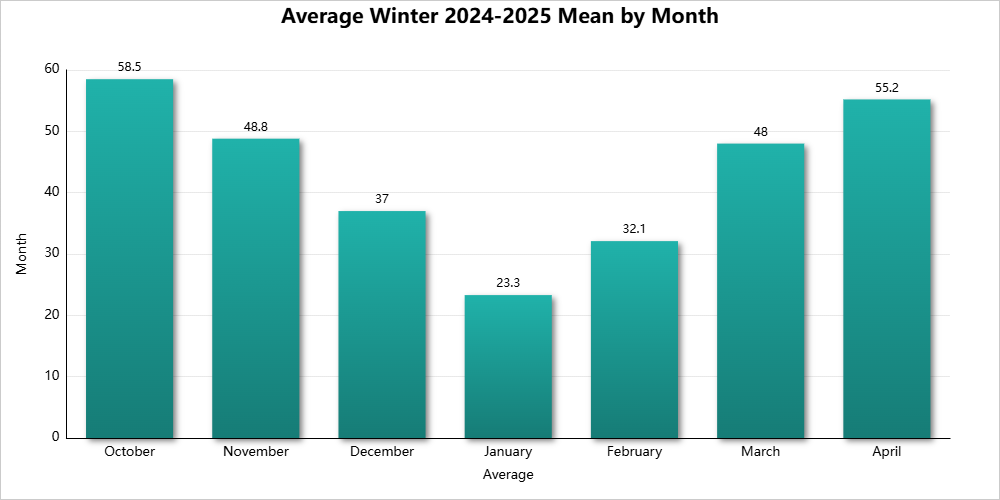
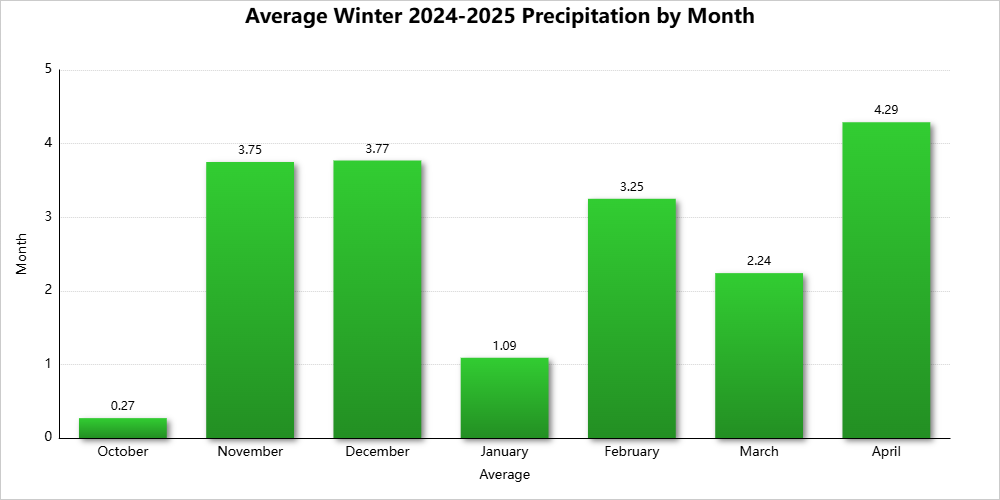
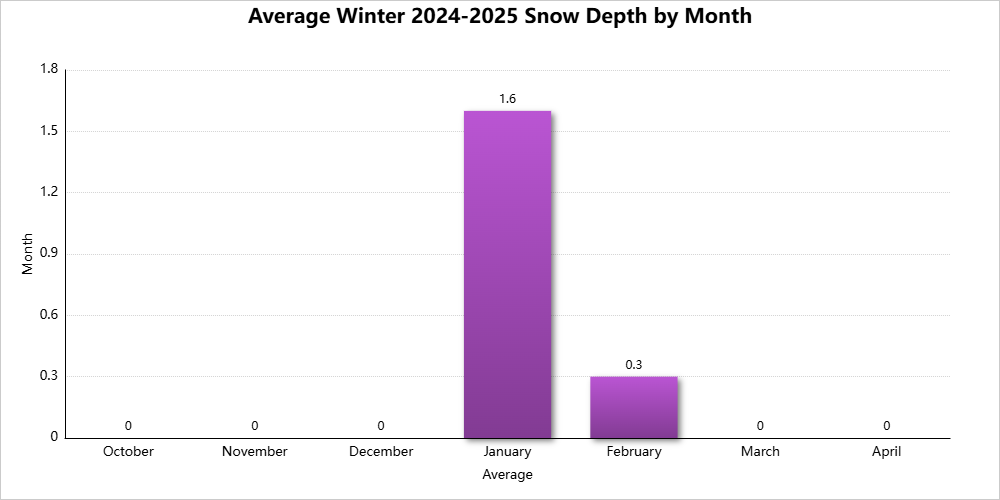
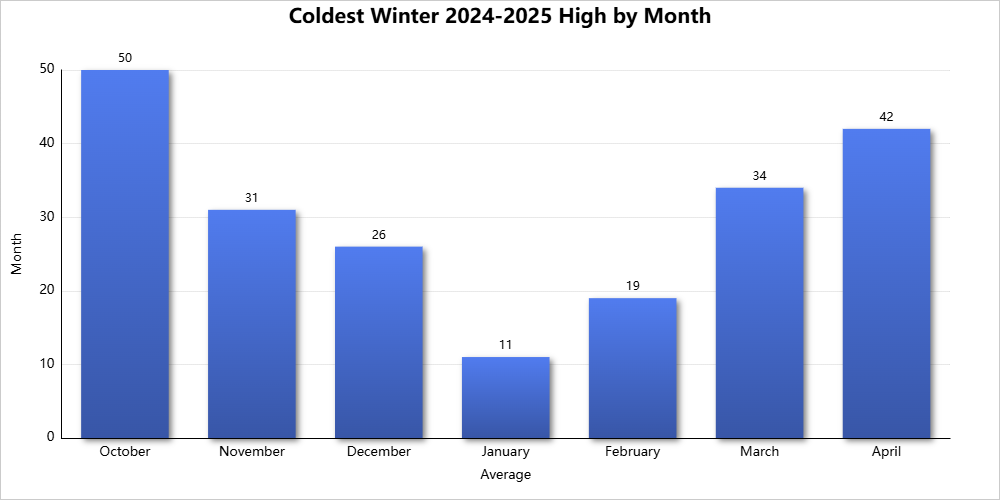
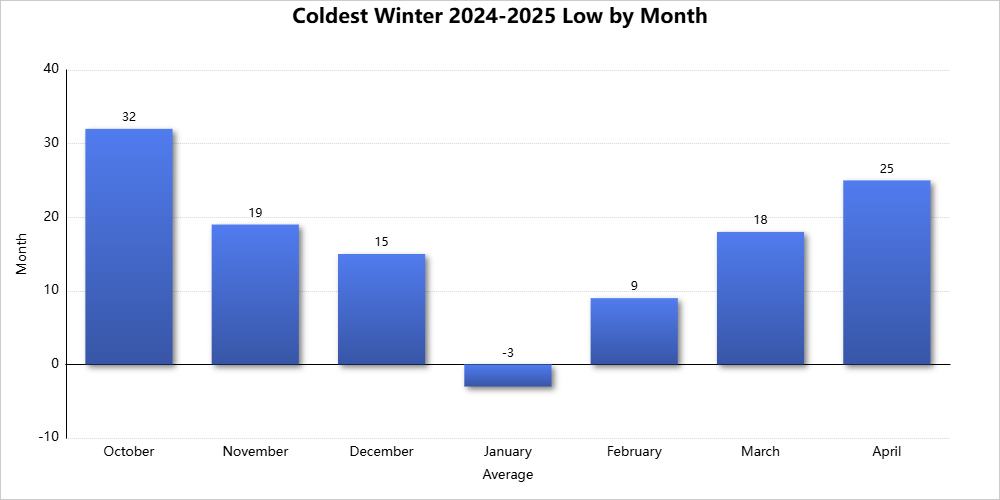
December-February Traditional winter numbers, 1991-2020 departures from normal where relevant, and overall winter rankings. Rankings are accurate as of the time of the post. Average High: 38.1 (-1.7) 44th Coldest Average Low: 23.6 (-0.9) 45th Coldest Mean: 30.8 (-1.4) Tied for 39th Coldest Coldest High: 11 on January 20th Coldest Low: -3 on January 22nd Coldest Mean: 5.5 on January 21st # of 32 or Below Highs: 29 (+3.2) 21st Most # of 32 or Below Lows: 72 (+3.2) 17th Most Warmest High: 65 on February 3rd Warmest Low: 51 on December 28th Warmest Mean: 57 on December 28th Precipitation: 8.11″ (-0.43″) 59th Wettest Snowfall: 14.6″ (-13.6″) 46th Least Snowy Average Daily Snow Depth: 0.6″ (-0.2″) Tied for 7th Lowest Maximum Snow Depth: 5″ on January 6th and 11th. Largest Snowstorm: 4.4″ on January 5th-6th. 1″+ Snowfall Events: 7 Tied for 8th Fewest # of Measurable Precipitation Days: 37 (-2.1) Tied for 13th Fewest # of Measurable Snowfall Days: 15 (-6.4) Tied for 11th Fewest Highest Average Daily Wind Speed in MPH: 19.2 on December 5th Highest Wind Gust in MPH: 55 on December 5th # of Clear Days: 4 4.44% # of Partly Cloudy Days: 39 43.33% # of Cloudy Days: 47 52.23%
Entire Cold Season: October-April Average High: 52.7 9th Warmest Average Low: 34.1 18th Warmest Mean: 43.4 9th Warmest Precipitation: 18.66″ 56th Wettest Snowfall: 14.8″ 29th Least Snowy Average Snow Depth: 0.3″ Tied for 4th Lowest Largest Snowstorm: 4.4″ on January 5th-6th # of 32 or Below Highs: 30 Tied for 21st Fewest # of 32 or Below Lows: 96 Tied for 17th Fewest # of Measurable Precipitation Days: 74 Tied for 9th Fewest # of Measurable Snowfall Days: 17 Tied for 8th Fewest Highest Average Daily Wind Speed in MPH: 19.2 on December 5th Highest Wind Gust in MPH: 59 on April 29th # of Clear Days: 34 16.04% # of Partly Cloudy Days: 90 42.45% # of Cloudy Days: 88 41.51%
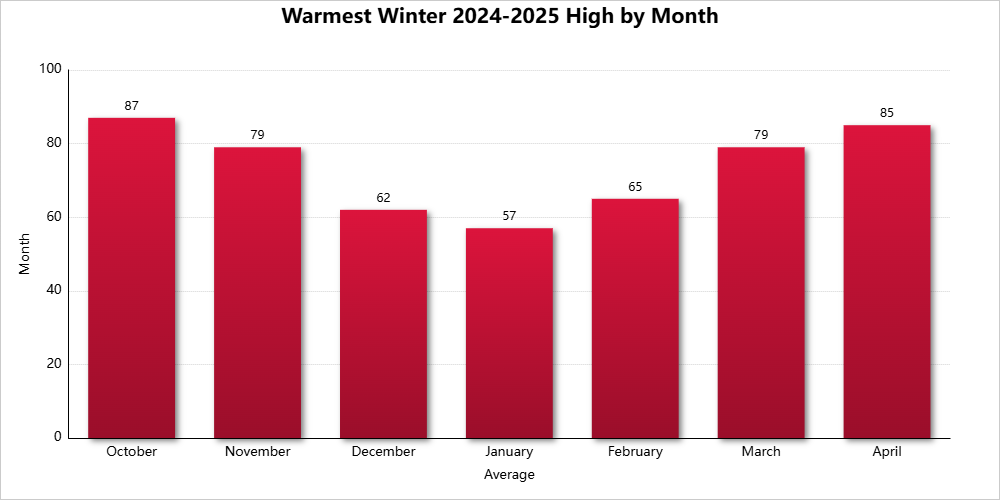
High Temperature Records Set 11/1/2024- A record warm high of 78 was set for the date, breaking the old record of 77 set in 2022. 11/5/2024- A record warm high of 79 was set for the date, breaking the old record of 77 set in 2022. 2/3/2025- A record warm high of 65 was set for the date, breaking the old record of 63 set in 1890. 3/14/2025- A record warm high of 79 was set for the date, breaking the old record of 78 set in 1990.
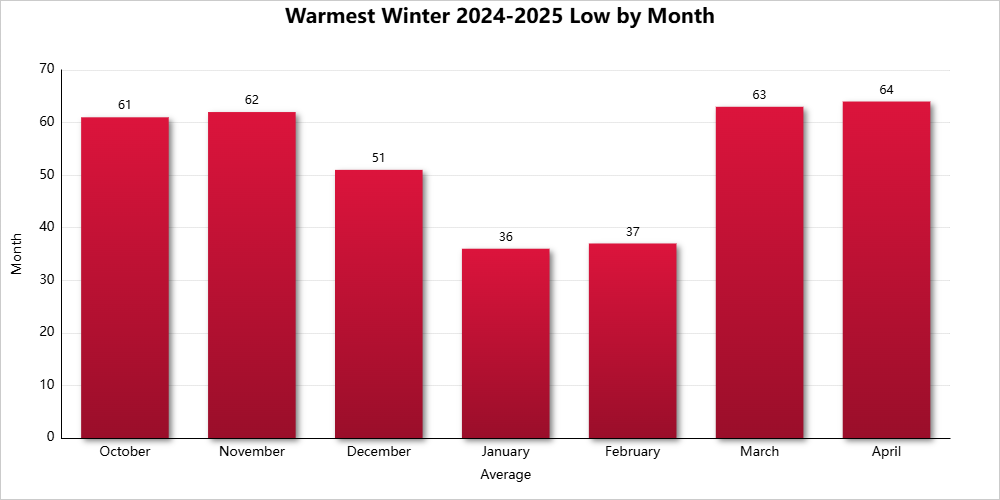
Low Temperature Records Set 10/30/2024- A record warm low of 59 degrees was tied for the date, matching the previous record set in 2004. 11/5/2024- A record warm low of 62 was tied for the date, matching the old record set in 2022. 3/29/2025- A record warm low of 63 was set for the date, breaking the old record of 59 set in 1977.
Precipitation Records Set None set.
Snowfall Records Set 10/15/2024- A record 0.1″ of snowfall occurred for the date. It was the first recorded instance of measurable snowfall for the date.
Forecast for what would be Columbus’ largest snowfall of the season.
Highest Daily Precipitation by Month October 2024: 0.12″ on the 15th November 2024: 0.97″ on the 14th December 2024: 1.03″ on the 29th January 2025: 0.24″ on the 18th February 2025: 1.15″ on the 16th March 2025: 0.65″ on the 30th April 2025: 1.88″ on the 3rd
Highest Daily Snowfall By Month October 2024: 0.1″ on the 15th November 2024: 0.1″ on the 21st December 2024: 0.3″ on the 11th January 2025: 2.4″ on the 6th February 2025: 1.9″ on the 16th March 2025: Trace on multiple days. April 2025: Trace on the 6th and 7th
Deepest Snow Depth By Month October 2024: 0″ on all days. November 2024: Trace on the 29th December 2024: Trace on the 12th and 13th January 2025: 5″ on the 6th and 11th February 2025: 2″ on the 17th and 18th March 2025: Trace on the 17th April 2025: 0″ on all days.
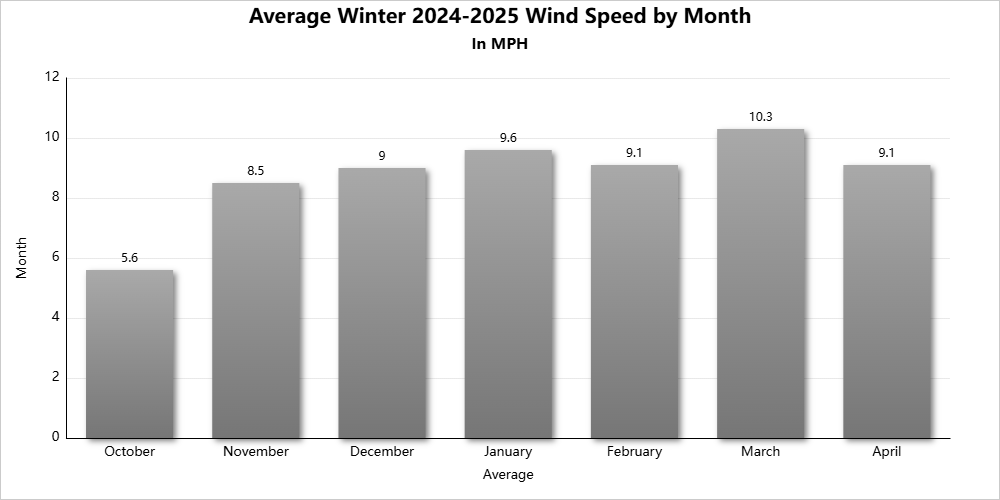
Highest Wind Gust by Month in MPH October 2024: 46 on the 13th November 2024: 43 on the 20th December 2024: 55 on the 5th January 2025: 38 on the 16th February 2025: 43 on the 28th March 2025: 53 on the 30th April 2025: 59 on the 29th
Clear Days by Month October 2024: 18 58.06% November 2024: 3 10.0% December 2024: 0 0.0% January 2025: 3 9.68% February 2025: 1 3.57% March 2025: 4 12.9% April 2025: 5 16.67%
Partly Cloudy Days by Month October 2024: 12 38.71% November 2024: 11 36.67% December 2024: 12 38.71% January 2025: 13 41.94% February 2025: 14 50.0% March 2025: 17 54.84% April 2025: 11 36.66%
Cloudy Days by Month October 2024: 1 3.23% November 2024: 16 53.33% December 2024: 19 61.29% January 2025: 15 48.39% February 2025: 13 46.43% March 2025: 10 32.26% April 2025: 14 46.67%
The earthquake of May, 1897 struck on the 31st at around 1PM. It had an epicenter near Pearisburg, Virginia, right on the West Virgina state line. The earthquake was estimated to have had a magnitude of 5.8-6.0, with a Modified Mercalli Scale (MMI) maximum rating of VIII. All of Ohio felt this earthquake, though southern and eastern sections felt it most strongly. Shaking strength was estimated to be in the MMI range of III-V across much of the state.
A MMI of V occurred at Cincinnati during the earthquake of May, 1897. A V is described as the following: Felt by all, frightens some. Pictures and lighting sway, a few objects fall from shelves or are overturned. A few instances of cracked plaster or windows. The Times-Star in Cincinnati made the following report the following day: Felt “here and in the suburbs…. The printers ran out of the Times-Star office. The occupants of other buildings were alarmed, and at Coney Island, Chester Park, the Zoo gardens, and elsewhere there was consternation among the holiday crowds. At the Lagoon, on the Kentucky side, there was a panic among several thousand people on the grounds. The waters in the Lagoon were so rough that the life-saving crew went to the relief of those out on the electric pleasure boats.”
Zanesville experienced an MMI of V. It was reported that the Courier Building, “experienced decided vibrations” to such an extent that “the employees on the fourth and third floors deserted their posts, greatly frightened.”
In other places, where the exact MMI is not known or estimated, there were reports of light damage and general panic.
In Pomeroy, it was reported to The Columbus Dispatch that, “This city was considerably shaken up by an earthquake at 1:30 yesterday. Buildings were badly shaken, dishes knocked from shelves and several persons on the streets were stunned, almost to insensibility.”
In Nelsonville, the Dispatch reported, “An earthquake shock was plainly discernible here at 1 o’clock yesterday. In one house, a lamp was shaken from the table. Many persons were frightenend.”
At Batavia, it was reported that, “Quite a perceptible earthquake shock was felt here yesterday, about 1 o’clock and lasing for a full minute’s duration. Windows rattled, and in a number of cases, dishes were thrown down and broken.”
In Jackson, the report was that, “At the county infirmary, situated about two miles east of this city, the earthquake shock on Monday was very violent. The terrified inmates ran screaming from the buildings. Upon examination it was found that the shock had cracked the walls in many places. Window panes were also broken.”
In Columbus, the earthquake likely registered at a III at most. Many people did not feel it at all. The Dispatch reported that a “Mr. King, in his room in the Neil House, detected the earthquake the instant of its occurrence, took note of the time, reported the facts at the office, and was laughed at good naturedly by the clerks, but when The Evening Dispatch brought his vindication they cheerfully admitted that Mr. King knew an earthquake when he felt it.”
Near the epicenter in Western Virginia, the quake damaged many buildings, felled many chimneys, and even a train was derailed due to area landslides.
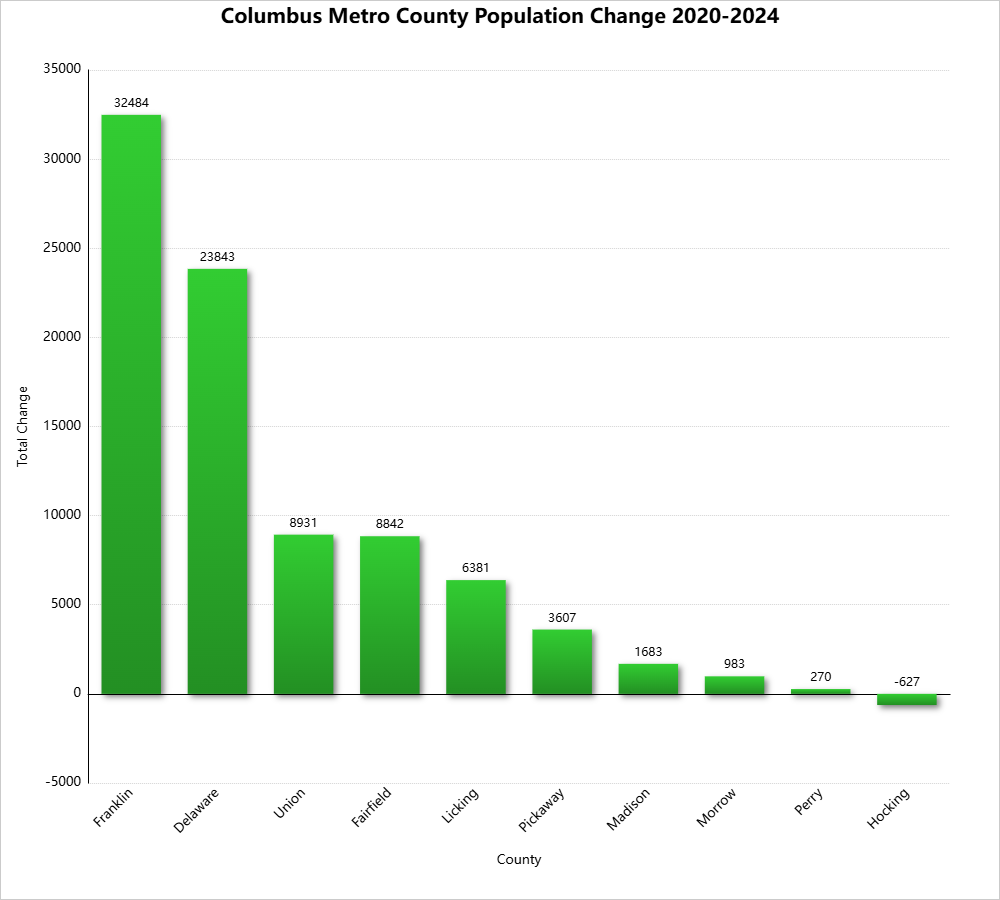
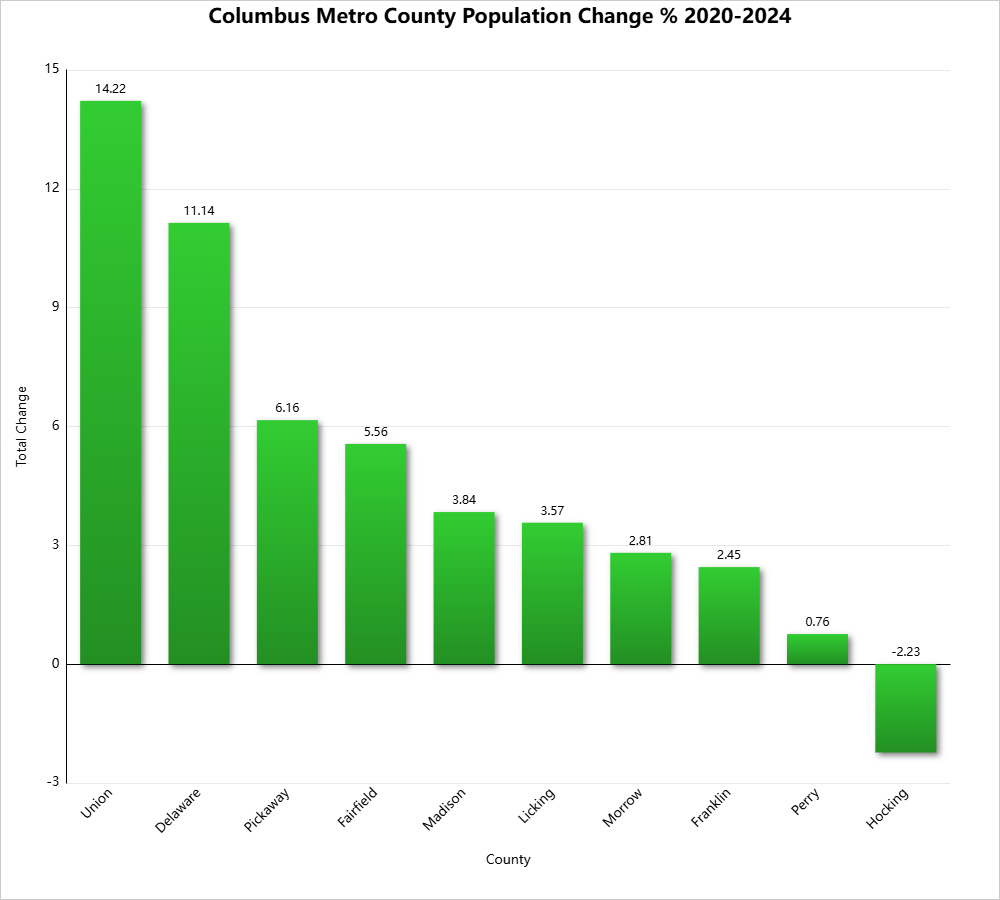
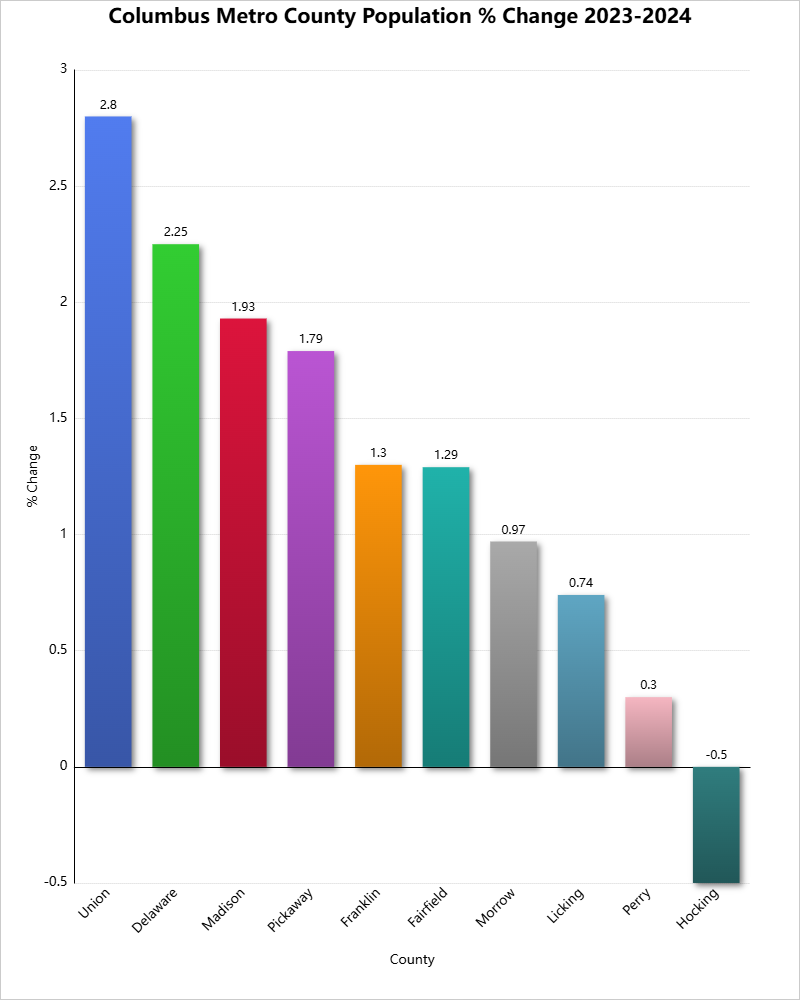
The US Census has released 2024 county and metro population estimates. The estimates generally show a further continuation of the post-pandemic recovery in the numbers. In fact, older estimates have also been revised upwards. Let’s break down the numbers.
Metro County
2020 Census
2023 Population
2024 Population
Delaware
214,123
232,732
237,966
Fairfield
158,920
165,630
167,762
Franklin
1,323,819
1,338,903
1,356,303
Hocking
28,056
27,567
27,429
Licking
178,517
183,540
184,898
Madison
43,848
44,668
45,531
Morrow
34,944
35,583
35,927
Perry
35,412
35,577
35,682
Pickaway
58,551
61,064
62,158
Union
62,790
69,765
71,721
As you can see, all counties but Hocking grew in both the 2020-2024 and 2023-2024 periods. Most of the estimates were improvements over the 2023 version, as mentioned. For example, Franklin County’s estimates population in 2023 was 1,326,063, but the 2024 version for 2023 was revised to 1,338,903, indicating growth was significantly stronger than originally estimated.
Franklin County continued its very long run of being the top county in the metro for total growth.