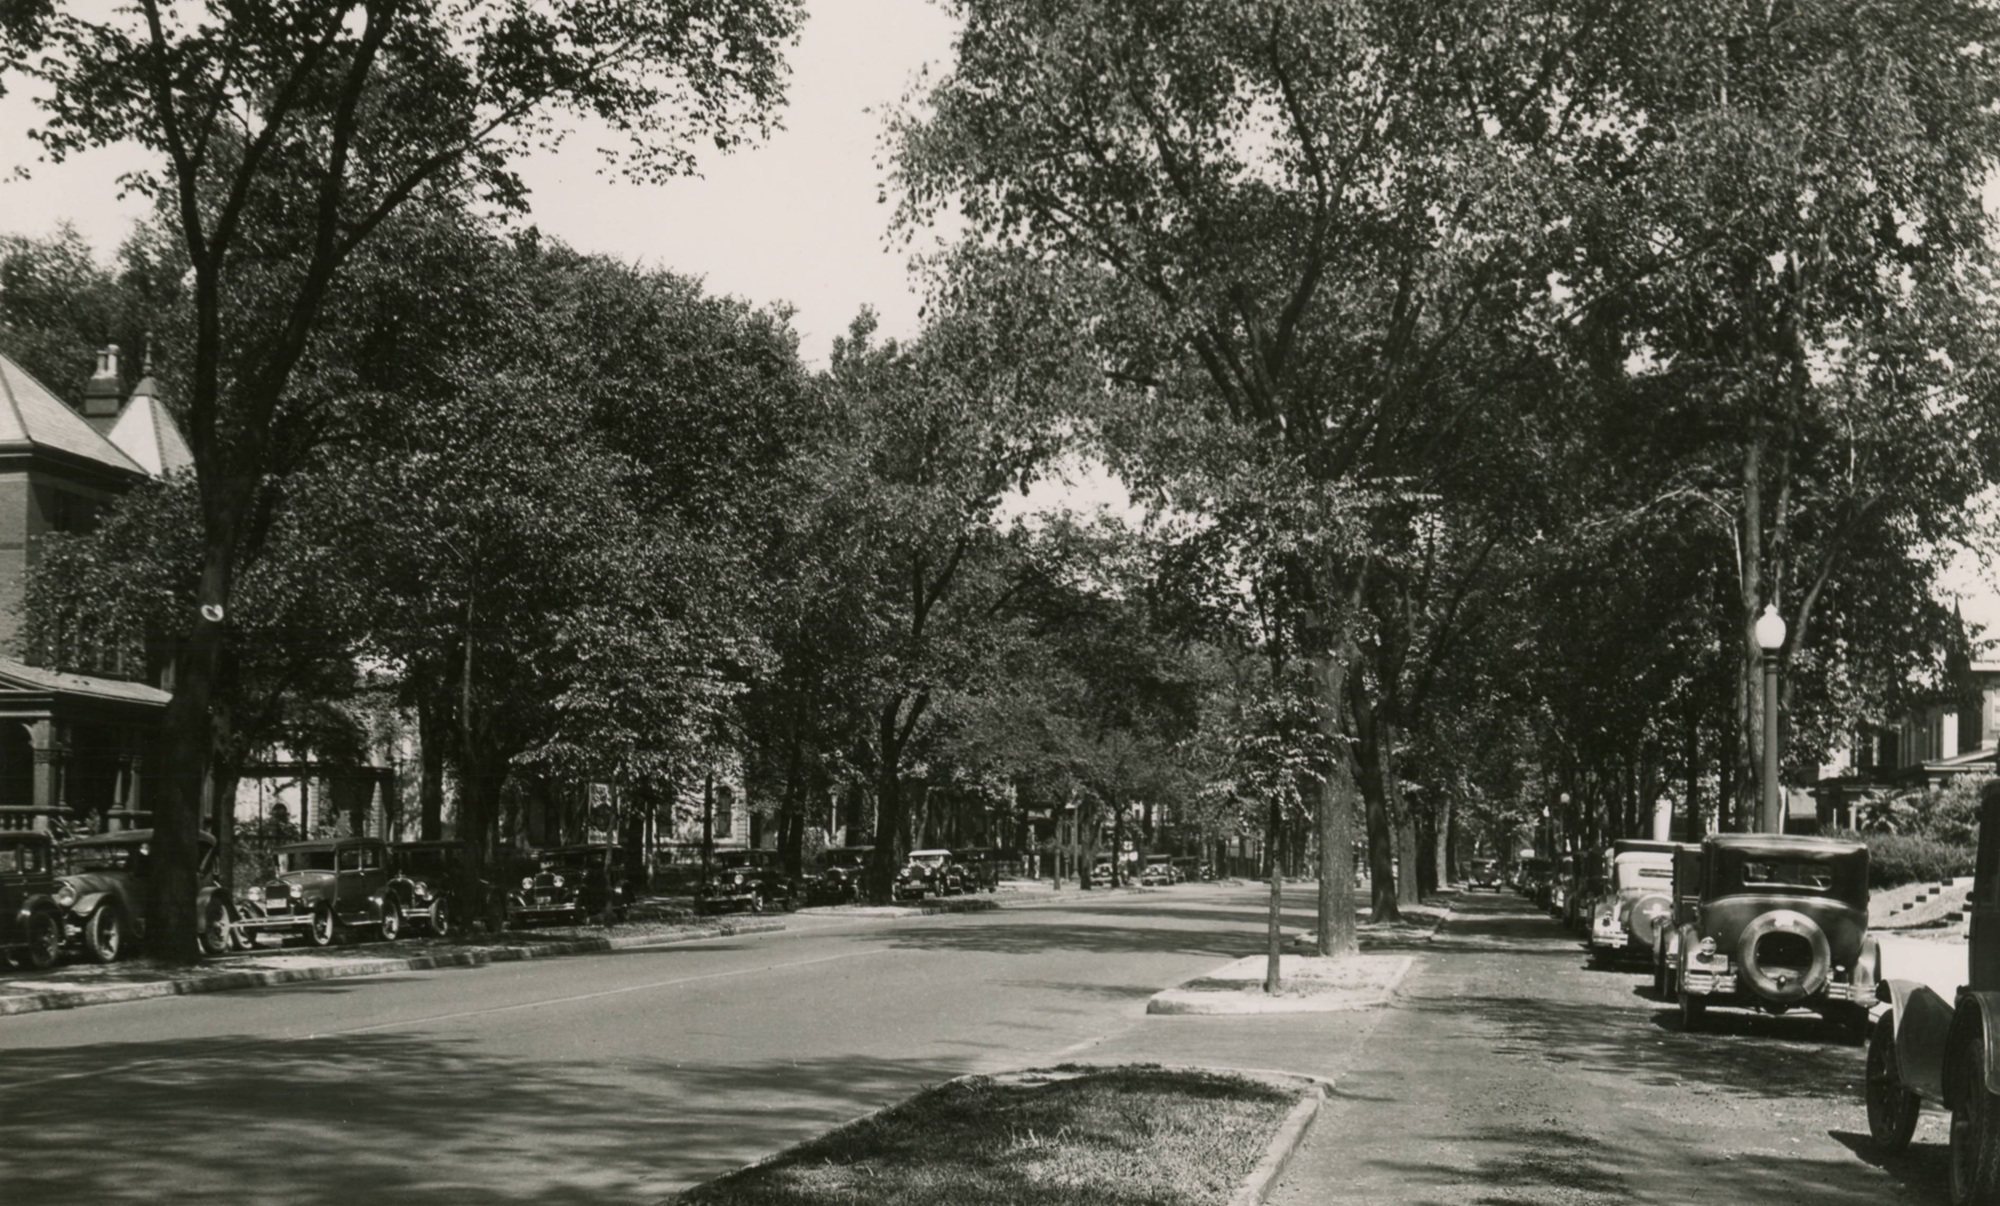
Winter 2025-2026 Review

Winter 2025-2026 Review January snowstorm

The new Winter 2025-2026 Review reveals that the winter was the first snowier than normal winter since 2017-2018. It also featured the first 6″+ snow event since the winter of 2014-2015, with one of the biggest snowstorms of all-time on January 25th. It also featured generally below-normal temperatures for the core of the winter, followed by a very warm spring.

Temperatures

Average High Temperature
October: 67.7
November: 51.6
December: 39.8
January: 32.7
February: 40.5
March: 60.4
April: 71.6

Cold Season Average High: 52.1
Cold Seasond Average High Departure: +1.8
Winter Season Average High: 37.6
Winter Season Average High Departure: -2.3

Mean High Departure from Normal
October: +2.2
November: -0.7
December: -1.7
January: -4.4
February: -0.3
March: +9.3
April: +7.5

Average Low Temperature
October: 46.8
November: 34.1
December: 23.8
January: 15.7
February: 22.4
March: 38.5
April: 48.4

Cold Season Average Low: 32.9
Cold Season Average Low Departure: +0.4
Winter Season Average Low: 20.6
Winter Season Average Low Departure: -4.0

Mean Low Departure from Normal
October: +2.0
November: -0.9
December: -3.8
January: -6.3
February: -0.4
March: +6.5
April: +6.2

Mean Temperature
October: 57.3
November: 42.9
December: 31.8
January: 24.2
February: 31.5
March: 49.5
April: 60.0

Cold Season Average Mean: 42.5
Cold Season Average Mean Departure: +1.0
Winter Season Average Mean: 29.1
Winter Season Average Mean Departure: -3.1

Mean Departure from Normal
October: +2.1
November: -0.7
December: -2.7
January: -5.4
February: -1.0
March: +7.9
April: +6.8

Coldest High Temperature
October: 51 on the 22nd and 30th
November: 33 on the 10th
December: 18 on the 14th
January: 12 on the 28th
February: 19 on the 5th
March: 27 on the 17th
April: 46 on the 7th

Coldest Low Temperature
October: 34 on the 24th and 25th
November: 19 on the 29th
December: 1 on the 15th
January: -9 on the 31st
February: 0 on the 2nd
March: 20 on the 17th and 18th
April: 29 on the 8th

Coldest Mean Temperature
October: 46 on the 24th and 30th
November: 28.5 on the 10th and 29th
December: 10 on the 15th
January: 2 on the 28th
February: 10.5 on the 5th
March: 23.5 on the 17th
April: 38.5 on the 7th

Warmest High Temperature
October: 85 on the 4th
November: 67 on the 5th
December: 68 on the 28th
January: 65 on the 9th
February: 65 on the 18th
March: 86 on the 22nd
April: 84 on the 14th and 15th

Warmest Low Temperature
October: 59 on the 7th
November: 49 on the 15th
December: 40 on the 28th
January: 39 on the 9th
February: 48 on the 18th
March: 62 on the 31st
April: 67 on the 3rd and 13th

Warmest Mean Temperature
October: 70.5 on the 3rd and 4th
November: 57.5 on the 15th
December: 54 on the 28th
January: 52 on the 9th
February: 56.5 on the 18th
March: 70.5 on the 31st
April: 74.5 on the 15th

Temperature Records
October
None
November
None
December
A record daily high was tied on the 28th. The high of 68 degrees tied the previous record set in 1984.
January
A record daily high was set on the 9th. The high of 65 degrees broke the old record of 62 set in 1946 and 1949.
A record daily low was set on the 31st. The low of -9 degrees broke the old record of -6 set in 2004.
The period of January 24-January 31st featured 8 consecutive highs below 20 degrees. This ties the record for the longest such consecutive streak, matching similar records set 1/10-1/17/1893 and 2/6-2/13/1899.
February
None
March
A daily record warm low was set on the 7th. The low of 59 degrees broke the old record of 56 set in 1974.
A daily record warm low was set on the 10th. The low of 56 degrees broke the old record of 53 set in 1879.
A daily record high was set on the 22nd. The high of 86 degrees broke the old record of 85 set in 2012. This also broke the record for the warmest temperature ever recorded in March.
A daily record warm low was set on the 31st. Thg low of 62 degrees broke the old record of 61 set in 1998.
April
A daily record warm low was set on the 3rd. The low of 67 degrees broke the old record of 58 set in both 1892 and 1963.
A daily record warm low was set on the 13th. The low of 67 degrees broke the old record of 63 set in 2018.
A daily record warm low was set on the 14th. The low of 63 degrees broke the old record of 61 set in 1941.
A daily record high was tied on the 15th. The high of 84 degrees tied the old record of 84 set in 2010.
A daily record warm low was set on the 15th. The low of 65 degrees broke the old record of 62 set in both 1912 and 1941.

Precipitation

Total Precipitation Days
October: 7
November: 16
December: 19
January: 21
February: 14
March: 18
April: 19

Monthly Precipitation Total
October: 3.88″
November: 2.32″
December: 2.50″
January: 1.63″
February: 2.27″
March: 5.62″
April: 3.09″

Cold Season Total: 21.31″
Winter Season Total: 6.40″

Monthly Precipitation Departure from Normal
October: +0.98″
November: -0.57″
December: -0.63″
January: -1.37″
February: -0.14″
March: +2.00″
April: -0.76″

Cold Season Departure from Normal: -0.49″
Winter Season Departure from Normal: -2.14″

Greatest Precipitation
October: 1.84″ on the 7th
November: 0.70″ on the 25th
December: 0.60″ on the 18th
January: 1.09″ on the 25th
February: 1.14″ on the 19th
March: 1.03″ on the 27th
April: 0.80″ on the 22nd

Monthly Snowfall
October: 0″
November: 1.8″
December: 12.2″
January: 13.1″
February: 3.2″
March: 3.6″
April: 0″

Cold Season Total: 33.9″
Winter Season Total: 28.5″

Monthly Snowfall Departure from Normal
October: -0.2″
November: +0.6″
December: +7.1″
January: +3.6″
February: -4.4″
March: -0.5″
April: -0.5″

Cold Season Snowfall Departure: +5.7″
Winter Season Departure from Normal: +6.3″

Greatest Snowfall
October: 0″
November: 1.3″ on the 10th
December: 5.4″ on the 13th
January: 11.9″ on the 25th
February: 1.5″ on the 6th
March: 3.0″ on the 2nd
April: 0″ on All Days

Precipitation Records
October
10/7/2025: Record daily precipitation of 1.84″, breaking the old record of 1.61″ set in 1998.
November
None
December
12/2/2025: Record daily snowfall of 4.7″, breaking the old record of 3.0″ set in 1936.
12/13/2025: Record daily snowfall of 5.4″, breaking the old record of 3.6″ set in 1945.
January
1/25/2026: Record daily snowfall of 11.9″, breaking the old record of 4.7″ set in 1988.
1/25/2026: Record daily precipitation of 1.09″, breaking the old record of 0.68″ set in 1952.
February
None
March
None
April
None

Largest Measurable Snowfalls by Date
1. 1/25/2026: 11.9″
2. 12/13/2025: 5.4″
3. 12/2/2025: 4.7″
4. 3/2/2026: 3.0″
5. 12/31/2025: 1.6″
6. 2/6/2026: 1.5″
7. 11/10/2025: 1.3″
8. 2/22/2026: 0.9″
9. 2/23/2026: 0.7″
10. 11/9/2025, 12/30/2025: 0.5″
11. 3/17/2026: 0.4″
12. 1/15/2026: 0.3″
13. 1/19/2026, 1/22/2026, 1/26/2026, 3/16/2026: 0.2″
14. 1/1/2026, 1/17/2026, 1/24/2026, 2/25/2026: 0.1″

December 2, 2025 Event

December 13, 2025 Event

January 25, 2026 Event

January 2026 Snowstorm

Total Snow Days
October: 0
November: 9
December: 12
January: 16
February: 10
March: 6
April: 0

Deepest Snow Depth
October: 0
November: 1″ on the 10th
December: 5″ on the 2nd and 14th
January: 12″ on the 26th
February: 8″ on the 1st, 2nd and 3rd
March: 2″ on the 2nd
April: 0″ on All Days

Days with Snow Depth of 1″+
October: 0
November: 1
December: 11
January: 9
February: 14
March: 1
April: 0

Average Daily Snow Depth by Month
October: 0
November: Trace
December: 1.1″
January: 2.3″
Feburary: 2.5″
March: 0.1″
April: 0″

Average Daily Wind Speed in MPH
October: 6.8
November: 8.2
December: 9.2
January: 9.8
February: 7.6
March: 10.4
April: 9.9

Highest Wind Gust in MPH
October: 42 on the 21st
November: 43 on the 5th and 26th
December: 51 on the 29th
January: 49 on the 19th
February: 60 on the 20th
March: 69 on the 22nd
April: 54 on the 14th

Clear Days by Month
October: 10
November: 4
December: 1
January: 2
February: 2
March: 2
April: 2

Partly Cloudy Days by Month
October: 16
November: 15
December: 12
January: 10
February: 18
March: 14
April: 19

Cloudy Days by Month
October: 5
November: 11
December: 18
January: 19
February: 8
March: 15
April: 9

2025 Ohio City Population Estimates

2025 Ohio city population estimates

The US Census has released 2025 city population estimates. Let’s look at at how both national and Ohio cities have changed.

Keep in mind, as always, that these are just estimates and are subject to much wider swings and errors compared to decennial census data.

First up, here is Ohio’s data.

Top 30 Largest Ohio Cities on July 1, 2025
1. Columbus: 938,396
2. Cleveland: 363,608
3. Cincinnati: 314,367
4. Toledo: 263,423
5. Akron: 189,691
6. Dayton: 136,688
7. Parma: 78,581
8. Canton: 69,001
9. Lorain: 65,366
10. Hamilton: 64,644
11. Youngstown: 58,832
12. Springfield: 58,281
13. Kettering: 57,396
14. Elyria: 53,634
15. Middletown: 52,146
16. Newark: 51,473
17. Cuyahoga Falls: 50,975
18. Dublin: 49,094
19. Lakewood: 49,027
20. Beavercreek: 48,134
21. Euclid: 47,962
22. Mansfield: 47,381
23. Mentor: 47,010
24. Delaware: 46,636
25. Strongsville: 45,629
26. Grove City: 45,180
27. Fairfield: 44,682
28. Huber Heights: 43,905
29. Cleveland Heights: 43,750
30. Reynoldsburg: 43,350

Top 15 Largest Increases July 1, 2024 to July 1, 2025
1. Columbus: +7,696
2. Grove City: +1,294
3. Delaware: +1,177
4. Powell: +1,083
5. West Jefferson: +925
6. Fairborn: +757
7. Marysville: +720
8. Reynoldsburg: +577
9. Hamilton: +506
10. Sunbury: +495
11. Bowling Green: +482
12. Gahanna: +481
13. Pickerington: +470
14. Dayton: +464
15. Xenia: +420

Top 15 Largest Decreases July 1, 2024 to July 1, 2025
1. Toledo: -962
2. Cincinnati: -488
3. Springfield: -334
4. Bexley: -320
5. Sidney: -297
6. Warren: -245
7. Parma: -220
8. Lakewood: -218
9. Westerville: -206
10. Mansfield: -200
11. Portsmouth: -171
12. Upper Arlington: -166
13. Dublin: -165
14. Sandusky: -165
15. Ada: -158

It is highly unlikely that any of the Columbus suburbs listed as losing population actually did, especially when all of them were seeing decent growth over the previous decade. It would make little sense that Columbus is growing strongly, but it’s inner suburbs, especially ones with high quality of housing and conditions, would be losing population. We’ll have to wait several more years to get a thorough count, though.

Total Change for All Columbus Metro Area Places Census 2020-July 1, 2025
1. Columbus: 938,396 +32,181
2. Newark: 51,473 +1,512
3. Dublin: 49,094 -218
4. Delaware: 46,636 +5,339
5. Grove City: 45,180 +3,924
6. Reynoldsburg: 43,350 +2,276
7. Lancaster: 41,956 +1,413
8. Hilliard: 38,898 +1,738
9. Westerville: 38,165 -1,024
10. Gahanna: 35,986 +259
11. Upper Arlington: 35,893 -886
12. Marysville: 30,190 +4,573
13. Pickerington: 26,333 +3,263
14. Whitehall: 19,805 -323
15. Pataskala: 18,529 +647
16. Powell: 18,269 +4,012
17. Circleville: 14,634 +709
18. Worthington: 14,543 -236
19. Bexley: 12,452 -1,473
20. New Albany: 11,803 +641
21. Heath: 10,859 +408
22. London: 10,813 +546
23. Canal Winchester: 10,058 +936
24. Grandview Heights: 9,112 +1,025
25. Sunbury: 8,857 +2,259
26. Obetz: 7,342 +1,860
27. Logan: 7,164 -138
28. Granville: 6,252 +302
29. West Jefferson: 5,827 +1,684
30. Groveport: 5,818 -190
31. Johnstown: 5,476 +266
32. Ashville: 4,819 +287
33. New Lexington: 4,465 +40
34. Plain City: 4,322 +209
35. South Bloomfield: 4,164 +2,019
36. Commercial Point: 3,271 +183
37. Baltimore: 3,110 +74
38. Lithopolis: 2,969 +818
39. Richwood: 2,640 +421
40. Buckeye Lake: 2,590 +67
41. Hebron: 2,405 +82
42. Crooksville: 2,404 -17
43. Cardington: 2,247 +165
44. Utica: 2,138 +71
45. Mount Sterling: 2,051 +108
46. Minerva Park: 1,950 -62
47. Roseville: 1,751 +3
48. Somerset: 1,482 +1
49. Hanover: 1,397 +129
50. Ashley: 1,343 +143
51. Ostrander: 1,219 +125
52. Thornville: 1,111 +11
53. Williamsport: 1,027 +54
54. Galena: 1,019 +92
55. Millersport: 1,008 +31
56. Urbancrest: 1,003 -32
57. Pleasantville: 964 +22
58. Milford Center: 959 +153
59. Shawnee Hills: 931 +94
60. New Holland: 833 +36
61. Junction City: 722 +1
62. Amanda: 680 +15
63. Marble Cliff: 658 +20
64. New Straitsville: 647 -6
65. Valleyview: 640 -19
66. Thurston: 616 +9
67. Stoutsville: 582 +4
68. Riverlea: 578 -19
69. Buchtel: 508 -8
70. Carroll: 504 +3
71. Shawnee: 504 -1
72. Laurelville: 503 -17
73. Alexandria: 501 +15
74. Kirkersville: 486 +15
75. Corning: 485 -4
76. Edison: 449 +28
77. Hartford: 413 +4
78. Sugar Grove: 413 +4
79. St. Louisville: 359 +15
80. Murray City: 343 -9
81. South Solon: 327 +0
82. Magnetic Springs: 316 +50
83. Harrisburg: 313 -1
84. Rushville: 307 +2
85. Marengo: 285 +5
86. Midway: 270 +0
87. Tarlton: 269 +15
89. Fulton: 254 +7
90. Unionville Center: 235 -13
91. Lockbourne: 228 -9
92. Gratiot: 217 +3
93. Chesterville: 208 +11
94. Darbyville: 189 +4
95. Glenford: 170 -2
96. West Rushville: 165 +0
97. Hemlock: 148 +0
98. Sparta: 127 +2
99. Brice: 110 +16

There used to be 101 places, but 2- Orient and Rendville- have lost incorporated status since 2020.
What is interesting about the estimates is that many very small villages and towns are estimated to have seen relatively strong growth while some major suburbs shows significant declines. Again, that is unlikely, as there would be little logical reason for rural places with few jobs or infrastructure to be seeing steady growth. What is most likely occurring is that the Ohio population change total for the period is being distributed in a way that favors smaller, rural places regardless of their condition or long-term population trends.

2025 Ohio city population estimates population change by size


The East Broad Street Boulevard

This collection of photos from the 1920s show the East Broad Street Boulevard. Modeled after European cities like Paris, the boulevard featured tree-lined medians that separated parked vehicles and a slower drive lane from the main traffic lanes. The boulevard, also known as the Broad Street Parkway, was in place for many years until it was ultimately removed beginning in 1932. The decision to remove the medians was to widen Broad to facilitate more car traffic.

East Broad Street Boulevard

East Broad Street Boulevard

East Broad Street Boulevard

East Broad Street Boulevard

2025 County and Metro Population Estimates

2025 county and metro population estimates

2025 county and metro area population estimates have been released by the US Census. These numbers are for the change between July, 2024 and July, 2025.

Top 25 Ohio Counties by Population on July 1, 2025
1. Franklin: 1,361,536
2. Cuyahoga: 1,232,925
3. Hamilton: 838,418
4. Montgomery: 539,598
5. Summit: 538,376
6. Lucas: 423,347
7. Butler: 400,128
8. Stark: 373,771
9. Lorain: 323,219
10. Warren: 257,181
11. Delaware: 242,032
12. Lake: 232,217
13. Mahoning: 224,706
14. Clermont: 216,977
15. Trumbull: 198,972
16. Licking: 185,564
17. Medina: 185,025
18. Greene: 174,322
19. Fairfield: 169,752
20. Portage: 163,404
21. Clark: 135,340
22. Wood: 134,176
23. Richland: 124,893
24. Wayne: 116,758
25. Miami: 112,634

Top 25 Ohio Counties with the Largest Population Increase July 1, 2024 to July 1, 2025
1. Franklin: +8,880
2. Delaware: +5,169
3. Montgomery: +2,668
4. Clermont: +2,663
5. Butler: +2,347
6. Greene: +2,174
7. Warren: +2,142
8. Lorain: +2,060
9. Fairfield: +2,046
10. Union: +1,463
11. Summit: +1,431
12. Licking: +1,224
13. Madison: +1,197
14. Wood: +1,104
15. Pickaway: +771
16. Miami: +762
17. Medina: +750
18. Muskingum: +693
19. Hamilton: +559
20. Stark: +531
21. Knox: +438
22. Ross: +431
23. Geauga: +376
24. Crawford: +356
25. Morrow: +297

Ohio Metro Area Population on July 1, 2025
1. Cincinnati: 2,312,858
2. Columbus: 2,242,028
3. Cleveland: 2,165,775
4. Dayton: 826,554
5. Akron: 701,780
6. Toledo: 599,376
7. Youngstown: 423,678
8. Canton: 400,246

Metro Area Population Change July 1, 2024 to July 1, 2025
1. Columbus: +21,312
2. Cincinnati: +13,107
3. Dayton: +5,604
4. Cleveland: +2,539
5. Akron: +1,628
6. Canton: +439
7. Toledo: -26
8. Youngstown: -913

Metro Population Components of Change

Total Natural Growth (Births vs Deaths) July 1, 2024 to July 1, 2025
1. Columbus: +7,453
2. Cincinnati: +4,322
3. Toledo: -101
4. Dayton: -243
5. Canton: -735
6. Akron: -1,301
7. Youngstown: -1,893
8. Cleveland: -2,431

Total Domestic Migration July 1, 2024 to July 1, 2025
1. Dayton: +4,272
2. Columbus: +2,921
3. Cincinnati: +1,836
4. Akron: +1,155
5. Canton: +992
6. Youngstown: +676
7. Cleveland: -178
8. Toledo: -693

Total International Migration July 1, 2024 to July 1, 2025
1. Columbus: +10,968
2. Cincinnati: +6,900
3. Cleveland: +5,082
4. Akron: +1,735
5. Dayton: +1,566
6. Toledo: +755
7. Youngstown: +295
8. Canton: +175

2024 City Population Estimates

2024 city population estimates

The US Census has released 2024 city population estimates. These estimates are for all incorporated places.

First, let’s look at the top 25 largest Ohio cities on July 1, 2024.
Purple cities moved up in the ranking since 2020 and red moved down.

Rank

City

2020

2023

2024

1

Columbus

905,939

920,569

933,263

2

Cleveland

372,626

364,276

365,379

3

Cincinnati

309,561

312,703

314,915

4

Toledo

270,877

265,798

265,638

5

Akron

190,408

189,142

189,664

6

Dayton

137,677

135,936

136,346

7

Parma

81,121

79,310

79,,350

8

Canton

70,743

69,230

69,211

9

Lorain

65,218

65,413

65,751

10

Hamilton

63,393

63,516

63,953

11

Youngstown

60,047

59,195

59,123

12

Springfield

58,644

58,041

58,138

13

Kettering

57,860

57,035

57,028

14

Elyria

52,668

53,181

53,604

15

Middletown

50,986

51,882

52,291

16

Newark

49,970

51,162

51,424

17

Cuyahoga Falls

51,116

50,865

50,979

18

Lakewood

50,940

49,564

49,517

19

Dublin

49,315

49,292

49,456

20

Euclid

49,689

48,439

48,421

21

Beavercreek

46,562

47,327

48,012

22

Mansfield

47,530

47,676

47,593

23

Mentor

47,442

47,000

47,113

24

Delaware

41,327

45,364

46,521

25

Strongsville

46,487

45,719

45,768

Columbus gained 12,694 residents July 1, 2023 to July 1, 2024. This was the 14th highest numeric change of all US cities at or above 20,000 in population. In doing so, it became Ohio’s all-time largest city by population in history, surpassing Cleveland’s historic high of 914,80 in 1950.

Now let’s look at all incorporated places within the Columbus Metro Area, their rank on July 1, 2024, and their total population change July 1, 2023 to July 1, 2024.
Blue places moved up in the rankings since 2020, while red moved down.
1. Columbus: 933,263 +12,694
2. Newark: 51,424 +262
3. Dublin: 49,456 +164
4. Delaware: 46,521 +1,157
5. Grove City: 44,019 +875
6. Reynoldsburg: 42,897 +1,386
7. Lancaster: 41,671 +191
8. Hilliard: 38,832 +1,202
9. Westerville: 38,612 +119
10. Upper Arlington: 36,140 +96
11. Gahanna: 35,544 +86
12. Marysville: 29,276 +821
13. Pickerington: 25,814 +546
14. Whitehall: 19,940 +41
15. Pataskala: 18,493 +113
16. Worthington: 14,649 +31
17. Powell: 14,613 +50
18. Circleville: 14,433 +210
19. Bexley: 12,793 -97
20. New Albany: 11,604 +179
21. Heath: 10,822 +70
22. London: 10,743 +193
23. Canal Winchester: 10,060 +213
24. Sunbury: +1,324
25. Grandview Heights: 9,184 +275
26. Obetz: 7,306 +287
27. Logan: 7,142 -33
28. Granville: 6,308 +23
29. Groveport: 5,867 +11
30. Johnstown: 5,356 +31
31. West Jefferson: 4,943 +454
32. Ashville: 4,758 +77
33. New Lexington: 4,463 +7
34. Plain City: 4,374 +23
35. South Bloomfield: 3,747 +241
36. Mount Gilead: 3,543 +18
37. Commercial Point: 3,221 +51
38. Baltimore: 3,089 +35
39. Lithopolis: 2,859 +143
40. Buckeye Lake: 2,575 +12
41. Richwood: 2,575 +78
42. Hebron: 2,406 +15
43. Crooksville: 2,401 -1
44. Cardington: 2,203 +102
45. Utica: 2,131 +12
46. Mount Sterling: 2,070 +35
47. Minerva Park: 1,961 +3
48. Roseville: 1,744 +0
49. Bremen: 1,520 +9
50. Somerset: 1,483 +9
51. Hanover: 1,351 +35
52. Ashley: 1,350 +25
53. Ostrander: 1,227 +25
54. Thornville: 1,093 +2
55. Galena: 1,021 +9
56. Williamsport: 1,016 +17
57. Urbancrest: 1,013 +4
58. Millersport: 993 +15
59. Pleasantville: 954 +8
60. Shawnee Hills: 939 +18
61. Milford Center: 932 +26
62. New Holland: 831 +13
63. Junction City: 723 +3
64. Amanda: 678 +1
65. Marble Cliff: 663 +30
66. Valleyview: 653 -1
67. New Straitsville: 649 +1
68. Thurston: 610 +3
69. Riverlea: 580 -1
70. Stoutsville: 580 +3
71. Buchtel: 519 +3
72. Laurelville: 505 -5
73. Shawnee: 503 +1
74. Carroll: 501 +0
75. Alexandria: 497 +2
76. Corning: 484 +1
77. Kirkersville: 479 +2
78. Edison: 443 +2
79. Hartford: 413 +2
80. Sugar Grove: 408 +0
81. St. Louisville: 365 +1
82. Murray City: 335 -4
83. South Solon: 330 +2
84. Harrisburg: 314 +3
85. Rushville: 305 +1
86. Magnetic Springs: 302 +9
87. Marengo: 281 +1
88. Midway: 273 +2
89. Tarlton: 266 +5
90. Fulton: 251 +3
91. Unionville Center: 235 -3
92. Lockbourne: 232 +0
93. Gratiot: 217 +1
94. Chesterville: 200 +5
95. Darbyville: 189 +2
96. West Rushville: 164 -2
97. Glenford: 163 -2
98. Hemlock: 147 +0
99. Sparta: 123 +0
100. Brice: 101 +9

90% of Columbus metro places were either steady or saw outright growth 2023-2024. These numbers are much improved from the Covid era where many places were seeing population declines, especially the larger cities and suburbs.

Columbus’ growth represented 73% of Franklin County’s total growth 2023-2024 and 84.1% of the county’s growth 2020-2024. Additionally, Columbus alone repesented 41.8% of the metro’s growth 2023-2024 and 31.6% of the metro’s growth 2020-2024.

To see the original estimates from 2023, visit 2023 Population Estimates of Columbus Area Places