![]()
![]()
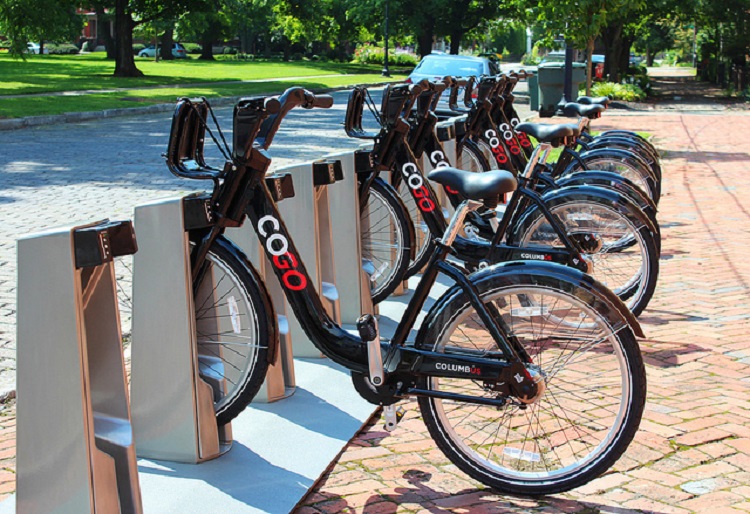
Columbus’ CoGo bike share system has been in operation since July, 2013. After a decade of ups and downs, the system seems to be finally hitting its stride.
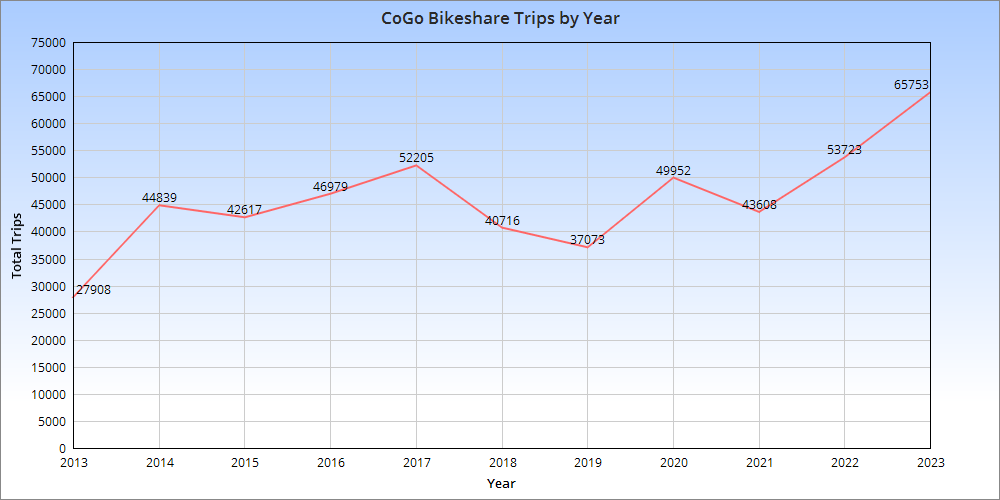
As the chart above shows, total CoGo trips were generally up between 2013-2017, and then saw a fairly steep decline 2018-2019. It’s unclear what caused that decline, but everything from system disruptions to weather could have played a role. Regardless, the pandemic, protests and general chaos of 2020 didn’t seem to matter as total trips for the year rebounded strongly. After another down year in 2021, 2022 saw CoGo’s highest ridership since the system opened, and 2023 continued that trend by blowing out 2022’s record. There were an extra 33 trips per day in 2023 vs. 2022, which added up to more than 12,000 more for the year.
Hopefully, the increase in ridership will prompt another expansion of the system into new areas soon. And some actual protected bike lanes would be nice, as Columbus- to date, anyway- has been less than stellar on this issue.