For the Columbus economy July 2022 report, we find several local industries in record high territory, but with a metro labor force that is barely growing. The data comes from the Bureau of Labor Statistics.
Overall Metro Area July 2022 and Change from July 2021
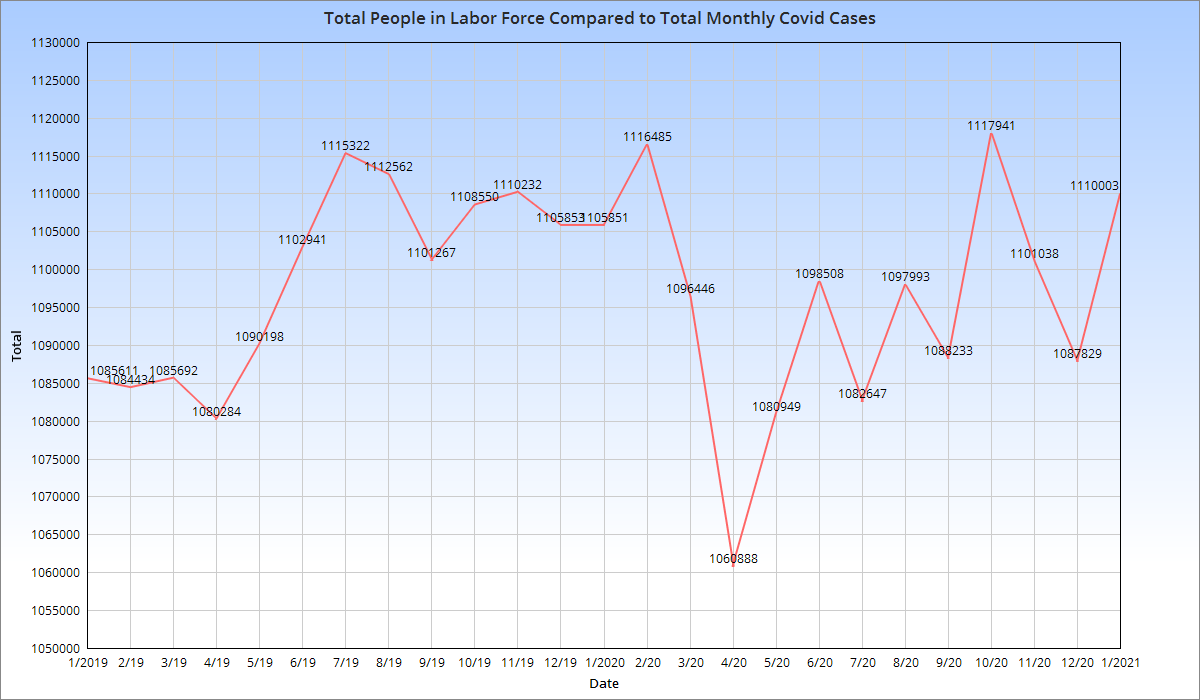
Labor Force: 1,136,345 +1,050
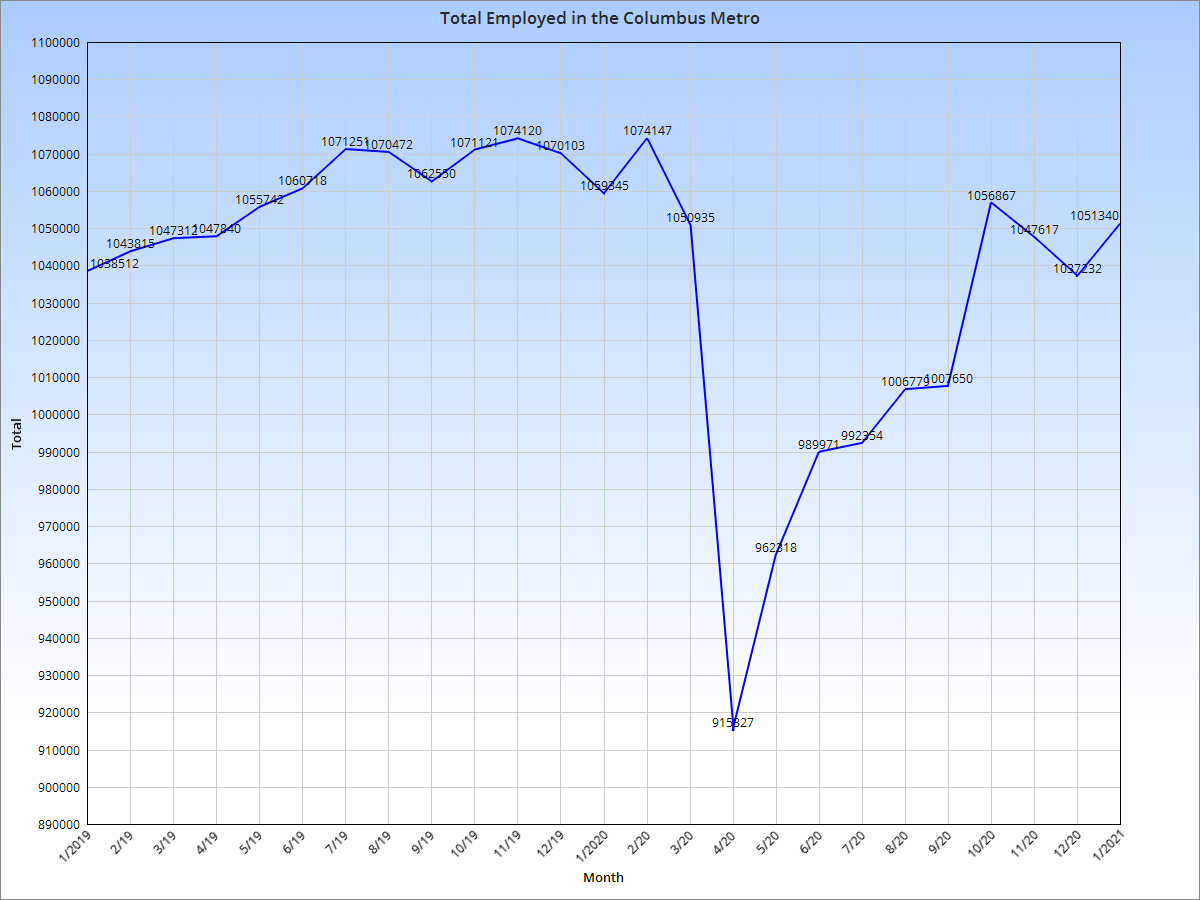
Employed: 1,093,966 +13,074
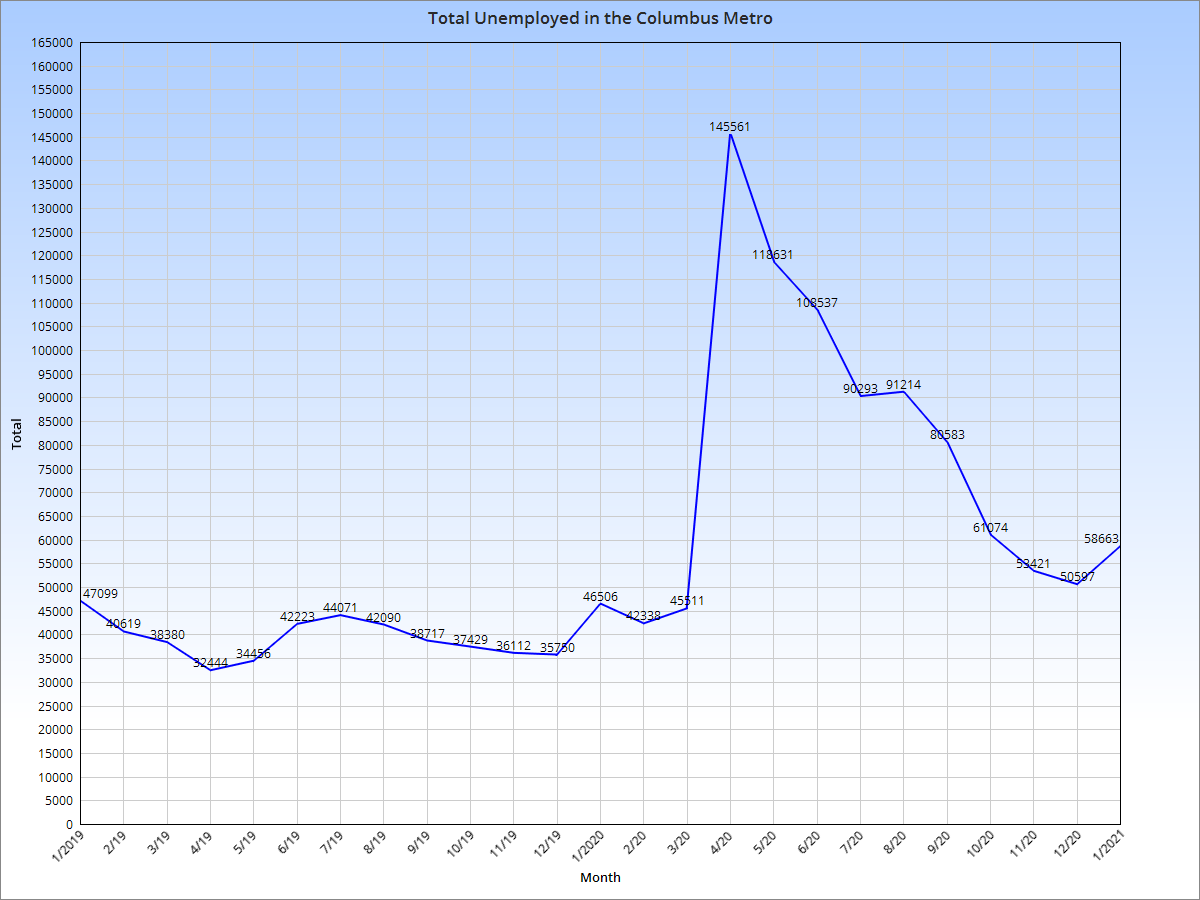
Unemployed: 42,379 -12,024
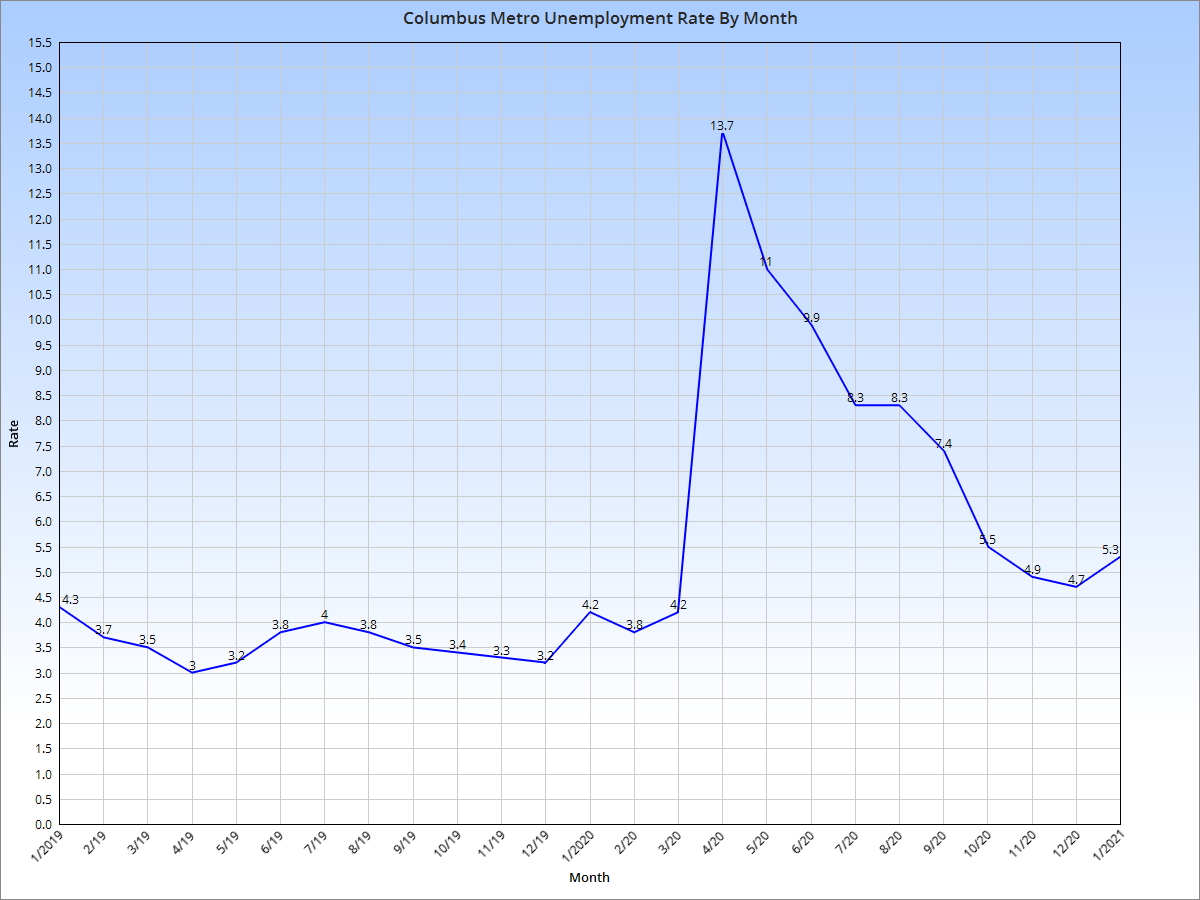
Unemployment Rate: 3.7% -1.1
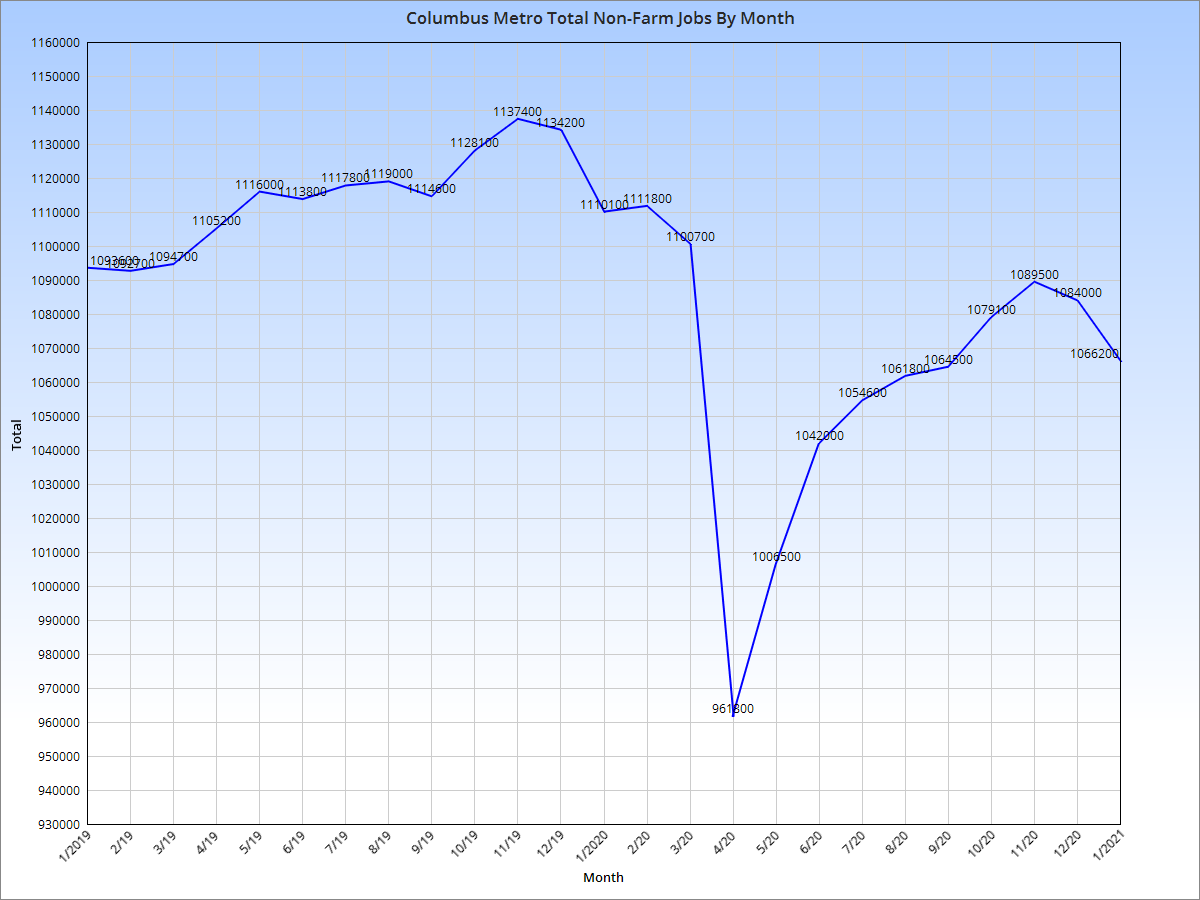
Total Non-Farm Jobs: 1,126,200 +16,400
Numbers continued the trend of improvement year-over-year, but labor force growth remained relatively slow.
Overall Metro Area July 2022 and Change from February 2020 (Pre-Pandemic)
Labor Force: 1,136,345 +15,541
Employed: 1,093,966 +17,126
Unemployed: 42,379 -1,585
Unemployment Rate: 3.7% -0.2
Total Non-Farm Jobs: 1,126,200 +14,800
The overall metro area remained better in July than the last month prior to the pandemic.
Now let’s view the results by industry.
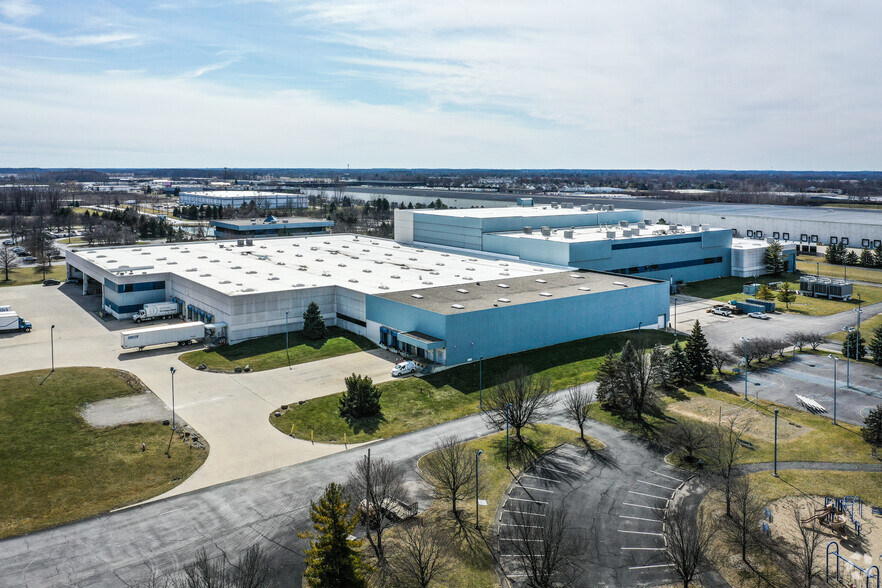
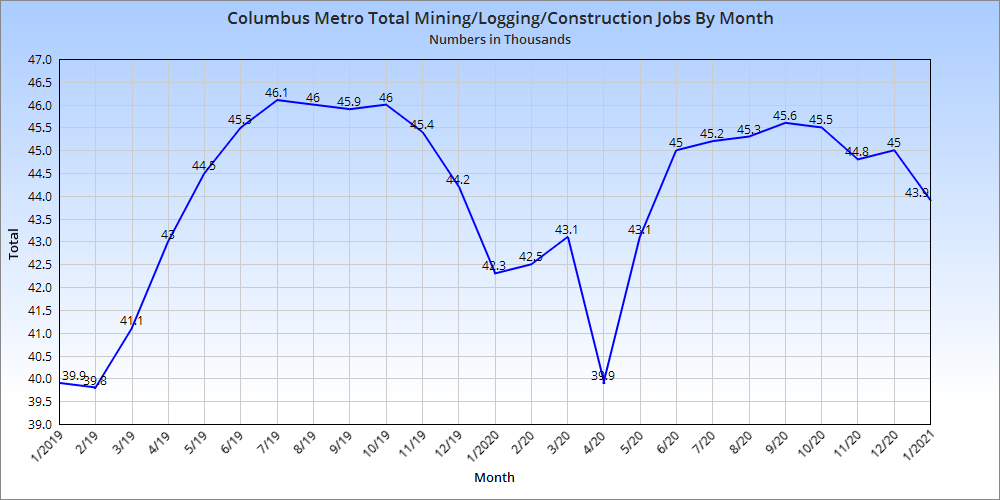
Mining/Logging/Construction
7/2020———–7/2021———-7/2022
45,200————46,800———48,200
These industries remain near their all-time highs for total metro jobs.
Mining/Logging/Construction Jobs as a % of Total Metro Jobs
7/2020————7/2021———7/2022
4.3——————4.2————–4.3
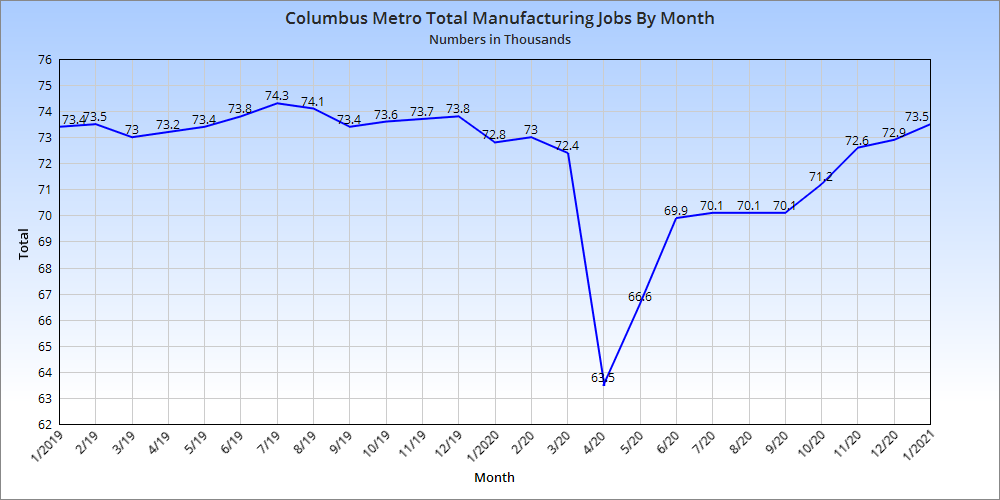
Manufacturing
7/2020———–7/2021———-7/2022
70,100———–72,700———-72,900
Manufacturing has largely recovered from pandemic losses, but remains well below historic highs achieved decades ago.
Manufacturing Jobs as a % of Total Metro Jobs
7/2020————7/2021———-7/2022
6.7——————6.6—————6.5
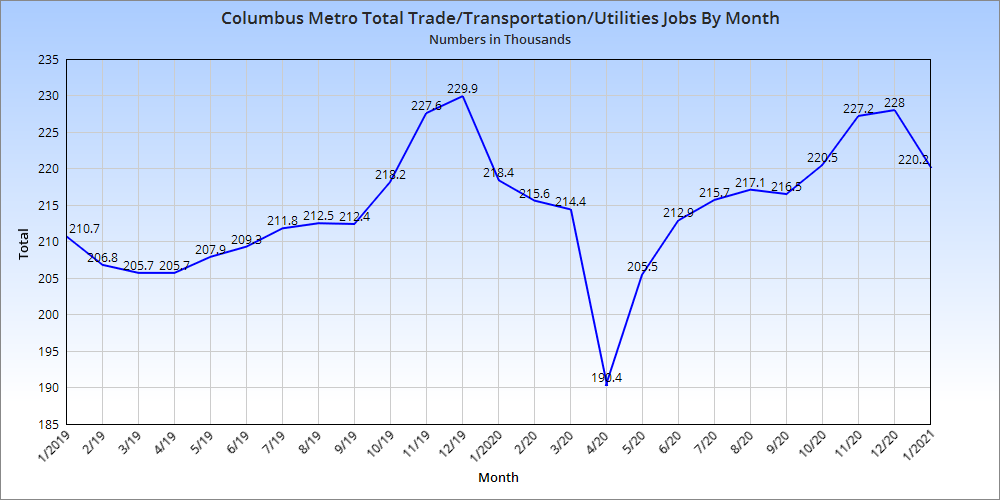
Trade/Transportation/Utilities
7/2020———–7/2021———-7/2022
215,000———-225,400———240,200
These industries are at historic highs.
Trade/Transportation/Utilities Jobs as a % of Total Metro Jobs
7/2020————7/2021———7/2022
20.4—————–20.3———–21.3
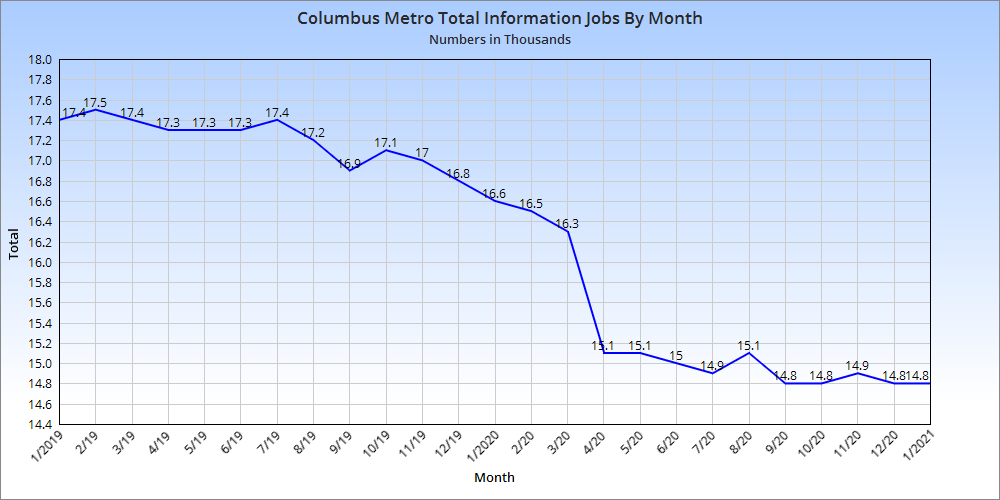
Information
7/2020———–7/2021———-7/2022
15,300———–16,000———-17,000
While nowhere near previous highs of the late 1990s-early 2000s “Dot.com” boom, this industry has been steadily growing since it hit a pandemic bottom in late 2020, and has returned to levels last seen in 2019.
Information Jobs as a % of Total Metro Jobs
7/2020————7/2021———-7/2022
1.5——————1.4—————1.5
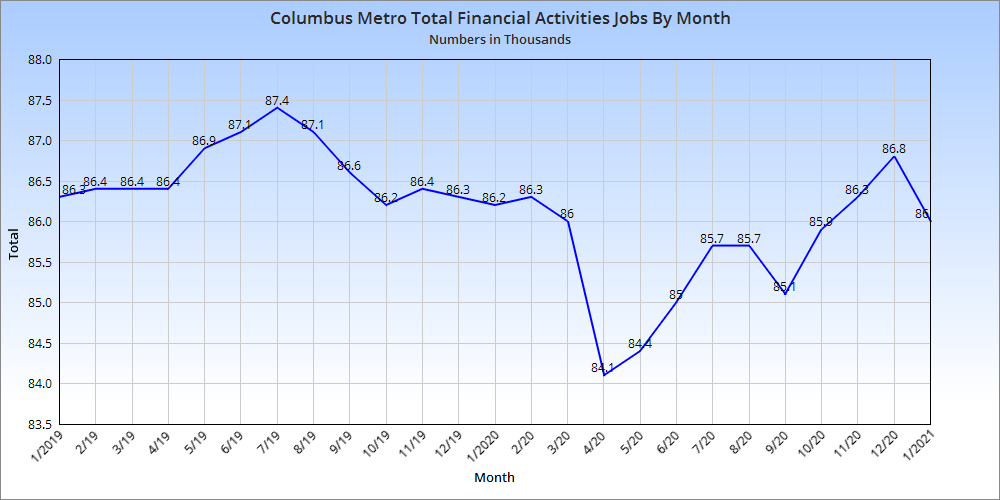
Financial Activities
7/2020———–7/2021———-7/2022
85,200———–85,900———-85,600
Financial jobs initially recovered from the pandemic recession, but then in late 2021 through part of 2022 plummeted to their lowest levels in 6 years. However, since May, they have been shooting back up and are once again close to historic highs.
Financial Activities Jobs as a % of Total Metro Jobs
7/2020————7/2021———-7/2022
8.1——————7.7—————7.6
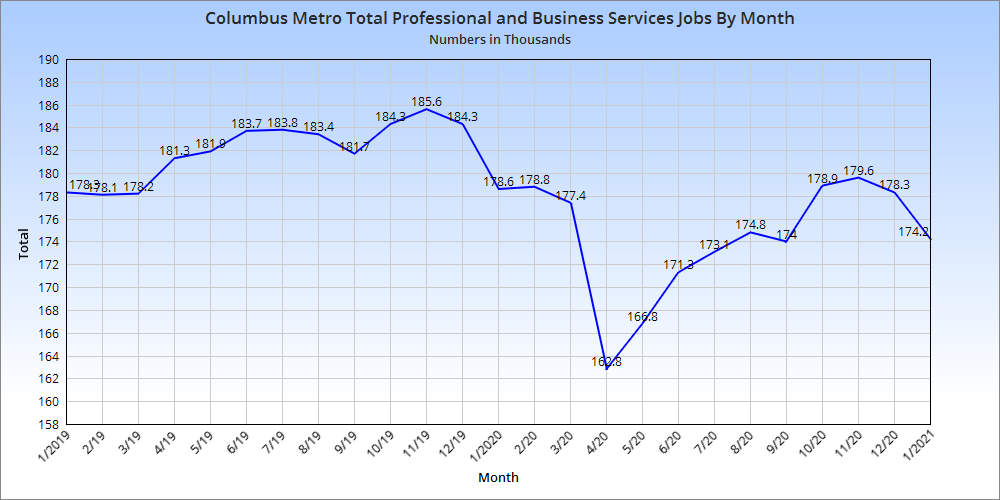
Professional and Business Services
7/2020———–7/2021———-7/2022
172,800———-183,800———181,200
These industries have been hovering around their highs since about 2015, so it seems like these jobs have not been changing much in recent years.
Professional and Business Services Jobs as a % of Total Metro Jobs
7/2020———–7/2021———-7/2022
16.4—————-16.6————–16.1
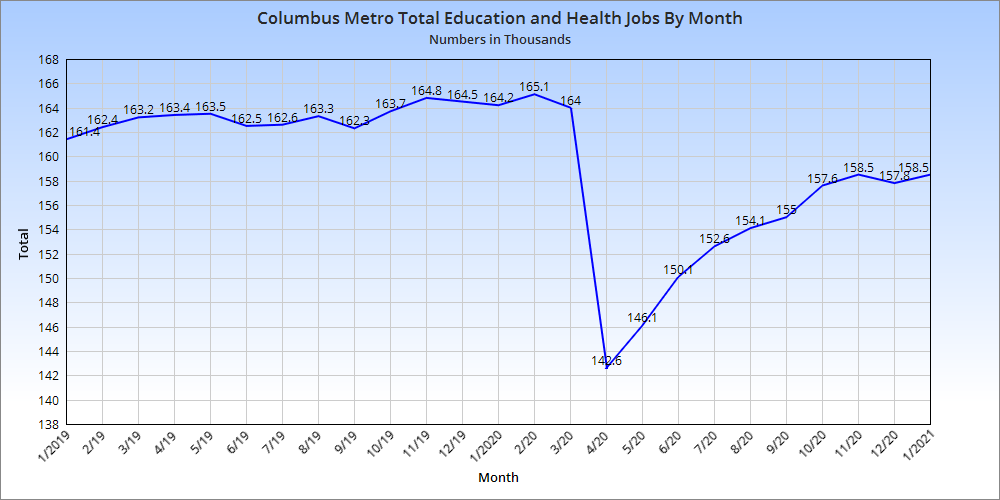
Education and Health Services
7/2020———–7/2021———-7/2022
152,100———-159,800———161,800
While these industries have not fully recovered to pre-pandemic levels, they are relatively close to doing so.
Education and Health Services Jobs as a % of Total Metro Jobs
7/2020———–7/2021———-7/2022
14.4—————-14.4————-14.4
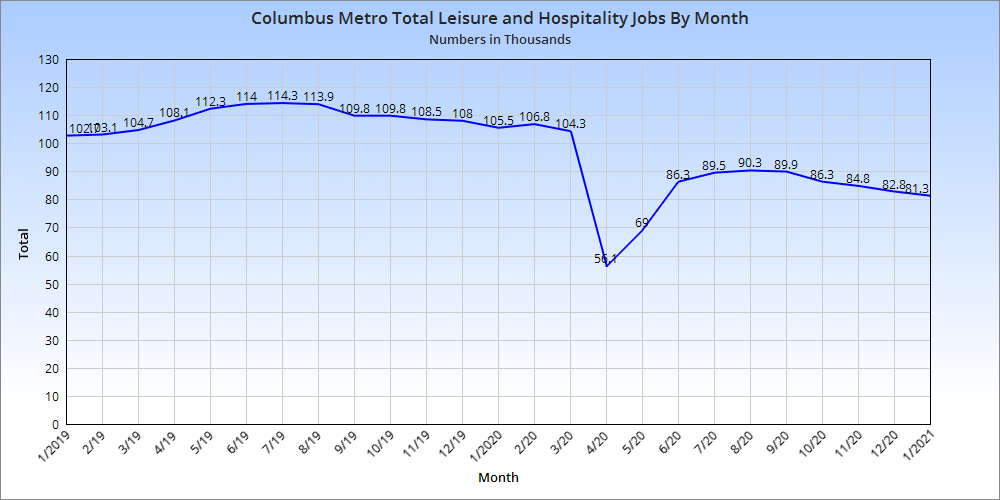
Leisure and Hospitality
7/2020———–7/2021———-7/2022
90,600———–105,600————108,000
This industry should be near historic highs by the holiday season, despite being hit the hardest during the recent recession.
Leisure and Hospitality Jobs as a % of Total Metro Jobs
7/2020————7/2021————7/2022
8.6——————9.5——————9.6
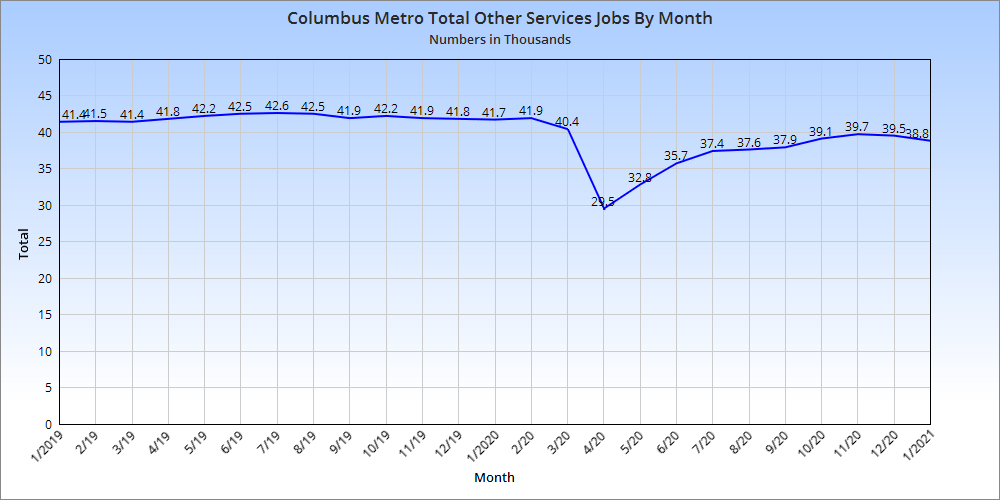
Other Services
7/2020———–7/2021———-7/2022
37,400———–41,100———-41,900
This industry is near historic highs.
Other Services Jobs as a % of Total Metro Jobs
7/2020———–7/2021———-7/2022
3.5—————–3.7—————-3.7
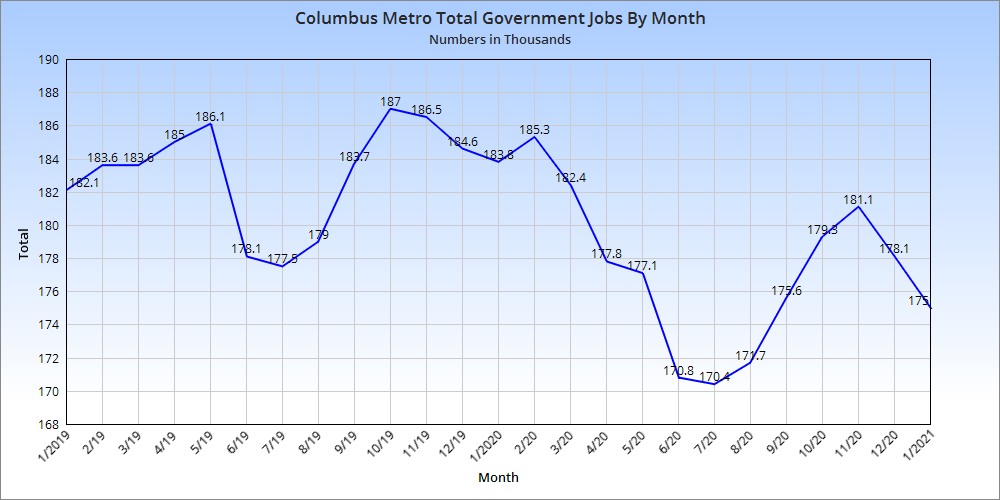
Government
7/2020———–7/2021———-7/2022
170,100———-172,700———169,400
Government jobs have been in a slow decline since the pandemic recession.
Government Jobs as a % of Total Metro Jobs
7/2020———–7/2021———-7/2022
16.1—————15.6————–15.0