With the Omicron variant running rampant, Columbus schools are facing significant absences from both students and staff. Keep track of this data with this hand link, which ranks the best and worst schools for absences, shows how many cases are being reported, quarantine data and more.
As with everywhere else in the country, Columbus has not gone unscathed by the Covid-19 pandemic and its related economic fallout. Just how bad did the situation get, though, and how was Columbus’ 20202 economic performance overall? Has it recovered since reaching pandemic bottom?
To find out, we’ll look at the latest economic data ending in January 2021.
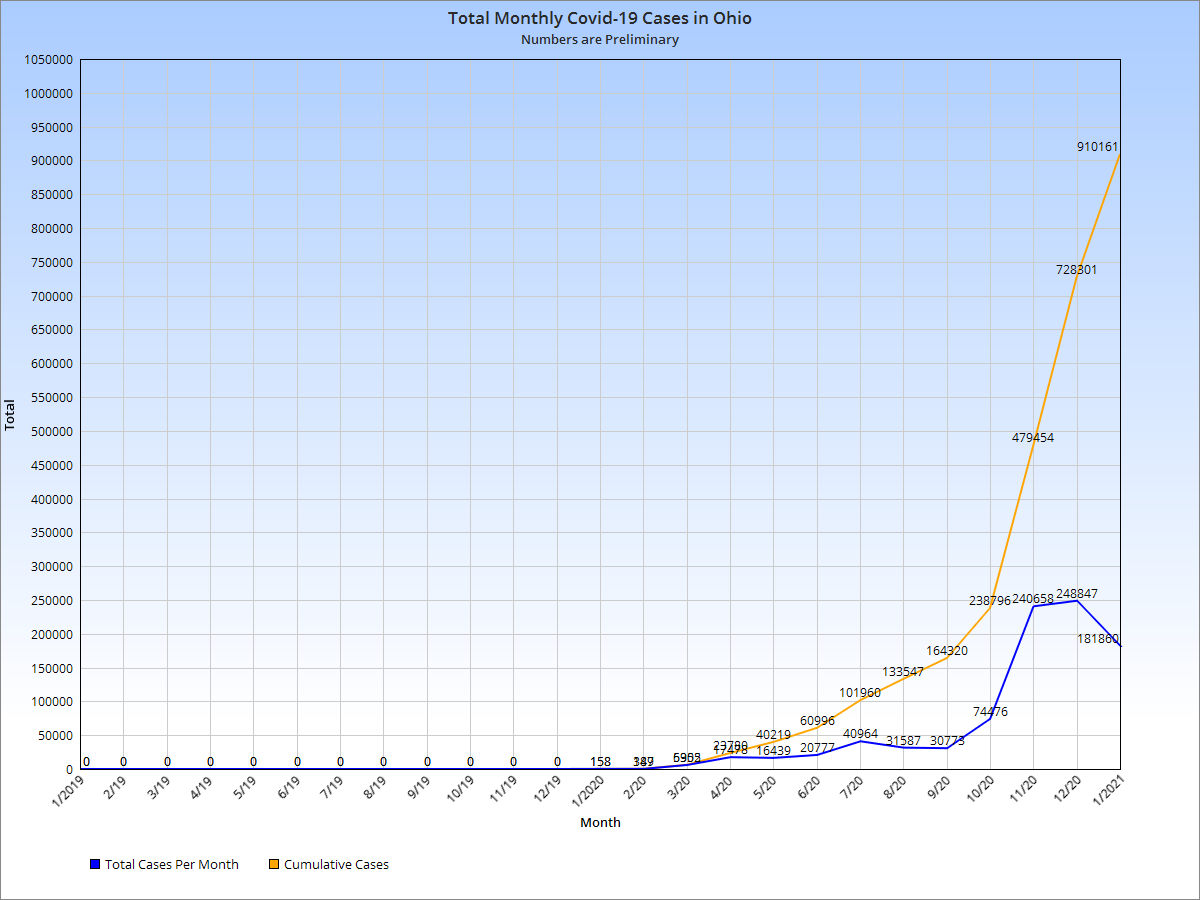
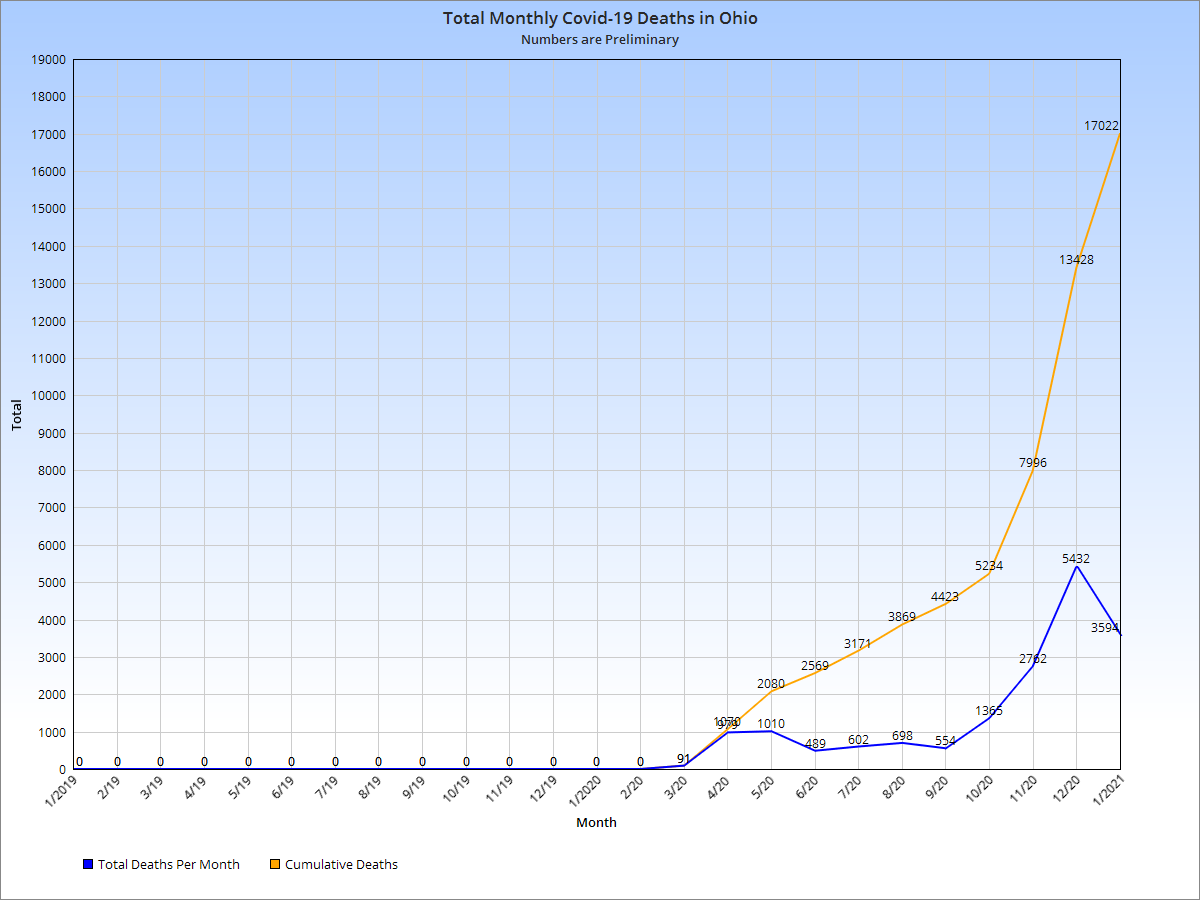
First, here are the historic and current Ohio Covid-19 numbers.
Covid 19 Cases and Deaths in Ohio In Ohio, the pandemic generally began in early January, though Ohio didn’t originally announce any cases until the end of February.
March 2020 marked the official beginning of the pandemic. It was on March 11th, 2020, however, that truly brought out the seriousness of the situation. On that day, multiple news stories all happened simultaneously. The WHO finally declared the situation a pandemic, state and local shutdowns began, Trump gave a national televised address announcing travel bans to Europe, and the stock market had one of its largest drops in history. The pile of bad news would begin affecting the economy almost immediately.
In Ohio, cases and deaths also began to add up quickly in March. As stay-at-home orders were issued and people stopped going out, there were mass layoffs across every industry of the economy.
So how was this all reflected in the economic data?
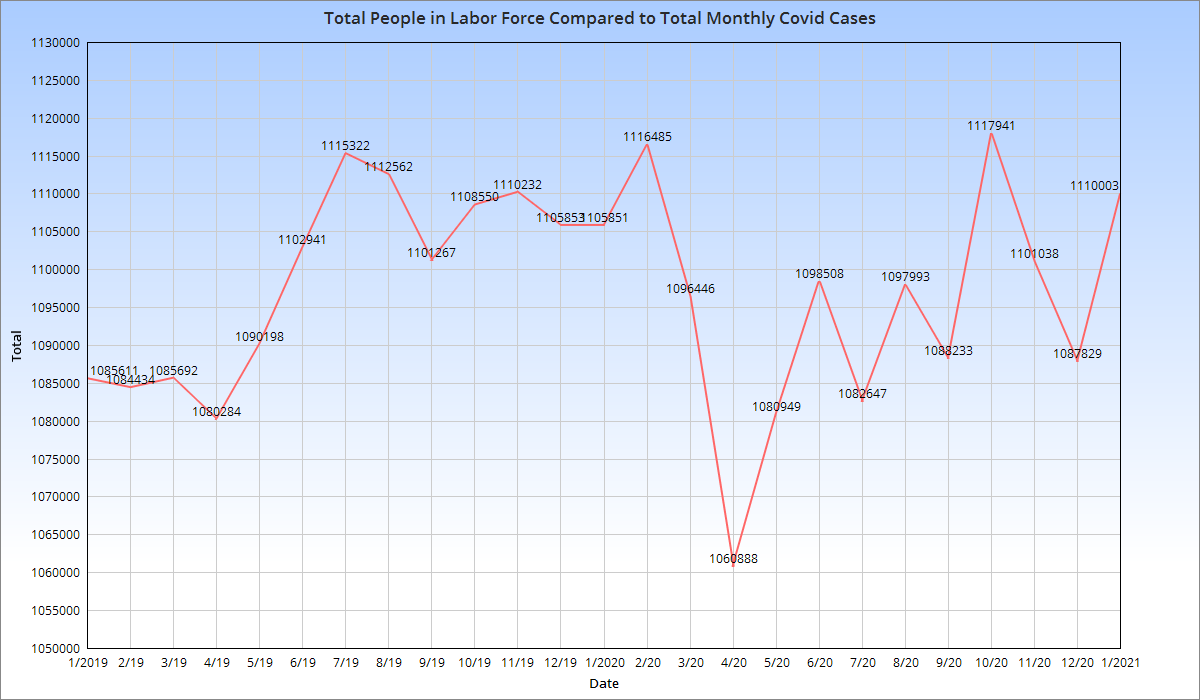
Columbus Metro Labor Force
The metro’s labor force was initially unfazed and reached peak in February 2020, slightly higher than the 2019 peak. However, March lost more than 20,000 from the labor force and April lost almost 36,000 more. The losses were mostly temporary, with a new peak being reached in October. However, the labor forced declined going into the late fall and winter as the 3rd- and worst- wave hit.
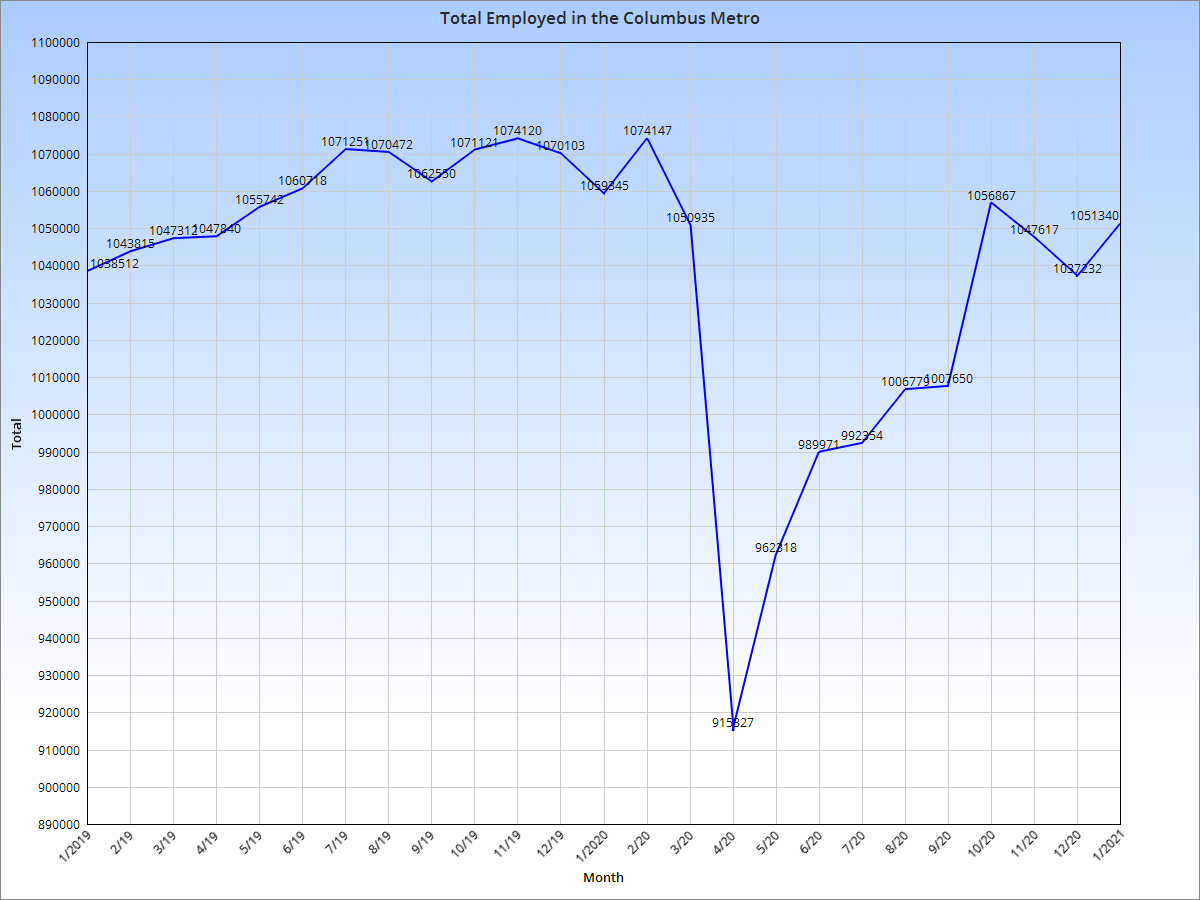
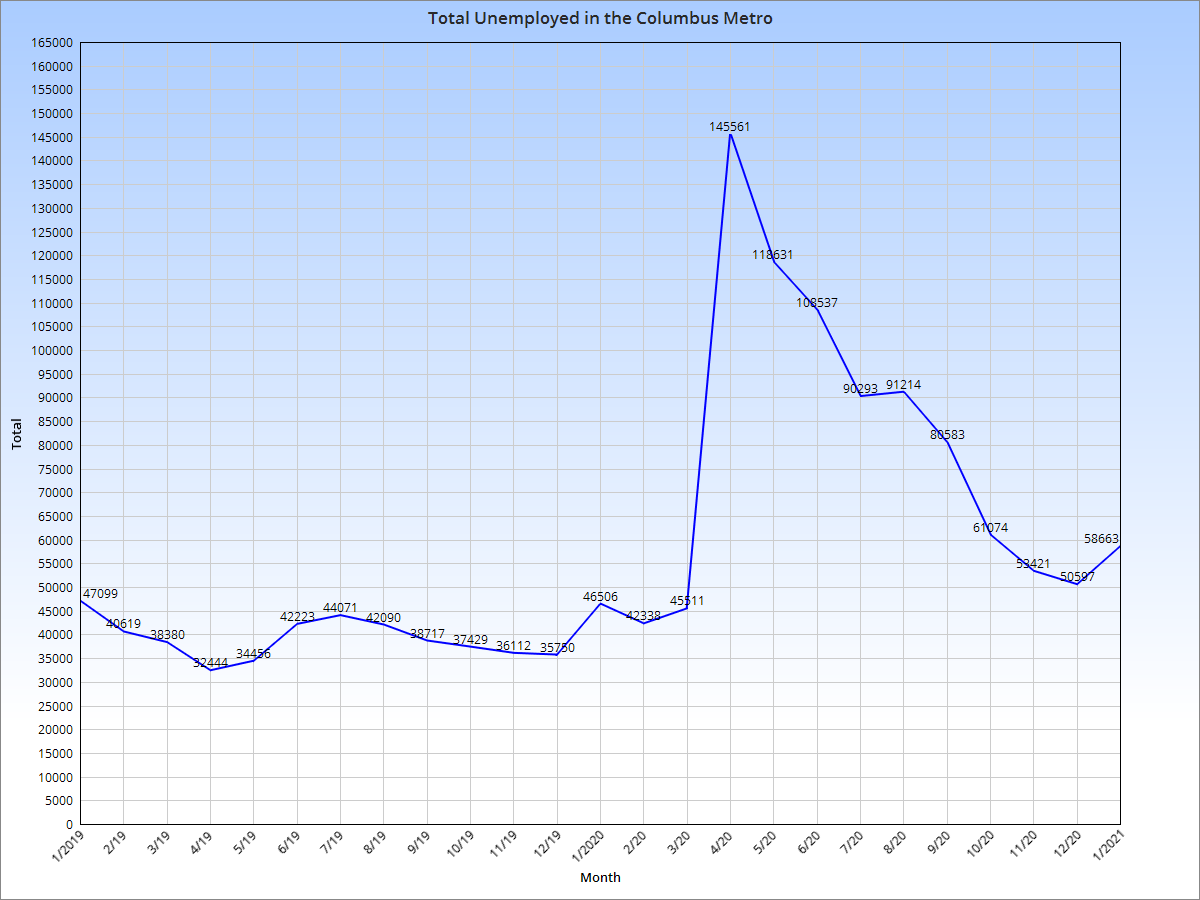
Columbus Metro Total Employed and Unemployed Employed totals were hit far harder than the labor force overall. More than 158K fewer people were employed in April versus February, a nearly 15% drop. Total employed has gone up since the bottom, but was still below the pre-Covid peak through January 2021.
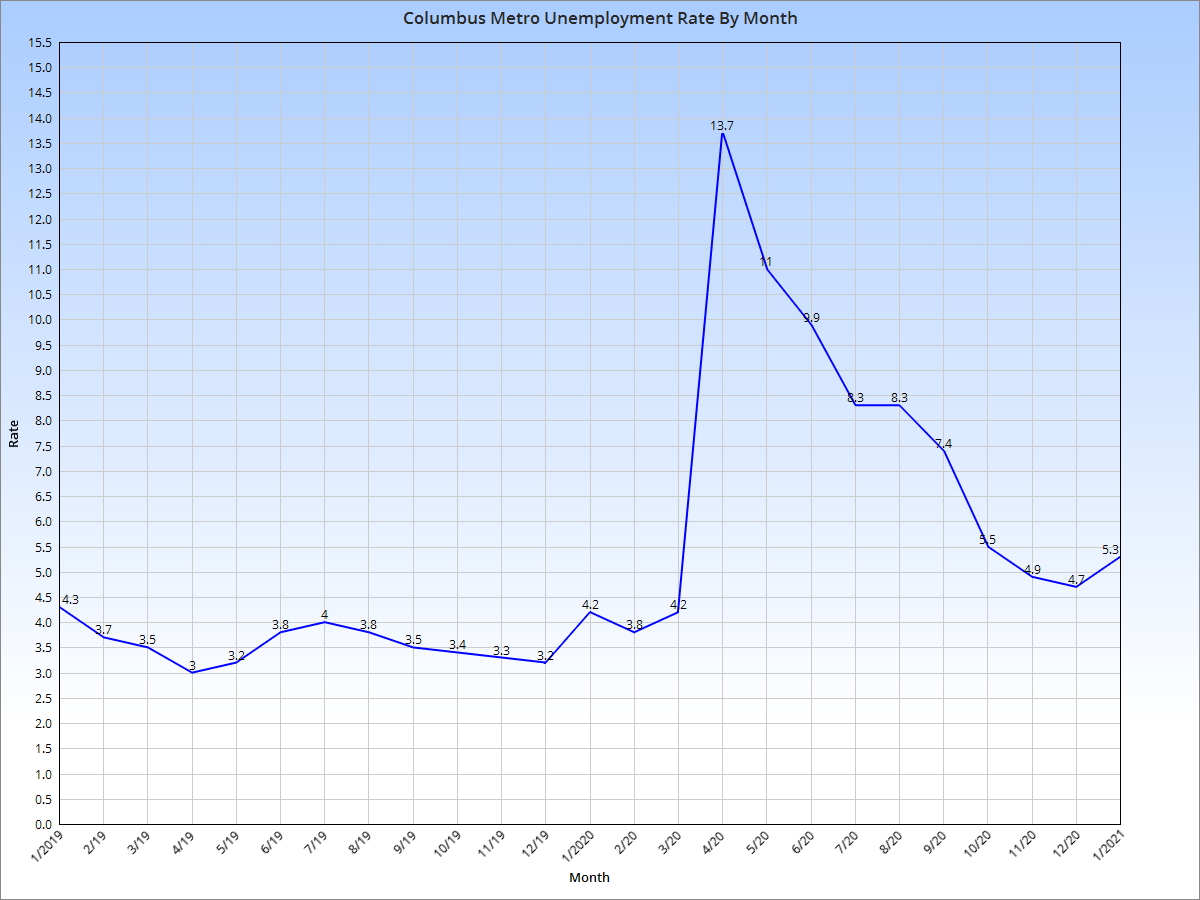
Columbus Metro Unemployment Rate The 13% unemployment in April was one of the highest outside of the Great Depression and nearly 4 points higher than the 2009-2010 recession. Unemployment fell through the end of 2020, but remained higher that pre-Covid levels. Columbus’ unemployment rate was a full point below the national average in January, a sign of its continuing economic resilience even during some of the worst economic conditions in generations.
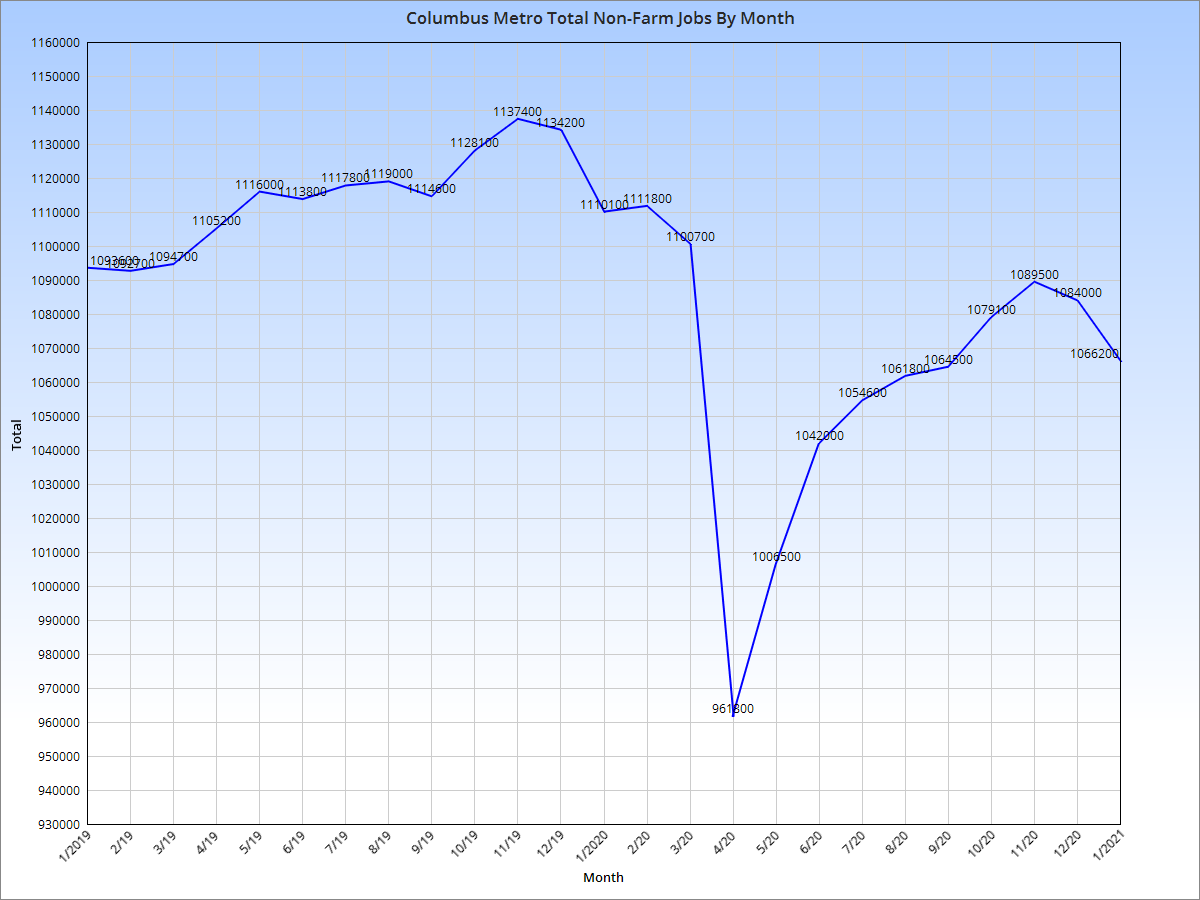
Columbus Metro Non-Farm Jobs Non-farm jobs in the metro area had peaked in November 2019 and had been declining even before the pandemic set in. Between February and April, 2020, 150,000 non-farm jobs were lost in the metro. As of January 2021, the metro was still short about 71,000 from the 2019 peak.
Now let’s take a closer look at how individual industries have performed.
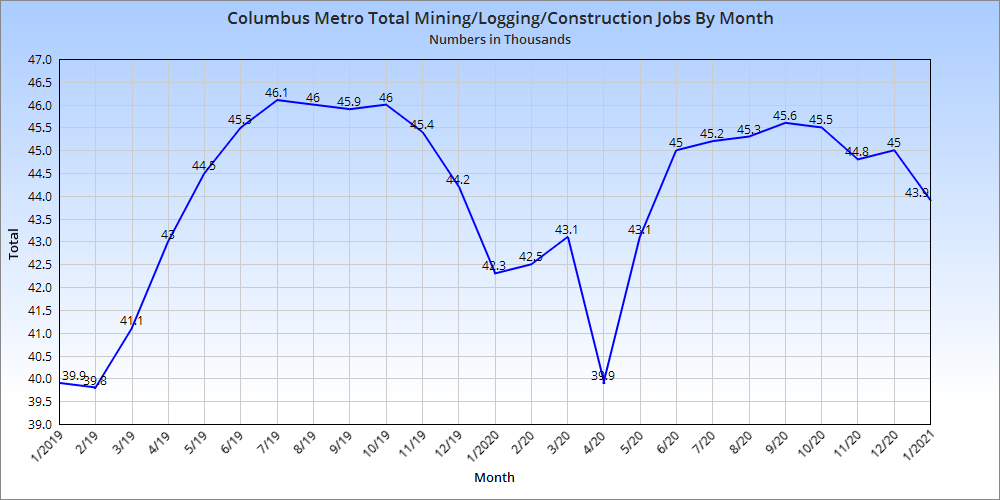
Columbus Jobs by Industry While the mining/logging/construction group did manage to get close to pre-Covid levels, it has been in general decline since last September, likely due to the 3rd wave that began in October.
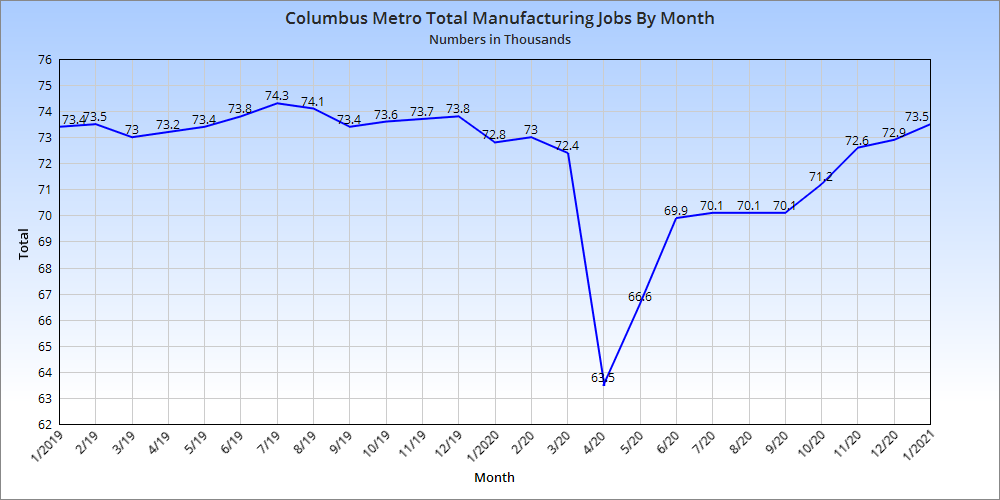
Manufacturing, surprisingly, has recovered completely, and jobs in the industry continued to rise through the 3rd wave.
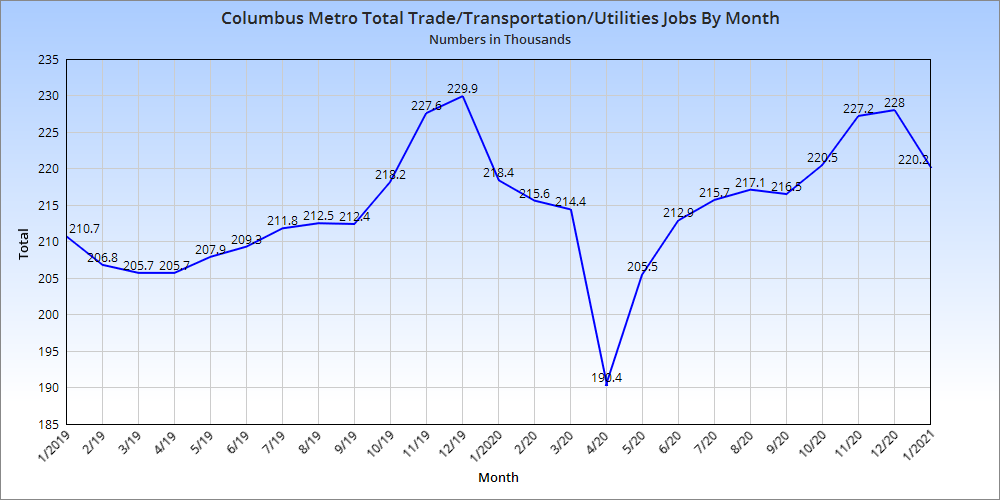
This industry group has also recovered fairly well, being close to where it was pre-Covid.
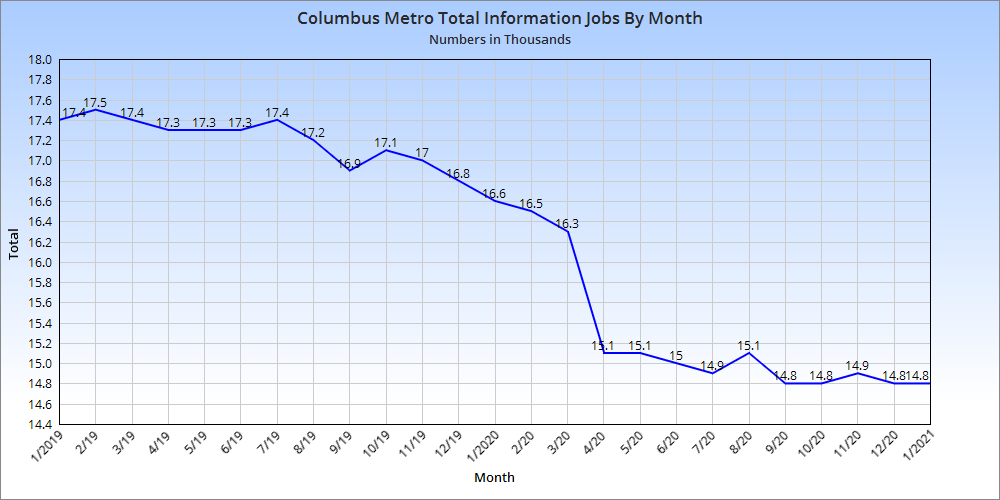
Information jobs were already in a long-term decline before the pandemic, but still faced a steep drop during the spring. Those lost jobs have not come back.
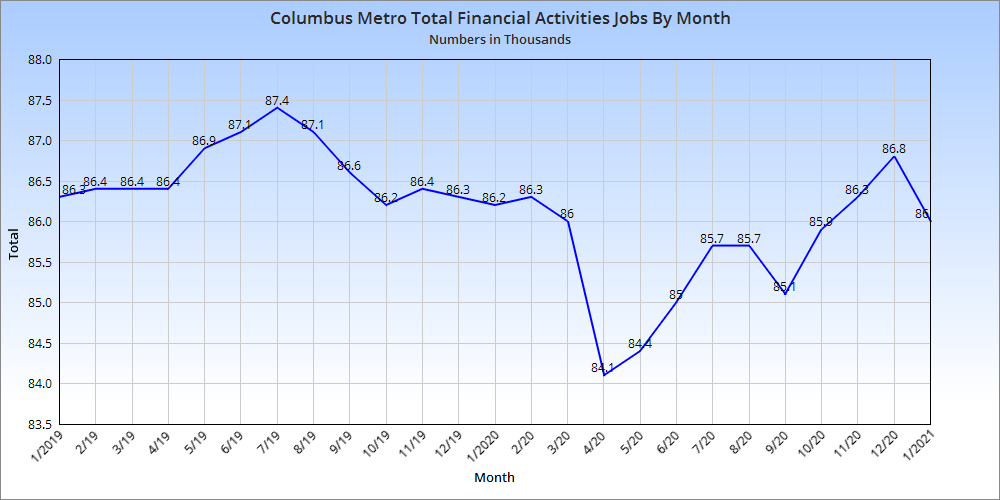
Financial activities jobs did not seem to face a significant decline, and have mostly recovered.
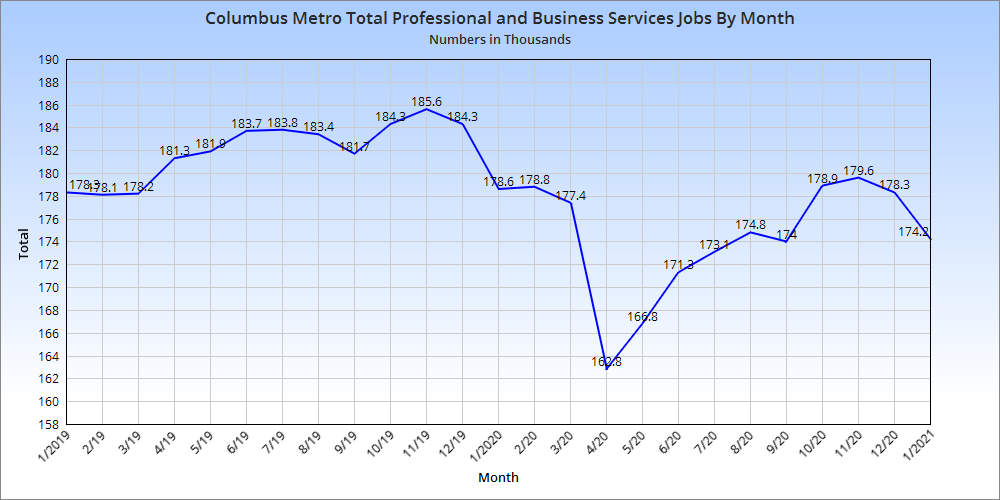
Professional and business services jobs were hit relatively hard during the economic collapse, and have only managed to recover about half of the losses through January.
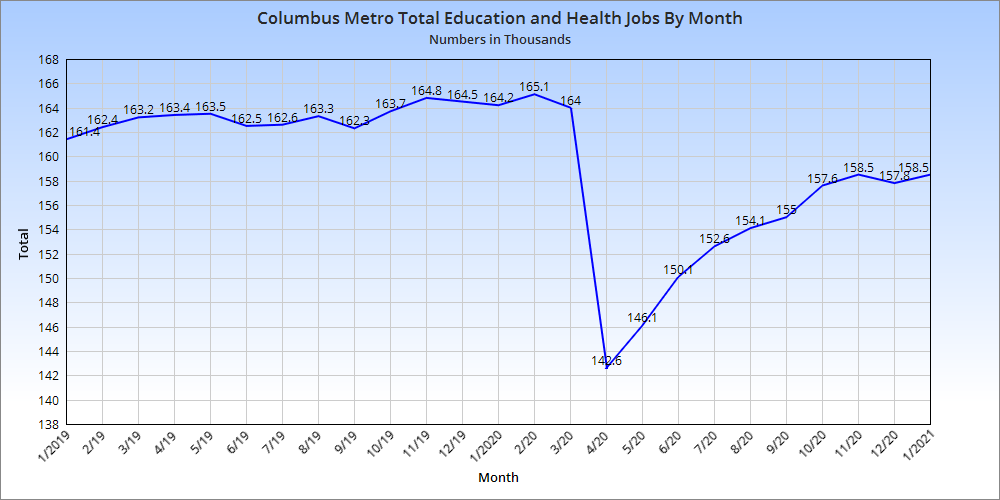
Another hard-hit industry group, the majority of the losses in the Health/Education group probably stem from the education side given that in-person schools have been mostly shut down the past year. Still, the industry group had recovered about 2/3rds of the losses through January.
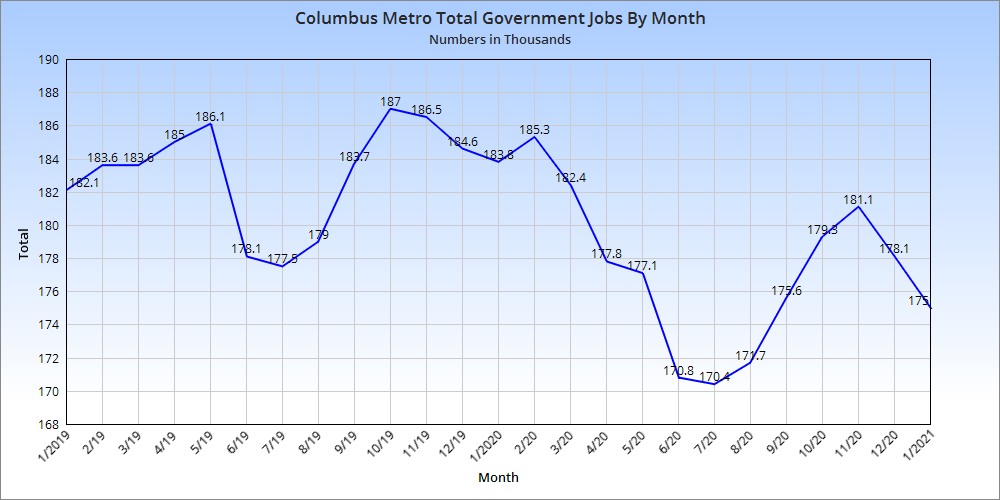
Government jobs typically see a significant mid-year drop, but it was much more severe in 2020. This category has not yet recovered fully.
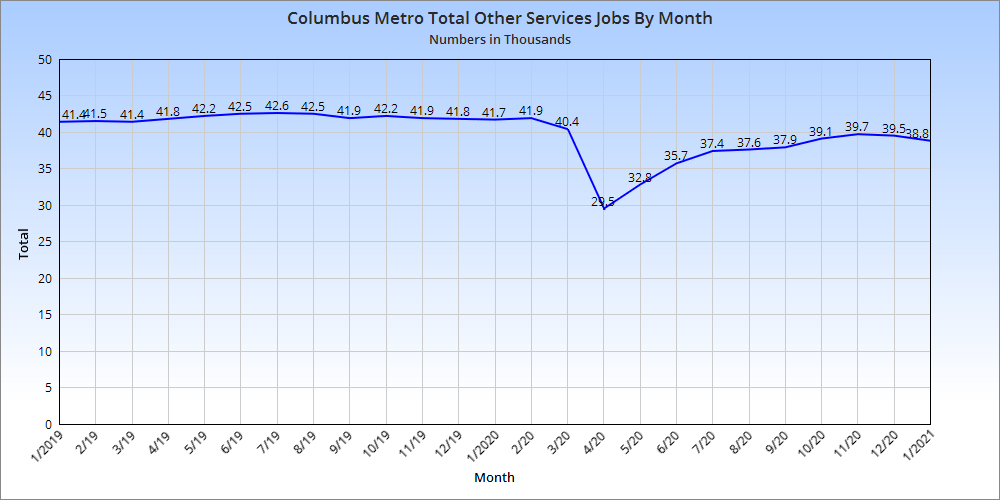
Other services jobs are typically pretty steady year over year and don’t see large changes. Obviously they did during the downturn, however. They have mostly recovered, although seemingly at a readjusted lower level.
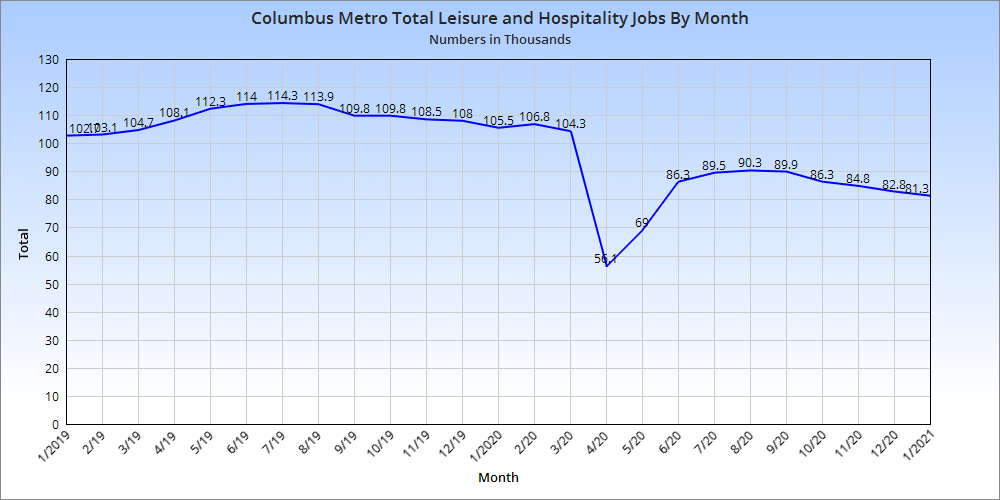
The leisure and hospitality industry was absolutely devastated, losing nearly 50% of all jobs. It has recovered some, but January still featured the fewest jobs in the industry since February 2003.
The Conclusion So as we can see, recovery for some industries is *far* better than others. Service industries have done much worse overall and continue to be below pre-Covid levels. This is not really all that surprising when restaurants, bars and other entertainment spots have faced the brunt of hardship. It remains to be seen how everything from economic stimulus packages to vaccination rates affect 2021, but it’s hard to imagine anything worse than last year.