In 1950, Columbus was much smaller than it is today. At just 40 square miles, it was just 17% of its current size. The city was small, compact and densely-populated. That would all change rapidly beginning in about 1955, when annexation policy promoted a period of rapid area growth. 1950 was the final measurement of the city before that annexation began and the development of the highway system allowed for massive suburbanization and “White Flight”. How did all of these changes affect the 1950 city’s urban core demographics? To find out, I looked at the census tracts that made up the city in 1950 and then tracked their changes over time.
For the following tables, I broke down demographics by race alone and Non-Hispanic and Hispanic categories.
Year
Total White Alone
Total Change
Total % Change
1950
328,770
--------------
------------
1960
315,463
-13,307
-4.05
1970
262,832
-52,631
-16.68
1980
202,748
-60,084
-22.86
1990
180,723
-22,025
-10.86
2000
151,394
-29,329
-16.23
2010
146,320
-5,074
-3.35
2020
155,301
8,981
+6.14
The White Alone demographic had by far the most significant change in the urban core. Overall, this demographic dropped 52.76% 1950-2020, though it did experience a modest increase 2010-2020. It’s unclear whether the Covid pandemic affected that more positive trajectory during the 2010s, or the trends of any demographics, and we won’t know for sure until the 2030 Census.
Year
Total Non-Hispanic White
Total Change
Total % Change
1990
179,308
----------
-----------
2000
149,215
-30,093
-16.78
2010
140,106
-9,109
-6.1
2020
150,850
10,744
+7.67
Hispanic and Non-Hispanic breakdowns did not begin until 1990.
Year
Total Black Alone
Total Change
Total % Change
1950
46,692
-----------
-----------
1960
72,771
26,079
+55.85
1970
85,068
12,297
+16.9
1980
79,345
-5,723
-6.73
1990
80,646
1,301
+1.64
2000
79,985
-661
-0.82
2010
68,928
-11,057
-13.82
2020
66,552
-2,376
-3.44
The Black Alone demographic grew rather rapidly between 1950-1970, which coincides with the Great Migration when large amounts of Black people moved north from the segregationist South. For another 30 years, the population remained rather stable before entering a decline through 2020. It was the only demographic looked at that declined 2010-2020, and it may be related to the recent gentrification of predominantly Black neighborhoods, particularly on the Near East Side, Franklinton and parts of Linden. Overall, the Black Alone population still grew 42.53% 1950-2020.
Year
Total Non-Hispanic Black
Total Change
Total % Change
1990
80,273
-----------
----------
2000
79,443
-830
-1.03
2010
68,231
-11,212
-14.11
2020
65,724
-2,507
-3.67
Year
Asian Alone
Total Change
Total % Change
1970
903
----------
----------
1980
1,808
905
+100.22
1990
5,255
3,447
+190.65
2000
5,715
460
+8.75
2010
6,490
775
+13.56
2020
7,983
1,493
+23.0
The Asian Alone population has seen consistent growth throughout the 1970-2020 period, and overall grew by 784.05%. Most of this population exists around the OSU Campus area, with scattered populations around Hilltop and Linden.
Year
Total Non-Hispanic Asian
Total Change
Total % Change
1990
5,047
---------
---------
2000
5,692
645
+12.78
2010
6,432
740
+13.0
2020
7,927
1,495
+23.24
Year
Other Alone
Total Change
Total % Change
1970
931
----------
----------
1980
2,478
1,547
+166.17
1990
2,000
-478
-19.29
2000
10,422
8,422
+421.1
2010
12,844
2,422
+23.24
2020
28,396
15,552
+121.08
Other Alone is an interesting category that is a bit more difficult to track since the category was introduced in 1970, as what is defined as “Other” has changed over time, so part of the growth is through those definitional changes. In general Other refers to people such as Native Americans, Pacific Islanders, and 2 or more races. Regardless of its makeup, this demographic grew by 2,950.05% 1970-2020.
Year
Total Other Non-Hispanic
Total Change
Total % Change
1990
1,190
----------
---------
2000
7,863
6,673
+560.76
2010
8,068
205
+2.61
2020
14,979
6,911
+85.66
Year
Total Hispanic
Total Change
Total % Change
1980
1,467
----------
----------
1990
2,806
1,339
+91.27
2000
5,313
2,507
+89.34
2010
9,139
3,826
+72.01
2020
17,459
8,320
+91.04
The Hispanic population has grown significantly since it began to be tracked in census data in 1980. Overall, the city core Hispanic population has grown by 1,090.12% over the period. Much of this population is in either Hilltop, near the airport, or in northern parts of Linden.
There have been a lot of updates and additions to the site in the last month.
The Historic Building Database pages now contain more than 1,200 buildings.
A new Local Sports History page has been added under the History tab. It contains information on Columbus’ college, minor and major league sports teams going back to the 19th Century.
The May Weather page has been updated with 2020 data, and records can be viewed back to 1879.
The numerous severe weather pages have all been updated to some degree over the past month or so with more links, events and even videos.
The Demographics and Population pages have been updated with 2019 population data, as well as various information related to income, GDP, housing and more!
Finally, a new Columbus Crime Statistics page has been added under the Demographics and Population tab. You can view total crimes, crime rates and maps going back to 1985.
In the ongoing series discussing topics related to the 2018 Census demographic estimates, today I will update the foreign-born comparison. Beyond the simple comparison, I will also talk about the regions and countries that the foreign-born populations come from.
Total Foreign-Born Population Rank by City 2010 and 2018 2010————————————-——-2018 1. Chicago: 557,674—————1. Chicago: 540,738 2. San Jose: 366,194————-2. San Jose: 407,839 3. Austin: 148,431—————-3. Austin: 180,544 4. Las Vegas: 130,503———–4. Las Vegas: 133,033 5. Sacramento: 96,105———-5. Columbus: 125,339 6. Columbus: 86,663————-6. Sacramento: 114,786 7. Portland: 83,026—————7. Jacksonville: 111,798 8. Jacksonville: 77,145——–8. Nashville: 95,040 9. Indianapolis: 74,707——–9. Portland: 90,728 10. Nashville: 73,327———-10. Indianapolis: 81,764 11. Minneapolis: 57,846——11. Minneapolis: 68,131 12. Milwaukee: 57,222——–12. St. Paul: 59,381 13. Providence: 52,920——-13. Milwaukee: 57,647 14. St. Paul: 50,366———–14. Omaha: 50,279 15. Virginia Beach: 40,756—15. Providence ;46,995 16. Omaha: 39,288————16. Detroit: 44,520 17. Wichita: 39,128————17. Kansas City: 43,485 18. Kansas City: 35,532——18. Virginia Beach: 43,385 19. Detroit: 34,307————19. Wichita: 42,171 20. Madison: 24,929———20. Madison: 32,622 21. St. Louis: 23,011———-21. Des Moines: 31,013 22. Lincoln: 22,214———–22. Pittsburgh: 26,569 23. Des Moines: 20,798—–23. Lincoln: 23,309 24. Pittsburgh: 18,698——24. Fort Wayne: 22,489 25. Cleveland: 17,739——-25. Cleveland: 21,838 26. Grand Rapids: 16,615—26. St. Louis: 21,538 27. Cincinnati: 16,531——-27. Cincinnati: 20,592 28. Fort Wayne: 15,286—-28. Grand Rapids: 20,032 29. Toledo: 11,159———–29. Akron: 13,649 30. Akron: 8,524————30. Toledo: 9,038 31. Dayton: 5,102———–31. Dayton: 7,311 32. Youngstown: 3,695—-32. Canton: 3,241 33. Canton: 1,343———–33: Youngstown: 976
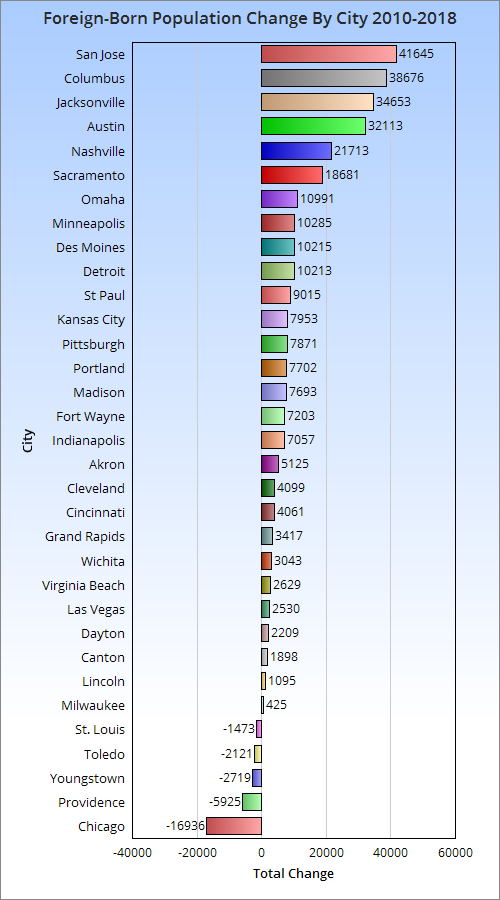
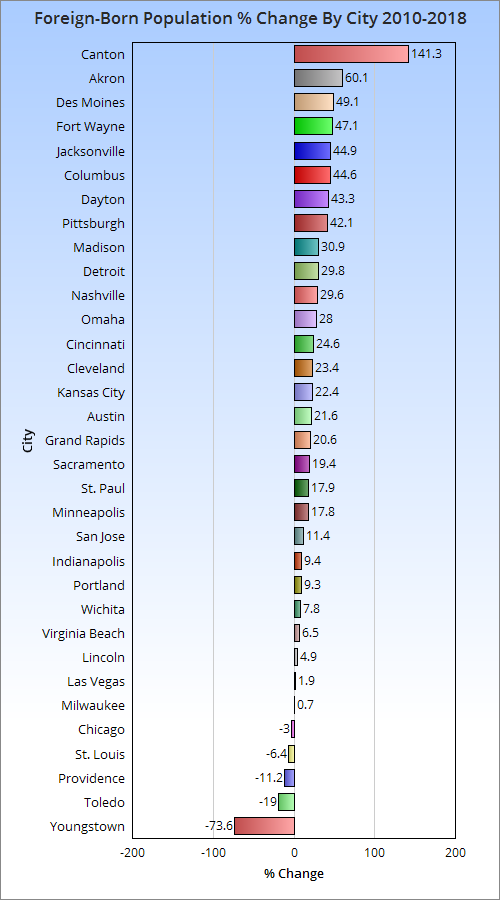
Here’s the 2010-2018 total change. And the 2010-2018 change by %.
Columbus has done very well in both total and % growth of its foreign-born population since 2010.
So now that we know how many foreign-born immigrants are arriving and how fast, let’s take a look at where they are coming from.
Total Foreign-Born Residents From Europe in 2000 and 2018 2000———————————————–2018 1. Chicago: 145,462———————1. Chicago: 91,397 2. San Jose: 21,904———————2. San Jose: 22,043 3. Portland: 17,572———————-3. Jacksonville: 18,808 4. Jacksonville: 10,883————4. Portland: 17,016 5. Las Vegas: 9,070—————-5. Austin: 11,981 6. Cleveland: 8,796—————-6. Las Vegas: 11,472 7. St. Louis: 8,543——————7. Columbus: 8,141 8. Sacramento: 8,204————-8. Nashville: 8,108 9. Milwaukee: 7,841—————9. Virginia Beach: 6,710 10. Austin: 7,474——————10. Sacramento: 6,275 11. Pittsburgh: 7,413————–11. Pittsburgh: 5,047 12. Columbus: 7,017————–12. Minneapolis: 5,031 13. Indianapolis: 6,543———–13. Omaha: 3,845 14. Virginia Beach: 6,333——–14. St. Louis: 4,711 15. Detroit: 5,600—————–15. Indianapolis: 4,199 16. Minneapolis: 5,409———–16. Omaha: 3,845 17. Providence: 5,126————-17. Milwaukee: 3,808 18. Nashville: 4,859—————18. Madison: 3,519 19. Cincinnati: 3,851————–19. Providence: 3,030 20. Grand Rapids: 3,396———20. Lincoln: 2,777 21. Omaha: 3,320—————–21. Cincinnati: 2,738 22. St. Paul: 3,255—————-22. St. Paul: 2,449 23. Des Moines: 3,216———–23. Grand Rapids: 2,336 24. Kansas City: 2,985———-24. Kansas City: 2,320 25. Madison: 2,871—————25. Fort Wayne: 2,235 26. Lincoln: 2,701—————-26. Wichita: 1,851 27. Akron: 2,687—————–27. Detroit: 1,767 28. Fort Wayne: 2076———–28. Akron: 1,580 29. Toledo: 2,020—————-29. Des Moines: 1,042 30. Wichita: 2,004————–30. Toledo: 496 31. Dayton: 901——————31. Canton: 347 32. Youngstown: 870———–32. Dayton: 347 33. Canton: 590—————–33. Youngstown: 337
Columbus had more European immigrants than most in 2000 and 2018, and was one of the relatively few cities that saw an increase by 2018.
Total Foreign-born Population from Asia 2000 and 2018 2000————————————————–2018 1. San Jose: 182,712—————————1. San Jose: 256,504 2. Chicago: 112,932—————————2. Chicago: 144,970 3. Sacramento: 40,253———————3. Austin: 59,711 4. Portland: 26,271—————————4. Sacramento: 56,084 5. Austin: 25,036——————————5. Columbus: 49,185 6. St. Paul: 23,245———————-6. Portland: 42,245 7. Columbus: 22,354——————-7. Jacksonville: 39,543 8. Jacksonville: 17,427—————–8. Las Vegas: 35,959 9. Minneapolis: 17,376—————–9. St. Paul: 34,246 10. Las Vegas: 17,062—————–10. Nashville: 28,142 11. Virginia Beach: 15,176————-11. Indianapolis: 24,992 12. Detroit: 15,114———————-12. Virginia Beach: 21,954 13. Nashville: 12,573——————-13. Milwaukee: 18,192 14. Milwaukee: 12,114——————14. Minneapolis: 17,929 15. Wichita: 10,826——————–15. Detroit: 17,474 16. Madison: 9,736——————–16. Madison: 17,021 17. Indianapolis: 9,190—————-17. Omaha: 14,582 18. Pittsburgh: 7,938—————–18. Wichita: 14,107 19. Providence: 7,871—————–19. Kansas City: 13,753 20. Kansas City: 7,312—————-20. Des Moines: 13,139 21. Lincoln: 6,691———————-21. Pittsburgh: 12,929 22. St. Louis: 6,425——————–22. Lincoln: 11,233 23. Omaha: 6,302 ———————23. Fort Wayne: 10,809 24. Cleveland: 6,213——————-24. Cleveland: 10,351 25. Des Moines: 5,239—————-25. St. Louis: 9,505 26. Cincinnati: 4,326——————26. Akron: 8,391 27. Toledo: 3,847———————-27. Providence: 7,744 28. Grand Rapids: 3,206————–28. Cincinnati: 5,599 29. Akron: 3,099———————–29. Toledo: 3,597 30. Fort Wayne: 2,792—————–30. Grand Rapids: 3,369 31. Dayton: 903————————-31. Dayton: 2,575 32. Youngstown: 338——————32. Canton: 542 33. Canton: 296————————33. Youngstown: 196
Columbus ranks even higher with its foreign-born Asian population.
Total Foreign-born Population from Africa 2000 and 2018 2000—————————————————2018 1. Minneapolis: 12,765——————–1. Columbus: 45,092 2. Chicago: 12,613————————-2. Minneapolis: 26,271 3. Columbus: 9,530———————–3. Chicago: 25,573 4. San Jose: 5,189————————-4. Nashville: 18,423 5. St. Paul: 4,697———————5. Indianapolis: 14,965 6. Nashville: 4,183——————-6. St. Paul: 13,594 7. Detroit:: 3,249———————7. Austin: 9,961 8. Providence: 3,138—————-8. Kansas City: 8,558 9. Indianapolis: 2,650—————9. San Jose: 8,546 10. Portland: 2,430—————–10. Cincinnati: 7,113 11. Austin 2,263———————11. Des Moines: 6,191 12. Kansas City: 2,192————–12. Omaha: 5,474 13. Cincinnati: 1,781—————-13. Grand Rapids: 3,932 14. Jacksonville: 1,719————-14. Portland: 3,899 15. St. Louis: 1,500—————–15. St. Louis: 3,777 16. Omaha: 1,497——————-16. Providence: 3,571 17. Milwaukee: 1,332—————17. Milwaukee: 3,552 18. Cleveland: 1,075—————-18. Jacksonville: 3,426 19. Sacramento: 1,051————-19. Lincoln: 2,942 20. Des Moines: 1,038————-20. Wichita: 2,752 21. Madison: 991——————–21. Madison: 2,599 22. Wichita: 946——————–22. Detroit: 2,081 23. Las Vegas: 916—————–23. Pittsburgh: 1,909 24. Pittsburgh: 905—————-24. Sacramento: 1,784 25. Virginia Beach: 840———–25. Virginia Beach: 1,783 26. Grand Rapids: 718————-26. Fort Wayne: 1,614 27. Toledo: 638——————–27. Dayton: 1,573 28. Lincoln: 637——————–28. Akron: 1,312 29. Dayton: 522——————–29. Las Vegas: 1,206 30. Fort Wayne: 384————–30. Cleveland: 622 31. Akron: 197———————-31. Toledo: 416 32. Canton: 89———————32. Youngstown: 277 33. Youngstown: 50—————33. Canton: 95
Columbus has claimed the number 1 spot in its foreign-born African population, passing previous top city Minneapolis.
And finally, the total foreign-born population from the Americas in 2000 and 2018 2000—————————————————-2018 1. Chicago: 357,235————————–1. Chicago: 277,742 2. San Jose: 117,989————————2. San Jose: 119,455 3. Austin: 73,935———————-3. Austin: 97,933 4. Las Vegas: 63,277——————4. Las Vegas: 83,782 5. Sacramento: 28,927—————5. Jacksonville: 49,339 6. Providence: 27,649—————-6. Sacramento: 42,722 7. Milwaukee: 24,781——————7. Nashville: 39,633 8. Detroit: 21,527———————-8. Indianapolis: 37,287 9. Portland: 20,939——————-9. Providence: 32,650 10. Minneapolis: 19,648————-10. Milwaukee: 31,917 11. Indianapolis: 17,530————–11. Omaha: 26,012 12. Nashville: 17,125——————12. Wichita: 23,429 13. Omaha: 14,467——————–13. Detroit: 23,198 14. Wichita:: 13,988——————14. Columbus: 22,469 15. Grand Rapids: 13,477————15. Portland: 20,407 16. Kansas City: 12,948————–16. Minneapolis: 18,765 17. Jacksonville: 11,881—————17. Kansas City: 18,170 18. St.Paul: 9,804———————18. Virginia Beach: 12,667 19. Columbus: 8,596—————–19. Des Moines: 10,675 20. Des Moines: 6,201—————20. Grand Rapids: 10,395 21. Virginia Beach: 5,754————21. Madison: 9,349 22. Cleveland: 5,192—————–22. St. Paul: 9,070 23. Madison: 5,080——————23. Fort Wayne: 7,831 24. Fort Wayne: 4,930————–24. Lincoln: 6,280 25. Lincoln: 3,106——————–25. Pittsburgh: 5,898 26. St. Louis: 2,961——————-26. Cleveland: 5,810 27. Toledo: 2,942———————27. Cincinnati: 4,901 28. Pittsburgh: 2,463—————-28. Toledo: 4,347 29. Cincinnati: 2,432—————–29. St. Louis: 3,545 30. Dayton: 919———————-30. Dayton: 2,816 31. Akron: 891————————31. Akron: 2,366 32. Canton: 347———————-32. Canton: 2,257 33. Youngstown: 333—————33. Youngstown: 166
Columbus does the worst with this group, but even here it moved up 5 spots in the rankings.
The rest of the foreign-born population is made up of small groups of people from Oceania- or basically island nations.
Yesterday, the US Census released tons of new demographic data for 2018. The next few posts will detail some of that data and how Columbus compares to Midwestern and national peers in terms of population, racial diversity and other metrics. These peers are based on either large Midwestern cities or metro areas between 1.5-2.5 million. This post will be a racial diversity comparison, specifically.
Total Non-Hispanic White Population by City by Year 2010———————————–2018 1. Chicago: 853,910————–1. Chicago: 899,980 2. Indianapolis: 482,195———2. Columbus: 486,431 3. Columbus: 470,971———–3. Austin: 470,620 4. Jacksonville, FL: 452,926—-4. Indianapolis: 465,466 5. Portland, OR: 417,876——–5. Portland: 457,042 6. Austin: 384,065—————6. Jacksonville: 455,487 7. Virginia Beach: 282,812——7. Omaha: 307,845 8. Las Vegas: 280,604———-8. Virginia Beach: 275,371 9. Omaha, NE: 277,606———9. Las Vegas: 272,870 10. San Jose, CA: 265,311——10. Kansas City: 269,854 11. Kansas City, MO: 247,473–11. San Jose: 253,571 12. Wichita, KS: 245,146——-12. Minneapolis: 252,327 13. Minneapolis: 242,848——13. Wichita: 242,671 14. Milwaukee: 221,514——–14. Lincoln: 227,215 15. Lincoln, NE: 216,076——-15. Milwaukee: 204,250 16. Pittsburgh: 203,622——–16. Pittsburgh: 195,468 17. Fort Wayne, IN: 179,646—17. Madison: 186,034 18. Madison, WI: 178,307——18. Fort Wayne: 173,088 19. Toledo: 177,341————–19. St. Paul: 159,782 20. Sacramento, CA: 165,610–20. Sacramento: 158,333 21. St. Paul, MN: 159,704——-21. Toledo: 157,967 22. Des Moines, IA: 145,937—22. Cincinnati: 150,693 23. Cincinnati: 143,120———23. Des Moines: 137,268 24. Cleveland: 137,977———24. St. Louis: 133,688 25. St. Louis: 134,146———–25. Cleveland: 131,010 26. Grand Rapids, MI: 104,636–26. Grand Rapids: 115,719 27. Providence, RI: 64,284——27. Detroit: 72,982 28. Detroit: 55,298————–28. Providence: 58,856
Previous peers, such as San Antonio, Charlotte and Orlando were removed as their metros are now larger than the 2.5 million comparison limit. Jacksonville, Florida entered the comparison with a metro population of just over 1.5 million in 2018. Smaller Ohio cities like Dayton, Akron, Canton and Youngstown, which are normally compared, did not have this data available.
Total Non-Hispanic White Change 2010-2018 1. Austin: +86,555 2. Chicago: +46,070 3. Portland: +39,166 4. Omaha: +30,239 5. Kansas City: +22,381 6. Detroit: +17,684 7. Columbus: +15,460 8. Lincoln: +11,139 9. Grand Rapids: +11,083 10. Minneapolis: +9,479 11. Madison: +7,727 12. Cincinnati: +7,573 13. Jacksonville: +2,561 14. St. Paul: +28 15. St. Louis: -458 16. Wichita: -2,475 17. Providence: -5,428 18. Fort Wayne: -6,558 19. Cleveland: -6,967 20. Sacramento: -7,277 21. Virginia Beach: -7,441 22. Las Vegas: -7,734 23. Pittsburgh: -8,154 24. Des Moines: -8,669 25. San Jose: -11,740 26. Indianapolis: -16,729 27. Milwaukee: -17,264 28. Toledo: -19,374
Non-Hispanic White % of Total Population by City in 2018 1. Lincoln: 79.1% 2. Madison: 72.1% 3. Portland: 70.0% 4. Omaha: 65.7% 5. Fort Wayne: 65.5% 6. Pittsburgh: 64.9% 7. Des Moines: 63.3% 8. Wichita: 62.3% 9. Virginia Beach: 61.2% 10. Minneapolis: 59.3% 11. Grand Rapids: 57.8% 12. Toledo: 57.5% 13. Kansas City: 54.9% 14. Columbus: 54.3% 15. Indianapolis: 53.9% 16. St. Paul: 51.9% 17. Jacksonville: 50.4% 18. Cincinnati: 49.8% 19. Austin: 48.8% 20. St. Louis: 44.2% 21. Las Vegas: 42.3% 22. Milwaukee: 34.5% 23. Cleveland: 34.1% 24. Chicago: 33.3% 25. Providence: 32.8% 26. Sacramento: 31.1% 27. San Jose: 24.6% 28. Detroit: 10.9%
Total Non-Hispanic Black Population by City by Year 2010————————————2018 1. Chicago: 895,294————1. Chicago: 784,266 2. Detroit: 587,707————–2. Detroit: 520,161 3. Jacksonville: 249,532——-3. Jacksonville: 274,290 4. Milwaukee: 230,473——–4. Columbus: 259,803 5. Indianapolis: 226,314——-5. Indianapolis: 251,958 6. Columbus: 216,486———6. Milwaukee: 222,619 7. Cleveland: 208,528———7. Cleveland: 178,909 8. St. Louis: 157,382———–8. Kansas City: 137,867 9. Kansas City: 138,461——-9. St. Louis: 137,087 10. Cincinnati: 131,909——-10. Cincinnati: 122,261 11. Virginia Beach: 79,583—11. Virginia Beach: 84,333 12. Toledo: 75,033————12. Minneapolis: 81,930 13. Pittsburgh: 71,539——-13. Austin: 78,354 14. Minneapolis: 63,749—–14. Toledo: 74,630 15. Sacramento: 61,976—–15. Pittsburgh: 68,637 16. Austin: 61,833————16. Las Vegas: 68,488 17. Las Vegas: 60,187——–17. Sacramento: 64,824 18. Omaha: 55,086———–18. Omaha: 56,503 19. Wichita: 42,662———-19. St. Paul: 44,572 20. St. Paul: 41,923———-20. Wichita: 42,874 21. Grand Rapids: 41,848—21. Fort Wayne: 40,640 22. Fort Wayne: 39,016—–22. Portland: 39,882 23. Portland: 37,355——–23. Grand Rapids: 35,264 24. San Jose: 29,831——–24. San Jose: 29,432 25. Des Moines: 19,962—-25. Providence: 26,594 26. Providence: 19,265—–26. Des Moines: 24,018 27. Madison: 17,560——–27. Madison: 20,276 28. Lincoln: 9,023———-28. Lincoln: 12,203
Total Non-Hispanic Black Change 2010-2018 1. Columbus: +43,317 2. Indianapolis: +25,644 3. Jacksonville: +24,758 4. Minneapolis: +18,181 5. Austin: +16,521 6. Las Vegas: +8,301 7. Providence: +7,329 8. Virginia Beach: +4,750 9. Des Moines: +4,056 10. Lincoln: +3,180 11. Sacramento: +2,848 12. Madison: +2,716 13. St. Paul: +2,649 14. Portland: +2,527 15. Fort Wayne: +1,624 16. Omaha: +1,417 17. Wichita: +212 18. San Jose: -399 19. Toledo: -403 20. Kansas City: -594 21. Pittsburgh: -2,902 22. Grand Rapids: -6,584 23. Milwaukee: -7,854 24. Cincinnati: -9,648 25. St. Louis: -20,295 26. Cleveland: -29,619 27. Detroit: -67,546 28. Chicago: -111,028
Non-Hispanic Black % of Total Population by City in 2018 1. Detroit: 77.3% 2. Cleveland: 46.6% 3. St. Louis: 45.3% 4. Cincinnati: 40.4% 5. Milwaukee: 37.7% 6. Jacksonville: 30.4% 7. Indianapolis: 29.2% 8. Columbus: 29.0% 9. Chicago: 29.0% 10. Kansas City: 28.0% 11. Toledo: 27.1% 12. Pittsburgh: 22.8% 13. Minneapolis: 19.3% 14. Virginia Beach: 18.7% 15. Grand Rapids: 17.6% 16. Fort Wayne: 15.4% 17. Providence: 14.8% 18. St. Paul: 14.5% 19. Sacramento: 12.8% 20. Omaha: 12.1% 21. Des Moines: 11.1% 22. Wichita: 11.0% 23. Las Vegas: 10.6% 24. Austin: 8.1% 25. Madison: 7.9% 26. Portland: 6.1% 27. Lincoln: 4.3% 28. San Jose: 2.9%
Total Non-Hispanic Asian Population by City by Year 2010——————————-2018 1. San Jose: 303,227————1. San Jose: 367,280 2. Chicago: 148,280————2. Chicago: 179,841 3. Sacramento: 84,556——–3. Sacramento: 97,192 4. Austin: 46,575—————4. Austin: 73,185 5. Portland: 43,185————5. St. Paul: 59,395 6. St. Paul: 41,989————–6. Portland: 57,526 7. Las Vegas: 37,406———-7. Columbus: 54,902 8. Columbus: 35,468———-8. Las Vegas: 46,422 9. Jacksonville: 33,663——–9. Jacksonville: 42,639 10. Virginia Beach: 27,303—10. Virginia Beach: 31,875 11. Milwaukee: 22,670——–11. Indianapolis: 31,777 12. Minneapolis: 21,426——12. Minneapolis: 26,768 13. Wichita: 19,420———-13. Milwaukee: 25,17 14. Indianapolis: 17,137——14. Madison: 23,594 15. Madison: 16,671———-15. Wichita: 17,410 16. Pittsburgh: 12,036——-16. Omaha: 17,185 17. Providence: 11,497——-17. Pittsburgh: 16,724 18. Lincoln: 10,452———–18. Des Moines: 15,057 19. Kansas City: 10,263—–19. Fort Wayne: 13,661 20. Des Moines: 8,867——20. Providence: 12,556 21. St. Louis: 8,717———–21. Lincoln: 12,494 22. Omaha: 8,397———–22. Kansas City: 12,130 23. Fort Wayne: 6,945—–23. St. Louis: 10,662 24. Detroit: 6,549———-24. Detroit: 10,597 25. Cincinnati: 5,938——25. Cleveland: 10,595 26. Cleveland: 5,392——26. Cincinnati: 6,999 27. Grand Rapids: 3,695–27. Grand Rapids: 4,431 28. Toledo: 3,125———-28. Toledo: 2,802
Total Non-Hispanic Asian Change 2010-2018 1. San Jose: +64,053 2. Chicago: +31,561 3. Austin: +26,610 4. Columbus: +19,434 5. St. Paul: +17,406 6. Indianapolis: +14,640 7. Portland: +14,341 8. Sacramento: +12,636 9. Las Vegas: +9,016 10. Jacksonville: +8,976 11. Omaha: +8,788 12. Madison: +6,923 13. Fort Wayne: +6,716 14. Des Moines: +6,190 15. Minneapolis: +5,342 16. Cleveland: +5,203 17. Pittsburgh: +4,688 18. Virginia Beach: +4,572 19. Detroit: +4,048 20. Milwaukee: +2,501 21. Lincoln: +2,042 22. St. Louis: +1,945 23. Kansas City: +1,867 24. Cincinnati: +1,061 25. Providence: +1,059 26. Grand Rapids: +736 27. Toledo: -323 28. Wichita: -2,010
Non-Hispanic Asian % of Total Population by City in 2018 1. San Jose: 35.7% 2. St. Paul: 19.3% 3. Sacramento: 19.1% 4. Madison: 9.1% 5. Portland: 8.8% 6. Austin: 7.6% 7. Las Vegas: 7.2% 8. Virginia Beach: 7.1% 9. Providence: 7.0% 10. Des Moines: 6.9% 11. Chicago: 6.7% 12. Minneapolis: 6.3% 13. Columbus: 6.1% 14. Pittsburgh: 5.6% 15. Fort Wayne: 5.2% 16. Jacksonville: 4.7% 17. Wichita: 4.5% 18. Lincoln: 4.4% 19. Milwaukee: 4.3% 20. Indianapolis: 3.7% 21. Omaha: 3.7% 22. St. Louis: 3.5% 23. Cleveland: 2.8% 24. Kansas City: 2.5% 25. Cincinnati: 2.3% 26. Grand Rapids: 2.2% 27. Detroit: 1.6% 28. Toledo: 1.0%
Total Hispanic Population by City By Year 2010———————————2018 1. Chicago: 763,968————-1. Chicago: 776,661 2. San Jose: 318,389————2. San Jose: 333,819 3. Austin: 288,130—————3. Austin: 314,949 4. Las Vegas: 181,923———–4. Las Vegas: 222,860 5. Sacramento: 124,461———5. Sacramento: 148,343 6. Milwaukee: 104,619———-6. Milwaukee: 119,876 7. Indianapolis: 78,467———-7. Jacksonville: 94,158 8. Providence: 76,645———-8. Indianapolis: 88,022 9. Jacksonville: 64,081———-9. Providence: 75,177 10. Wichita: 59,823————-10. Wichita: 70,564 11. Portland: 58,986————11. Omaha: 68,747 12. Omaha: 53,661————–12. Portland: 60,760 13. Kansas City: 49,800——–13. Columbus: 53,935 14. Detroit : 45,580————-14. Detroit: 52,718 15. Columbus: 43,276———-15. Kansas City: 52,638 16. Cleveland: 36,067———-16. Cleveland: 47,144 17. Minneapolis: 34,504——-17. Minneapolis: 40,912 18. Grand Rapids: 30,659—–18. Virginia Beach: 37,365 19. Virginia Beach: 29,206—-19. Grand Rapids: 36,469 20. St. Paul: 28,725————20. Des Moines: 31,706 21. Des Moines: 23,832——-21. St. Paul: 26,081 22. Toledo: 21,346————-22. Toledo: 24,625 23. Fort Wayne: 19,576——-23. Fort Wayne: 24,623 24. Lincoln: 16,007————24. Lincoln: 22,339 25. Madison: 14,062———-25. Madison: 18,867 26. St. Louis: 11,207———–26. St. Louis: 12,509 27. Cincinnati: 8,710———-27. Cincinnati: 10,773 28. Pittsburgh: 7,282———28. Pittsburgh: 10,180
Total Hispanic Population Change 2010-2018 1. Las Vegas: +40,937 2. Jacksonville: +30,077 3. Austin: +26,819 4. Sacramento: +23,882 5. San Jose: +15,430 6. Milwaukee: +15,257 7. Omaha: +15,086 8. Chicago: +12,693 9. Cleveland: +11,077 10. Wichita: +10,741 11. Columbus: +10,659 12. Indianapolis: +9,555 13. Virginia Beach: +8,159 14. Des Moines: +7,874 15. Detroit: +7,138 16. Minneapolis: +6,408 17. Lincoln: +6,332 18. Grand Rapids: +5,810 19. Fort Wayne: +5,047 20. Madison: +4,805 21. Toledo: +3,279 22. Pittsburgh: +2,898 23. Kansas City: +2,838 24. Cincinnati: +2,063 25. Portland: +1,774 26. St. Louis: +1,302 27. Providence: -1,468 28. St. Paul: -2,644
Hispanic % of Total Population by City in 2018 1. Providence: 41.9% 2. Las Vegas: 34.6% 3. Austin: 32.7% 4. San Jose: 32.4% 5. Sacramento: 29.2% 6. Chicago: 28.7% 7. Milwaukee: 20.3% 8. Grand Rapids: 18.2% 9. Wichita: 18.1% 10. Omaha: 14.7% 11. Des Moines: 14.6% 12. Cleveland: 12.3% 13. Kansas City: 10.7% 14. Jacksonville: 10.4% 15. Indianapolis: 10.2% 16. Minneapolis: 9.6% 17. Portland: 9.3% 18. Fort Wayne: 9.3% 19. Toledo: 9.0% 20. St. Paul: 8.5% 21. Virginia Beach: 8.3% 22. Detroit: 7.8% 23. Lincoln: 7.8% 24. Madison: 7.3% 25. Columbus: 6.0% 26. St. Louis: 4.1% 27. Cincinnati: 3.6% 28. Pittsburgh: 3.4%
Total Non-Hispanic Other Population by City by Year 2010——————————–2018 1. Chicago: 37,379————–1. Chicago: 65,240 2. San Jose: 32,439————-2. San Jose: 46,017 3. Sacramento: 30,900——–3. Columbus: 40,806 4. Portland: 28,027————-4. Sacramento: 39,825 5. Las Vegas: 24,521———–5. Portland: 37,363 6. Columbus: 23,738———–6. Jacksonville: 37,322 7. Jacksonville: 23,114———-7. Las Vegas: 34,024 8. Minneapolis: 20,753———8. Austin: 27,135 9. Virginia Beach: 20,268——9. Indianapolis: 26,908 10. Indianapolis: 20,086——10. Minneapolis: 23,458 11. Detroit: 16,776————-11. Virginia Beach: 21,245 12. Milwaukee: 16,311——– 12. Kansas City: 19,320 13. Wichita: 16,091————13. Milwaukee: 19,286 14. Omaha: 15,519————14. Omaha: 17,987 15. Austin: 14,915————-15. St. Paul: 17,871 16. Kansas City: 14,668——16. Detroit: 16,223 17. St. Paul: 13,098———–17. Cleveland: 16,123 18. Pittsburgh: 11,280——-18. Wichita: 15,740 19. Toledo: 10,134————19. Toledo: 14,949 20. Fort Wayne: 8,513——-20. Lincoln: 13,148 21. Cleveland: 8,276———21. Fort Wayne: 12,158 22. St. Louis: 7,704———-22. Cincinnati: 11,889 23. Lincoln: 7,483———–23. Pittsburgh: 10,029 24. Grand Rapids: 7,376—24. Madison: 9,263 25. Cincinnati: 7,230——-25. Des Moines: 8,944 26. Madison: 7,177———26. St. Louis: 8,892 27. Providence: 6,471——27: Grand Rapids: 8,347 28. Des Moines: 5,598—–28. Providence: 6,152
Total Non-Hispanic Other Population Change 2010-2018 1. Chicago: +27,861 2. Columbus; +17,068 3. Jacksonville: +14,208 4. San Jose: +13,578 5. Austin: +12,220 6. Las Vegas: +9,503 7. Portland: +9,336 8. Sacramento: +8,925 9. Cleveland: +7.847 10. Indianapolis: +6,822 11. Lincoln: +5,665 12. Toledo: +4,815 13. St. Paul: +4,773 14. Cincinnati: +4,659 15. Kansas City: +4,652 16. Fort Wayne: +3,645 17. Des Moines: +3,346 18. Milwaukee: +2,975 19. Minneapolis: +2,705 20. Omaha: +2,468 21. Madison: +2,086 22. St. Louis: 1,188 23. Virginia Beach: +977 24. Grand Rapids: +971 25. Providence: -319 26. Wichita: -351 27. Detroit: -553 28. Pittsburgh: -1251
Non-Hispanic Other % of Total Population by City in 2018 1. Sacramento: 7.8% 2. St. Paul: 5.8% 3. Portland: 5.7% 4. Minneapolis: 5.5% 5. Toledo: 5.4% 6. Las Vegas: 5.3% 7. Virginia Beach: 4.7% 8. Fort Wayne: 4.6% 9. Lincoln: 4.6% 10. Columbus: 4.6% 11. San Jose: 4.5% 12. Cleveland: 4.2% 13. Grand Rapids: 4.2% 14. Jacksonville: 4.1% 15. Des Moines: 4.1% 16. Wichita: 4.0% 17. Cincinnati: 3.9% 18. Kansas City: 3.9% 19. Omaha: 3.8% 20. Madison: 3.6% 21. Providence: 3.4% 22. Pittsburgh: 3.3% 23. Milwaukee: 3.3% 24. Indianapolis: 3.1% 25. St. Louis: 2.9% 26. Austin: 2.8% 27. Chicago: 2.4% 28. Detroit: 2.4%
Now that we can see all the numbers, what is the 2018 ranking of most to least racially diverse? To find out, I assigned points by the ranking of % of population, so #1 of a particular ranking would get 1 point, the next 2 points and so on. The cities with the fewest points are the most diverse. Here are the rankings for both 2010 and 2018.
Most to Least Diverse by Year and Total Points 2010——————————–2018 1. Portland: 50—————–1. Portland: 54 2. Sacramento: 52————2. Sacramento: 54 3. St. Paul: 53—————–3. Minneapolis: 55 4. Minneapolis: 54———–4. St. Paul: 58 5. Virginia Beach: 55——–5. Las Vegas: 59 6. Wichita: 57—————-6. Virginia Beach: 59 7. Las Vegas: 60————-7. Fort Wayne: 62 8. Providence: 61————8. Des Moines: 64 9. Omaha: 66—————-9. Jacksonville: 67 10. Grand Rapids: 69——-10. Columbus: 70 11. Des Moines: 71———-11. San Jose: 71 12. Madison: 72————-12. Cleveland: 72 13. San Jose: 72————-13. Wichita: 72 14. Fort Wayne: 73———14. Grand Rapids: 73 15. Kansas City: 73———15. Providence: 73 16. Milwaukee: 73———-16. Omaha: 74 17. Pittsburgh: 74———-17. Madison: 75 18. Jacksonville: 75——–18. Toledo: 75 19. Chicago: 76————-19. Milwaukee: 76 20. Columbus: 77———-20. Chicago: 77 21. Austin: 80—————21. Austin: 78 22. Indianapolis: 81——–22. Kansas City: 78 23. Toledo: 81————–23. Lincoln: 78 24. Lincoln: 85————-24. Indianapolis: 81 25. St. Louis: 94———–25. Pittsburgh: 82 26. Cleveland: 95———-26. Cincinnati: 91 27. Cincinnati: 97———-27. St. Louis: 96 28. Detroit: 104————28. Detroit: 106
Columbus had one of the fastest improvements of its diversity, moving up 10 spots from 20th to 10th.
This weekly update includes the following: -The Completed Development page has received most of the attention. Most projects finished since 2010 have been restored, and I am now working on adding projects for years going all the way back to the 19th Century. -All other development pages saw some limited updates. –Rail Transportation History continues to expand.
Coming soon: -I have been putting together some data for several updates to the demographics pages, particularly related to immigration and crime data. -A restoration of the Census Tract Maps page is in the works, though not this coming week. -Monthly weather stats for another month should arrive this week. -At least one new non-update post is coming this week. -There will be a focus this week in particular to restore the Under Construction and Proposed Development pages.