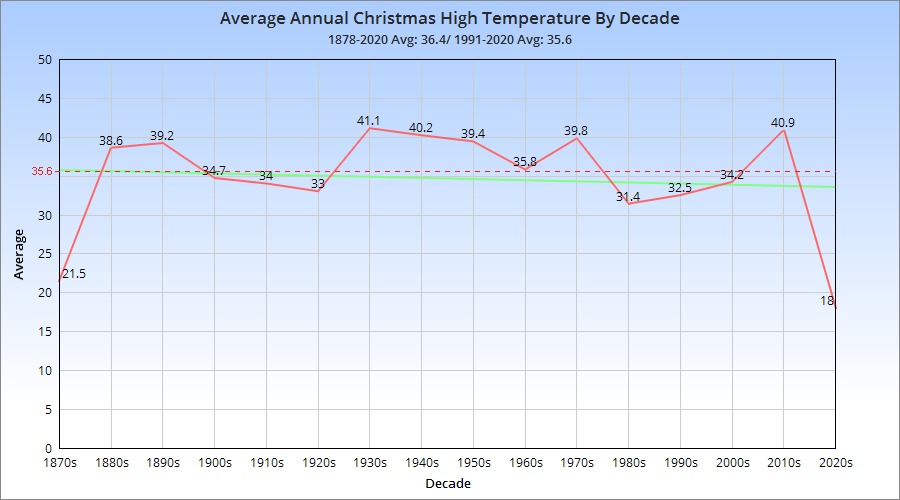
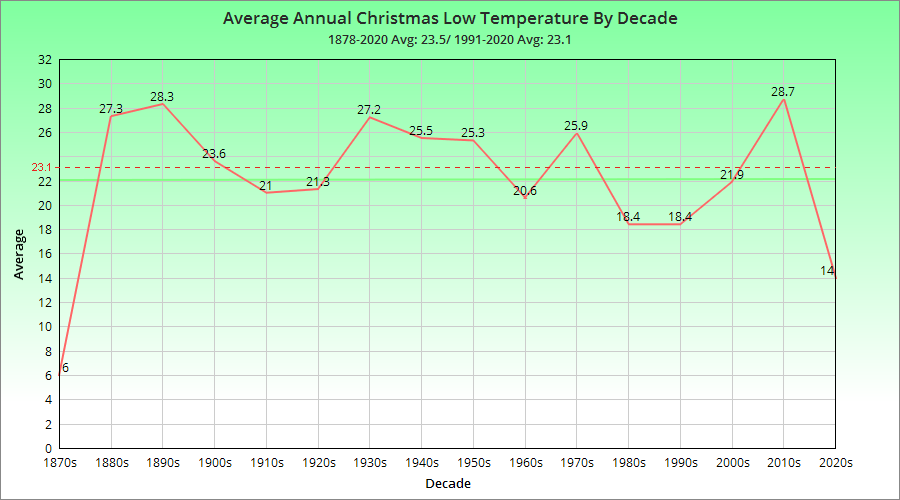
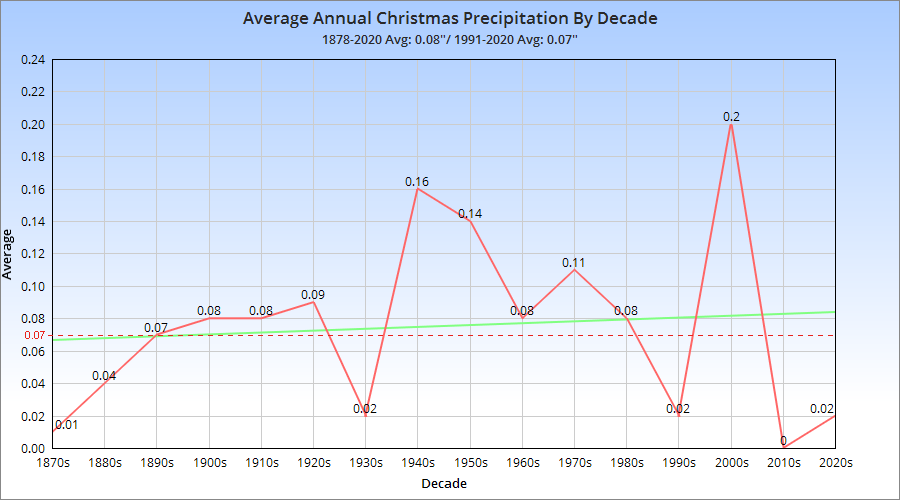
Columbus, Ohio weather is has varied wildly over the 143 years of records, and the holidays are no different. It’s seen record warmth into the 60s, and record cold well below zero, as well as heavy snow and driving rainstorms. The records below break down Columbus’ historic Christmas Day climatology.
Thanksgiving can be a relatively volatile holiday. Sitting on the edge of fall and winter, it can be warm and sunny one year, and then freezing cold with snow falling the next. Here we look back at the averages and the greatest extremes the holiday has ever seen.
Today’s Spring 2021 weather review shows that the season represented a significant departure from other recent years in that it was drier than average. In fact, there were fewer measurable precipitation days during the season than any other spring since 1879. Snowfall was also well below normal aside from a rare late April event. Temperatures swung wildly, with highs generally well above normal and lows slightly below normal.
1991-2020 Spring Normals Average High: 63.1 Average Low: 42.2 Mean: 52.7 Precipitation: 11.46″ Snowfall: 4.6″
2021 March-May Average High: 65.2 9th Warmest Average Low: 42.0 Tied for 29th Warmest Mean: 53.6 +0.9 20th Warmest Precipitation: 9.59″ 62nd Driest Snowfall: 1.2″ Ties for 12th Least Snowiest Average Daily Snow Depth: 0.0″ Largest Snowstorm: 1.2″ on April 21st # of 32 or Below Highs: 0 Tied for 1st Fewest # of 32 or Below Lows: 20 Tied for 12th Fewest # of 80 or Above Highs: 14 Tied for 12th Most # of 70 or Above Lows: 0 Tied for 1st Fewest # of Measurable Precipitation Days: 27 1st Fewest on Record # of Measurable Snowfall Days: 1 Tied for 2nd Fewest
Average High By Month March 2021: 59.0 7th Warmest April 2021: 64.4 Tied for 29th Warmest May 2021: 72.1 Tied for 44th Coldest
Average Low By Month March 2021: 34.7 27th Warmest April 2021: 42.0 Tied for 35th Warmest May 2021: 49.2 27th Coldest
Mean By Month March 2021: 46.9 12th Warmest April 2021: 53.2 Tied for 28th Warmest May 2021: 60.6 Tied for 32nd Coldest
Precipitation By Month March 2021: 2.85″ 54th Driest April 2021: 3.28″ 60th Wettest May 2021: 3.46″ 61st Driest
Snowfall By Month March 2021: 0.0″ Tied for Least Snowy April 2021: 1.2″ 14th Least Snowy May 2021: 0.0″ Tied for Least Snowy- Only a handful of years have had a trace or more of snow in May.
Average Snow Depth By Month March 2021: 0.0″ April 2021: 0.0″ May 2021: 0.0″
Maximum High By Month March 2021: 75 on the 24th April 2021: 83 on the 27th May 2021: 91 on the 25th
Minimum High By Month March 2021: 40 on the 15th April 2021: 37 o the 1st Mays 2021: 51 on the 9th
Maximum Low By Month March 2021: 56 on the 11th April 2021: 65 on the 28th May 2021: 69 on the 24th
Maximum Low Records -The 65 on April 28th tied the record for the date with 1914.
Minimum Low By Month March 2021: 19 on the 5th April 2021: 21 on the 2nd May 2021: 34 on the 1st
Highest Daily Precipitation By Month March 2021: 1.12″ on the 18th April 2021: 1.88″ on the 29th May 2021: 1.43″ on the 9th
Precipitation Records -The 1.88″ on April 29th was a record for the date, beating the old record of 1.82″ set in 1996. -The 1.43″ on May 9th was a record for the date, beating the old record of 1.12″ set in 1909.
Highest Daily Snowfall By Month March 2021: 0.0″ April 2021: 1.2″ on the 21st May 2021: 0.0″
Deepest Snow Depth By Month March 2021: 0.0″ April 2021: 1″ on the 21st May 2021: 0.0″
New Years weather has historically been surprisingly tranquil, with some exceptions. Highs have generally been in the 30s or 40s and significant snowfalls have been rare. The records for New Year’s climatology run back to 1878.
New Year’s Eve Normals High: 37 Low: 24 Mean: 30 Precipitation: 0.09″ Snowfall: 0.2″
New Year’s Day Normals High: 37 Low: 23 Mean: 30 Precipitation: 0.10″ Snowfall: 0.3″
White Christmases are pretty rare in the Columbus, Ohio area. An inch or more has fallen on the date only 11 times since 1878. An official White Christmas, however, is defined as having 1″ or more snow on the ground, not necessarily falling on the day itself. That has only happened 21 times since 1939, with only 4 of those times coming since 2000. So these white holidays are relatively rare.
A white Christmas Eve has been even less likely. 1″ or more has been on the ground on December 24th just 16 times since 1939.
Accumulating snow is not all that rare for Christmas Eve. It’s occurred 31 times since 1878, or about once every 4-5 years. So not exactly an annual occurrence, but it happens at least a few times per decade. However, most of those instances were less than 1″ of snow- in fact, 27 of the 31 times were less than 1″. That means 1″ or more of snow has fallen on Christmas Eve just 4 times in the last 142 years, a very rare event indeed.
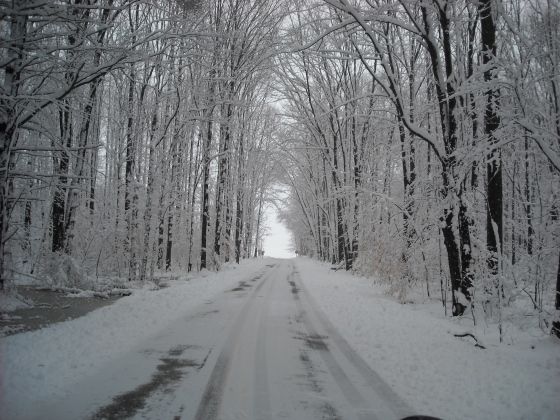
The largest Christmas Eve snowfall until this year was just 2.7″ in 1980. This year’s Christmas Eve snowstorm brought anywhere from 2″-8″ across the Columbus metro area. In Franklin County, 3″-5″ was common. Officially, the airport received 3.4″ on the 24th, which counts as the largest Christmas Eve snowstorm in Columbus history. Snow was still falling lightly Christmas day, so a little more could be added to the final storm total, but another official White Christmas has gone into the books.