Independence Day Climatology


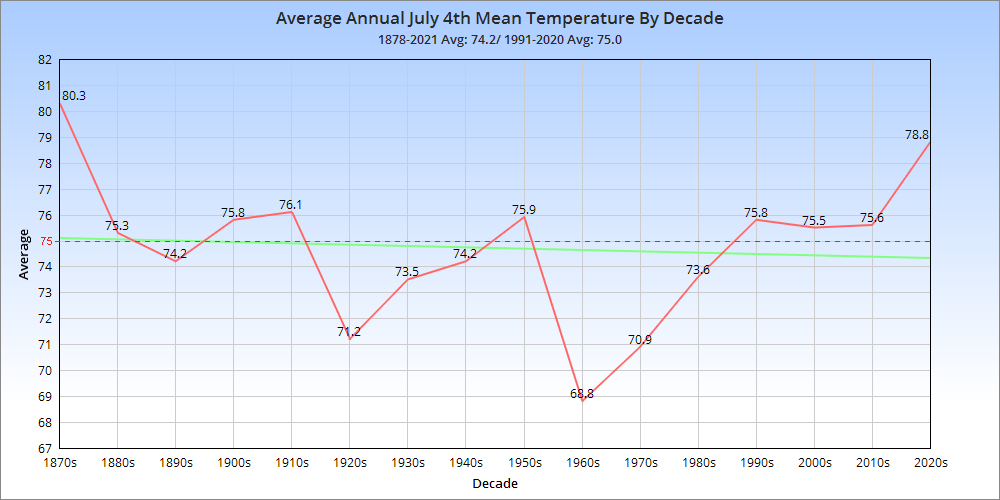
Independence Day climatology is available going back to 1878. Here’s a breakdown through 2021.

July 4th Normals 1878-2021
High: 84.4
Low: 64
Mean: 74
Precipitation: 0.12″

July 4th Normals 1991-2020
High: 85
Low: 65
Mean: 75
Precipitation: 0.15″


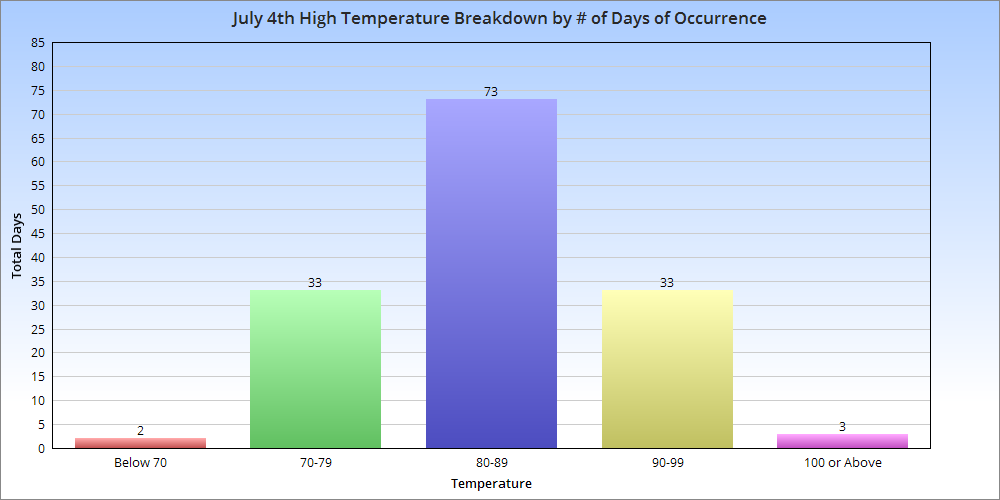
Top 10 Coldest July 4th Highs
1. 1882, 1922: 69
2. 1924, 1967, 1978, 2008: 71
3. 1909, 1927, 1972, 1979, 2016: 72
4. 1920: 73
5. 1937, 1989: 74
6. 1892, 1910, 1940, 1941, 1960, 1997, 2009: 76
7. 1917, 1964, 1968, 1970, 1976, 2013: 77
8. 1891, 1961, 2014: 78
9. 1889, 1933, 1996, 2001, 2015: 79
10. 1898, 1906, 1926, 1938, 1962, 1992; 80
Independence Day climatology average high

Top 10 Warmest July 4th Highs
1. 1911: 104
2. 1897: 102
3. 2012: 100
4. 1919: 97
5. 1900, 1921, 1949, 2002: 96
6. 1990, 1999: 95
7. 1903, 1948, 2020: 94
8. 1881, 1883, 1899, 1918, 1958, 1988, 2018: 93
9. 1913, 1993, 2003: 92
10. 1880, 1901, 1902, 1931, 1944, 1974, 2010: 91

Independence day climatology high temperature days of occurrence

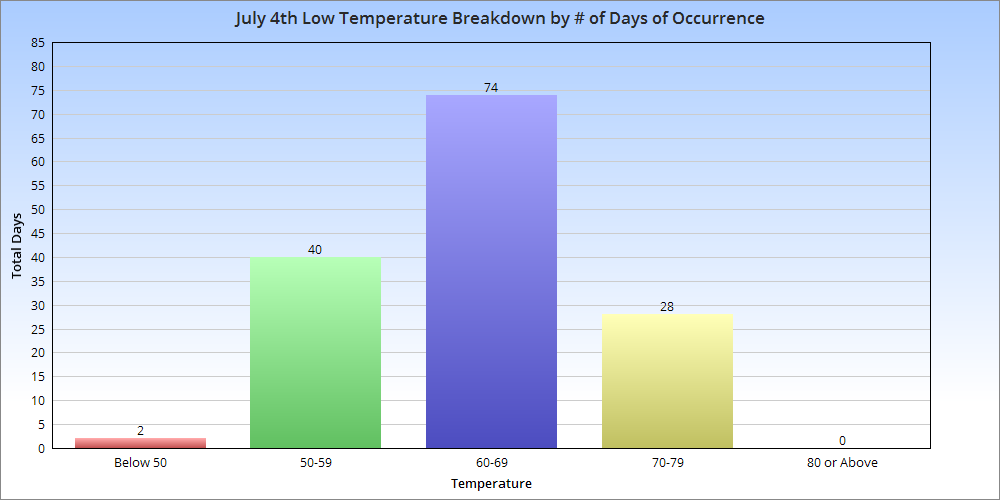
Top 10 Coldest July 4th Lows
1. 1968: 47
2. 1963: 49
3. 1996: 50
4. 1986: 51
5. 1927, 1940: 52
6. 1960, 1961, 1965, 1972: 53
7. 1892, 1909, 1924, 1930, 1979: 54
8. 1895, 1907: 55
9. 1891, 1915, 1922, 1976, 1992: 56
10. 1953, 1964, 1967, 1988, 2014: 57
Independence day climatology average low

Top 10 Warmest July 4th Lows
1. 1911: 79
2. 1897, 1900, 1999: 75
3. 1879, 1921: 74
4. 1883, 1902, 2012, 2018: 73
5. 1899, 1919, 1991, 2002, 2004; 72
6. 1884, 1903, 1913, 1943, 1974, 2005, 2013: 71
7. 1888, 1896, 1901, 1980, 2003, 2011: 70
8. 1878, 1905, 1908, 1935, 1949, 1957, 1966, 1983, 1987, 2000, 2006: 69
9. 1881, 1887, 1894, 1936, 1954, 1973, 1984, 1989, 1990, 1993, 1995, 2020: 68
10. 1912, 1928, 1934, 1939, 1952, 1956, 1969, 1975, 1998, 2017: 67

Independence day climatology low temperature by occurrence

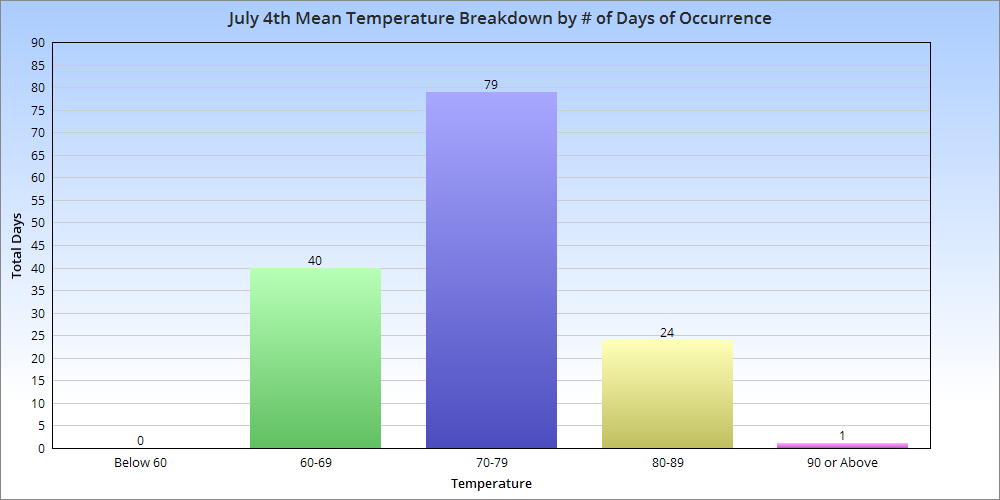
Top 10 Coldest July 4th Means
1. 1927, 1968: 62.0
2. 1922, 1924, 1972: 62.5
3. 1909, 1979: 63.0
4. 1882: 63.5
5. 1940, 1967: 64.0
6. 1960, 1996: 64.5
7. 1892, 1963: 65.0
8. 1961: 65.5
9. 1920: 66.0
10. 1976, 1986, 2008: 66.5
Independence day climatology average mean

Top 10 Warmest July 4th Means
1. 1911: 91.5
2. 1897: 88.5
3. 2012: 86.5
4. 1900: 85.5
5. 1921, 1999: 85.0
6. 1919: 84.5
7. 2002: 84.0
8. 1883, 2018: 83.0
9. 1899, 1903, 1949: 82.5
10. 1902: 82.0

Top 10 Wettest July 4ths
1. 1984: 1.38″
2. 1935: 1.04″
3. 1915: 0.86″
4. 1932: 0.84″
5. 1957: 0.66″
6. 2008: 0.61″
7. 1939: 0.60″
8. 2003: 0.59″
9. 1926: 0.58″
10. 2006: 0.56″
Independence day climatology average precipitation

Independence day climatology precipitation occurrence

The July Weather Records provides additional detailed information on the rest of the month.


Christmas Day Climatology


Christmas Day climatology Columbus, Ohio

Columbus, Ohio weather is has varied wildly over the 143 years of records, and the holidays are no different. It’s seen record warmth into the 60s, and record cold well below zero, as well as heavy snow and driving rainstorms. The records below break down Columbus’ historic Christmas Day climatology.

Normals 1991-2020
High: 35.6
Low: 23.1
Mean: 26.8
Precipitation: 0.10″
Snowfall: 0.1″

1878-2020 Averages
High: 36.4
Low: 23.5
Mean: 30.1
Precipitation: 0.08″
Snowfall: 0.3″

First, let’s take a look at the temperature breakdowns for the holiday.

Top 10 Coldest Highs
1. 1983: 1
2. 1878: 10
3. 1924: 11
4. 1980: 15
5. 1902: 16
6. 1985: 17
7. 2020: 18
8. 1884, 2000: 19
9. 1899, 1906, 1914:20
10. 1950, 1968: 22

Top 10 Coldest Lows
1. 1983: -12
2. 1980: -5
3. 1935: -4
4. 1924: -3
5. 1878: -2
6. 2004: -1
7. 1985: 1
8. 2000: 2
9. 1884: 4
10. 1914, 1999: 7

Top 10 Warmest Highs
1. 1893: 64
2. 1982: 63
3. 1932, 1940: 62
4. 1889: 60
5. 1964: 58
6. 1895, 1955: 57
7. 2019: 56
8. 1891: 55
9. 1936, 2015: 53
10. 1888, 1915, 1987: 52

Top 10 Warmest Lows
1. 1889, 1982: 55
2. 1895: 52
3. 1893: 49
4. 1891: 45
5. 2015: 43
6. 1932, 1940: 40
7. 1888, 1964, 1973: 39
8. 1987: 38
9. 1922, 1941, 2009, 2016: 37
10. 1936, 1972: 36

Number of Christmases with High Temperature
Less than 10: 1
10-19: 8
20-29: 24
30-39: 54
40-49: 36
50-59: 12
60 or Higher: 5

Number of Christmases with Low Temperature
Less than 0: 6
0-9: 7
10-19: 36
20-29: 47
30-39: 38
40-49: 5
50 or Higher: 4


Now let’s example precipitation and snowfall records.

Top 10 Wettest
1. 2009: 0.79″
2. 1944: 0.77″
3. 1926: 0.69″
4. 1951: 0.58″
5. 2006: 0.57″
6. 1945: 0.54″
7. 1957: 0.52″
8. 1987, 2005: 0.51″
9. 1915: 0.48″
10. 1909: 0.47″

Number of Christmases with Precipitation Amount
0.00″: 46
Trace: 27
0.01″-0.24″: 55
0.25″-0.49″: 6
0.50″-0.74″: 7
0.75″-0.99″: 2
1.00″ or More: 0

Top 10 Snowiest
1. 1890: 7.0″
2. 1909: 5.7″
3. 1950: 3.0″
4. 1917: 2.5″
5. 1969: 2.3″
6. 1884: 2.2″
7. 1976: 1.9″
8. 1880: 1.8″
9. 1935: 1.3″
10. 1944: 1.2″

Most Snow on the Ground (Since 1940)
1. 1960: 9″
2. 1961, 1963, 1989, 1995: 4″
3. 1969, 1980, 2004: 3″
4. 1947, 1950, 2000: 2″
5. 1944, 1945, 1951, 1956, 1962, 1990, 1992, 1993, 2010, 2017: 1″

Number of Christmases with Snowfall Amount
0.0″: 75
Trace: 23
0.1″-0.4″: 20
0.5″-0.9″: 9
1″-2.9″: 7
3″ or More: 3