New Years weather has historically been surprisingly tranquil, with some exceptions. Highs have generally been in the 30s or 40s and significant snowfalls have been rare. The records for New Year’s climatology run back to 1878.
New Year’s Eve Normals
New Year’s Day Normals
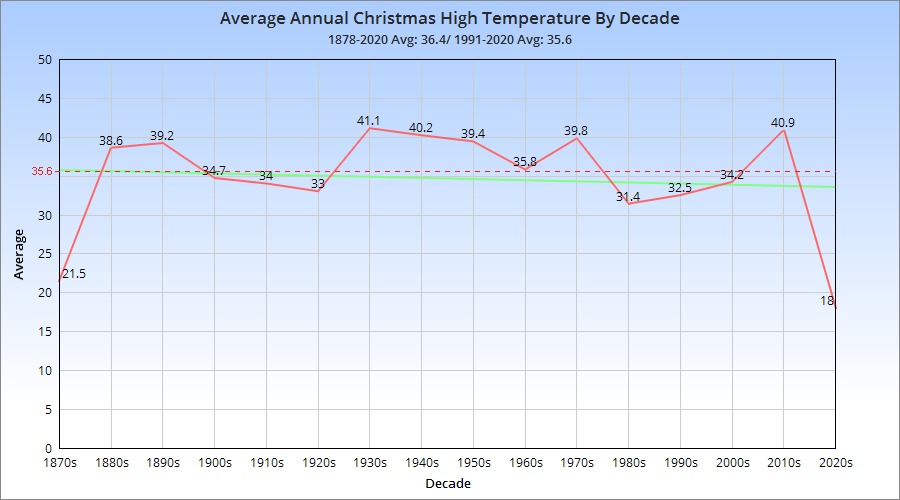
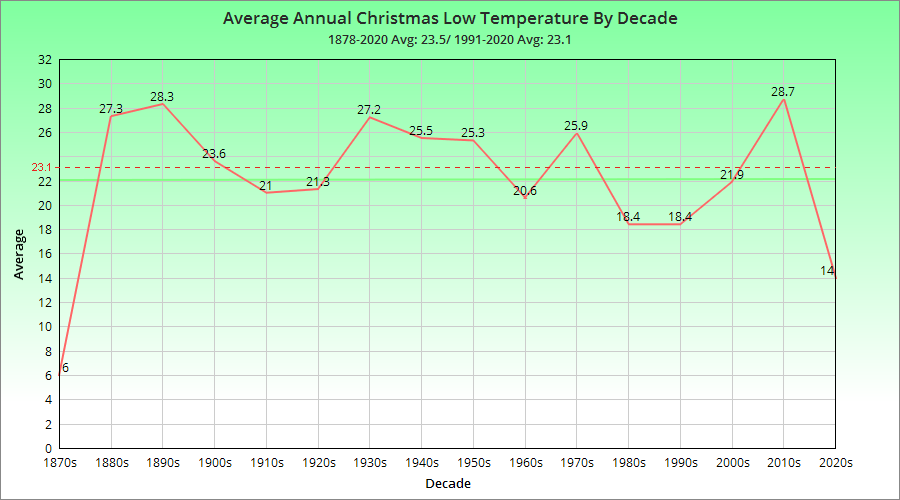
Temperature Records
Top 10 Coldest New Year’s Eve Highs 1. 1880: 102. 1976: 133. 1899: 164. 1917, 1962: 175. 2017: 196. 1894, 1998: 237. 1881, 1963, 1983, 2001: 248. 1914, 1961, 1997: 259. 1939, 1946, 2014: 2610. 1935: 27
Top 10 Coldest New Year’s Day Highs 1. 1928: 82. 1968: 103. 2018: 114. 1977: 125. 1900: 166. 1969: 177. 1898, 1918: 188. 1940: 199. 1999: 2010. 1881: 21
Top 10 Coldest New Year’s Eve Lows 1. 1976: -52. 1880: -33. 1899, 1963: 14. 1961, 1962, 2017: 25. 1983: 36. 1935, 1939: 67. 1902, 1917: 78. 1878, 1927, 1968: 89. 1960, 1967: 1010. 1914, 2000: 11
Top 10 Coldest New Year’s Day Lows 1. 1968: -62. 2018: -23. 1928: -14. 1881: 05. 1977: 16. 1945: 27. 1940: 38. 1898, 1918, 1963: 49. 1900, 1969: 510. 20001: 6
Top 10 Coldest New Year’s Eve Means 1. 1880: 3.52. 1976: 43. 1899: 8.54. 1962: 9.55. 2017: 10.56. 1917: 127. 1963: 12.58. 1961, 1983: 13.59. 1939: 1610. 1935: 16.5
Top 10 Coldest New Year’s Day Means 1. 1968: 22. 1928: 3.53. 2018: 4.54. 1977: 6.55. 1881, 1900: 10.56. 1898, 1918, 1940, 1969: 117. 1963, 1999: 13.58. 1887: 159. 2001: 1610. 1974: 16.5
Top 10 Warmest New Year’s Eve Highs 1. 1951: 682. 1965: 633. 2010: 624. 2006, 2018: 615. 1992: 606. 1884, 1978, 2022: 597. 1972, 2021: 588. 1923, 1936: 579. 1906, 1933, 2004: 5410. 1896, 1984, 2002: 53
Top 10 Warmest New Year’s Day Highs 1. 1952: 672. 1985: 653. 1890: 624. 1897: 615. 1930: 606. 1916, 1921, 1979, 2022: 597. 2011, 2019: 588. 1955: 579. 1905, 1934, 1948: 5610. 1892, 1919, 2012: 55
Top 10 Warmest New Year’s Eve Lows 1. 1965: 522. 2004: 503. 2006, 2010: 454. 1951: 445. 1918, 1978: 436. 2021: 427. 1937, 1947, 2002: 418. 1896, 1933, 2011, 2022: 399. 1906, 1929, 1931, 1972: 3710. 1995, 2018: 36
Top 10 Warmest New Year’s Day Lows 1. 1930: 472. 2005: 463. 1892: 434. 1891: 425. 1916, 1921, 1950, 1966, 2022: 416. 1897, 1905, 1932, 2019: 397. 1941, 1942, 1952: 388. 1890, 1907, 1996, 2007: 369. 1948, 1959: 3510. 1886, 1943, 1967, 1992, 1997, 2023: 34
Top 10 Warmest New Year’s Eve Means 1. 1965: 57.52. 1951: 563. 2010: 53.54. 2006: 535. 2004: 526. 1978: 517. 2021: 508. 2022: 499. 2018: 48.510. 1972: 47.5
Top 10 Warmest New Year’s Day Means 1. 1930: 53.52. 1952: 52.53. 1897, 1916, 1921, 2022: 504. 1890, 1892, 1985, 2005: 495. 2019: 48.56. 1891: 487. 1905, 1950: 47.58. 1966: 46.59. 1942: 4610. 1948: 45.5
New Year’s Eve High Temperatures by Occurrence since 1878
New Year’s Day High Temperatures by Occurrence since 1878
New Year’s Eve Low Temperatures by Occurrence since 1878
New Year’s Day Low Temperatures by Occurrence since 1878
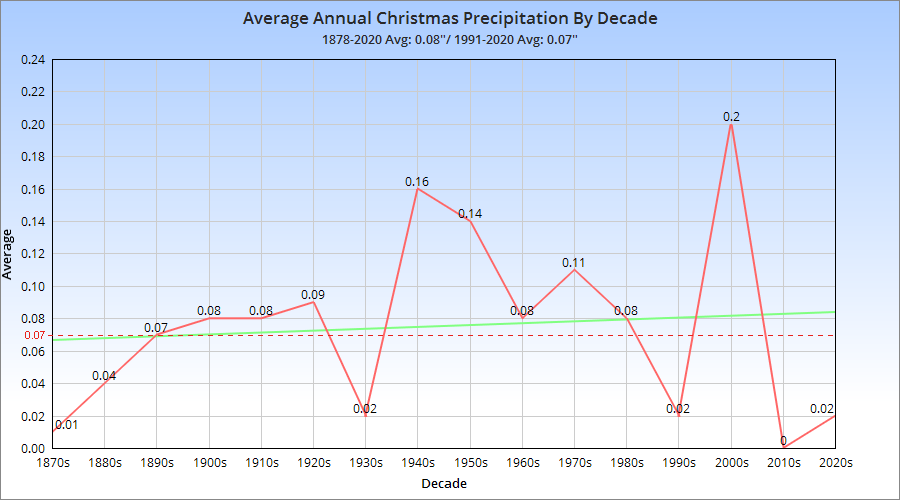
Precipitation Records
Top 10 Wettest New Year’s Eves 1. 2018: 1.01″2. 1887: 0.89″3. 1886: 0.76″4. 1879: 0.74″5. 1944: 0.71″6. 1978: 0.67″7. 1927: 0.49″8. 1974: 0.47″9. 1897, 1989, 2006: 0.46″10. 2022: 0.44″
Top 10 Wettest New Year’s Days 1. 2022: 1.34″2. 1948: 1.28″3. 2021: 1.04″4. 1916: 1.02″5. 1979: 0.89″6. 1919: 0.71″7. 1959: 0.62″8. 1893: 0.60″9. 2003: 0.54″10. 1964: 0.50″
New Year’s Eve Precipitation by Amount Occurrence since 1878
New Year’s Day Precipitation by Amount Occurrence since 1878
Top 10 Snowiest New Year’s Eves 1. 1897: 3.6″2. 1892: 3.0″3. 1960: 2.6″4. 1967: 2.4″5. 2009: 2.1″6. 1980: 2.0″7. 1973: 1.9″8. 1998, 2012: 1.7″9. 1887: 1.6″10. 1961: 0.9″
Top 10 Snowiest New Year’s Days 1. 1964: 5.2″2. 1883: 3.9″3. 1887: 2.5″4. 1970: 2.2″5. 1884: 1.8″6. 1945: 1.7″7. 1961: 1.6″8. 1928: 1.3″9. 1918: 1.2″10. 1981: 1.1″
Top 10 Snowiest New Year’s Holidays (Both December 31st and January 1st Combined) 1. 1963-1964: 5.2″2. 1960-1961: 4.2″3. 1892-1893: 4.0″4. 1882-1883: 3.9″5. 1897-1898: 3.6″6. 1980-1981: 3.1″7. 2009-2010: 2.7″8. 1969-1970: 2.6″9. 1886-1887: 2.5″10. 1967-1968: 2.4″
New Year’s Eve Snowfall by Amount Occurrence since 1878
New Year’s Day Snowfall by Amount Occurrence since 1878
Top 5 Deepest New Year’s Eve Snow Depths since 1940 1. 2012: 7″2. 1973, 2000: 4″3. 1960, 1976, 2017: 3″4. 1961, 1995, 1997, 2009: 2″5. 1967, 1969, 1993, 1998, 2020: 1″
Top 5 Deepest New Year’s Day Snow Depths since 1940 1. 2013: 9″2. 1961: 6″3. 2001: 4″4. 1974, 1977: 3″5. 1940, 1945, 1962, 1968, 1981, 2018: 2″
For more local weather records, visit:Weather History Wilmington National Weather Service