The December 2007 Clipper and Cold


Forecasts on December 4th, 2007 called for a weak, fast-moving clipper to affect much of the Midwest, Great Lakes, Ohio Valley and east to the Mid-Atlantic coast. Most forecasts in Ohio had the area south of I-80 down to just north of the Ohio River getting 1-3″ of snowfall, with a potential max of 2-4″ in south-central Ohio from Dayton to Chillicothe.

The forecast for Columbus on December 4th, 2007 from the Wilmington National Weather Service:

OHZ045-046-054>056-065-051015-
UNION OH-DELAWARE-MADISON-FRANKLIN OH-LICKING-FAIRFIELD-
INCLUDING THE CITIES OF…MARYSVILLE…DELAWARE…LONDON…
COLUMBUS…NEWARK…LANCASTER
355 PM EST TUE DEC 4 2007

…SNOW ADVISORY IN EFFECT FROM 7 PM THIS EVENING TO 4 PM EST
WEDNESDAY…

.TONIGHT…FLURRIES WITH A SLIGHT CHANCE OF SNOW THIS
EVENING…THEN SNOW LIKELY AFTER MIDNIGHT. SNOW LATE. SNOW
ACCUMULATION AN INCH OR LESS. LOWS IN THE MID 20S. LIGHT NORTHEAST
WINDS…BECOMING SOUTHEAST AFTER MIDNIGHT. CHANCE OF SNOW 100
PERCENT.
.WEDNESDAY…SNOW IN THE MORNING…THEN SNOW LIKELY IN THE
AFTERNOON. TOTAL ACCUMULATION OF 2 TO 3 INCHES. HIGHS IN THE
LOWER 30S. NORTHEAST WINDS 5 TO 10 MPH…BECOMING NORTH 10 TO
15 MPH IN THE AFTERNOON. CHANCE OF SNOW 100 PERCENT.
.WEDNESDAY NIGHT…MOSTLY CLOUDY IN THE EVENING…THEN BECOMING
PARTLY CLOUDY. LOWS 15 TO 20. NORTHWEST WINDS 10 TO 15 MPH…
DECREASING TO AROUND 5 MPH AFTER MIDNIGHT.

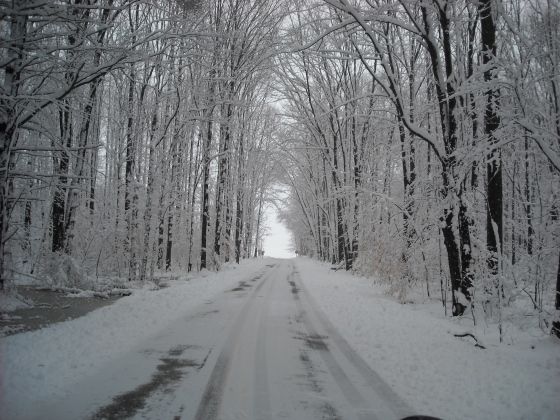
Snowfall began in western Ohio at about 10pm and reached central Ohio by midnight on the 4th. It began as flurries and light snow showers but gradually increased in intensity overnight and into the morning of the 5th, becoming heavy at times. By the time that the snowfall ended around 2:30pm in the afternoon, 4-6″ covered most of central Ohio, with the heaviest accumulations right near the I-70 corridor. Another max of snow occurred along a Mansfield to Canton line where a general 4-6″ also occurred.

The night of the 5th-6th brought a cold night for most of Ohio as clear skies after the storm and snow-covered ground sent temperatures far below normal. Most areas saw temperatures in the single digits, and many even fell into the single digits below zero. For Columbus, the low of 9 was the second lowest temperature ever recorded for the 6th of December.


New Year’s Climatology


New Years weather has historically been surprisingly tranquil, with some exceptions. Highs are generally in the 30s or 40s and significant snowfalls have been rare. Check out these records for some of the holiday’s biggest extremes.

New Years Eve Normals
High: 37
Low: 24
Mean: 30
Precipitation: 0.09″
Snowfall: 0.2″

New Years Day Normals
High: 37
Low: 23
Mean: 30
Precipitation: 0.10″
Snowfall: 0.3″

Temperature Records

Top 10 Coldest New Years Eve Highs
1. 1880: 10
2. 1976: 13
3. 1899: 16
4. 1917, 1962: 17
5. 2017: 19
6. 1894, 1998: 23
7. 1881, 1963, 1983, 2001: 24
8. 1914, 19161, 1997: 25
9. 1939, 1946, 2014: 26
10. 1935: 27

Top 10 Coldest New Years Day Highs
1. 1928: 8
2. 1968: 10
3. 2018: 11
4. 1977: 12
5. 1900: 16
6. 1969: 17
7. 1898, 1918: 18
8. 1940: 19
9. 1999: 20
10. 1881: 21

Top 10 Coldest New Years Eve Lows
1. 1976: -5
2. 1880: -3
3. 1899, 1963: 1
4. 1961, 1962, 2017: 2
5. 1983: 3
6. 1935, 1939: 6
7. 1902, 1917: 7
8. 1878, 1927, 1968: 8
9. 1960, 1967: 10
10. 1914, 2000: 11

Top 10 Coldest New Years Day Lows
1. 1968: -6
2. 2018: -2
3. 1928: -1
4. 1881: 0
5. 1977: 1
6. 1945: 2
7. 1940: 3
8. 1898, 1918, 1963: 4
9. 1900, 1969: 5
10. 20001: 6

Top 10 Coldest New Years Eve Means
1. 1880: 3.5
2. 1976: 4
3. 1899: 8.5
4. 1962: 9.5
5. 2017: 10.5
6. 1917: 12
7. 1963: 12.5
8. 1961, 1983: 13.5
9. 1939: 16
10. 1935: 16.5

Top 10 Coldest New Years Day Means
1. 1968: 2
2. 1928: 3.5
3. 2018: 4.5
4. 1977: 6.5
5. 1881, 1900: 10.5
6. 1898, 1918, 1940, 1969: 11
7. 1963, 1999: 13.5
8. 1887: 15
9. 2001: 16
10. 1974: 16.5

Top 10 Warmest New Years Eve Highs
1. 1951: 68
2. 1965: 63
3. 2010: 62
4. 2006, 2018: 61
5. 1992: 60
6. 1884, 1978: 59
7. 1972: 58
8. 1923, 1936: 57
9. 1906, 1933, 2004: 54
10. 1896, 1984, 2002: 53

Top 10 Warmest New Years Day Highs
1. 1952: 67
2. 1985: 65
3. 1890: 62
4. 1897: 61
5. 1930: 60
6. 1916, 1921, 1979: 59
7. 2011, 2019: 58
8. 1955: 57
9. 1905, 1934, 1948: 56
10. 1892, 1919, 2012: 55

Top 10 Warmest New Years Eve Lows
1. 1965: 52
2. 2004: 50
3. 2006, 2010: 45
4. 1951: 44
5. 1918, 1978: 43
6. 1937, 1947, 2002: 41
7. 1896, 1933, 2011: 39
8. 1906, 1929, 1931, 1972: 37
9. 1995, 2018: 36
10. 1883, 1888, 1936, 1984, 2005: 35

Top 10 Warmest New Years Day Lows
1. 1930: 47
2. 2005: 46
3. 1892: 43
4. 1891: 42
5. 1916, 1921, 1950, 1966: 41
6. 1897, 1905, 1932, 2019: 39
7. 1941, 1942, 1952: 38
8. 1890, 1907, 1996, 2007: 36
9. 1948, 1959: 35
10. 1886, 1943, 1967, 1992, 1997: 34

Top 10 Warmest New Years Eve Means
1. 1965: 57.5
2. 1951: 56
3. 2010: 53.5
4. 2006: 53
5. 2004: 52
6. 1978: 51
7. 2018: 48.5
8. 1972: 47.5
9. 2002: 47
10. 1933, 1937, 1992: 46.5

Top 10 Warmest New Years Day Means
1. 1930: 53.5
2. 1952: 52.5
3. 1897, 1916, 1921: 50
4. 1890, 1892, 1985, 2005: 49
5. 2019: 48.5
6. 1891: 48
7. 1905, 1950: 47.5
8. 1966: 46.5
9. 1942: 46
10. 1948: 45.5

New Years Eve High Temperatures by Occurrence since 1878
0 or Below: 0
1-9: 0
10-19: 6
20-29: 18
30-39: 51
40-49: 43
50-59: 19
60 and Above: 6

New Years Day High Temperatures by Occurrence since 1878
0 or Below: 0
1-9: 1
10-19: 8
20-29: 20
30-39: 47
40-49: 40
50-59: 22
60 and Above: 5

New Years Eve Low Temperatures by Occurrence since 1878
0 or Below: 2
1-9: 13
10-19: 27
20-29: 48
30-39: 43
40-49: 8
50-59: 2
60 and Above: 0

New Years Day Low Temperatures by Occurrence since 1878
0 or Below: 4
1-9: 15
10-19: 26
20-29 51
30-39: 39
40-49: 8
50-59: 0
60 and Above: 0


Precipitation Records

Top 10 Wettest New Years Eves
1. 2018: 1.01″
2. 1887: 0.89″
3. 1886: 0.76″
4. 1879: 0.74″
5. 1944: 0.71″
6. 1978: 0.67″
7. 1927: 0.49″
8. 1974: 0.47″
9. 1897, 1989, 2006: 0.46″
10. 1965: 0.41″

Top 10 Wettest New Years Days
1. 1948: 1.28″
2. 2021: 1.04″
3. 1916: 1.02″
4. 1979: 0.89″
5. 1919: 0.71″
6. 1959: 0.62″
7. 1893: 0.60″
8. 2003: 0.54″
9. 1964: 0.50″
10. 1965: 0.48″

New Years Eve Precipitation by Amount Occurrence since 1878
None: 43
Trace: 34
0.01-0.24: 46
0.25-0.49: 14
0.50-0.99: 5
1.00 or More: 1

New Years Day Precipitation by Amount Occurrence since 1878
None: 49
Trace: 34
0.01-0.24: 37
0.25-0.49: 14
0.50-0.99: 6
1.00 or More: 3

Top 10 Snowiest New Years Eves
1. 1897: 3.6″
2. 1892: 3.0″
3. 1960: 2.6″
4. 1967: 2.4″
5. 2009: 2.1″
6. 1980: 2.0″
7. 1973: 1.9″
8. 1998, 2012: 1.7″
9. 1887: 1.6″
10. 1961: 0.9″

Top 10 Snowiest New Years Days
1. 1964: 5.2″
2. 1883: 3.9″
3. 1887: 2.5″
4. 1970: 2.2″
5. 1884: 1.8″
6. 1945: 1.7″
7. 1961: 1.6″
8. 1928: 1.3″
9. 1918: 1.2″
10. 1981: 1.1″

Top 10 Snowiest New Years Holidays (Both December 31st and January 1st Combined)
1. 1963-1964: 5.2″
2. 1960-1961: 4.2″
3. 1892-1893: 4.0″
4. 1882-1883: 3.9″
5. 1897-1898: 3.6″
6. 1980-1981: 3.1″
7. 2009-2010: 2.7″
8. 1969-1970: 2.6″
9. 1886-1887: 2.5″
10. 1967-1968: 2.4″

New Years Eve Snowfall by Amount Occurrence since 1878
None: 89
Trace: 27
0.1-0.4: 13
0.5-0.9: 4
1.0-2.4: 7
2.5-4.9: 3
5.0 or More: 0

New Years Day Snowfall by Amount Occurrence since 1878
None: 86
Trace: 28
0.1-0.4: 12
0.5-0.9: 4
1.0-2.4: 10
2.5-4.9: 2
5.0 or More: 1

Top 5 Deepest New Years Eve Snow Depths since 1940
1. 2012: 7″
2. 1973, 2000: 4″
3. 1960, 1976, 2017: 3″
4. 1961, 1995, 1997, 2009: 2″
5. 1967, 1969, 1993, 1998, 2020: 1″

Top 5 Deepest New Years Day Snow Depths since 1940
1. 2013: 9″
2. 1961: 6″
3. 2001: 4″
4. 1974, 1977: 3″
5. 1940, 1945, 1962, 1968, 1981, 2018: 2″

For more local weather records, visit:
Weather History
And for current local weather and forecasts, visit:
Wilmington National Weather Service