The new Winter 2025-2026 Review reveals that the winter was the first snowier than normal winter since 2017-2018. It also featured the first 6″+ snow event since the winter of 2014-2015, with one of the biggest snowstorms of all-time on January 25th. It also featured generally below-normal temperatures for the core of the winter, followed by a very warm spring.
Temperatures
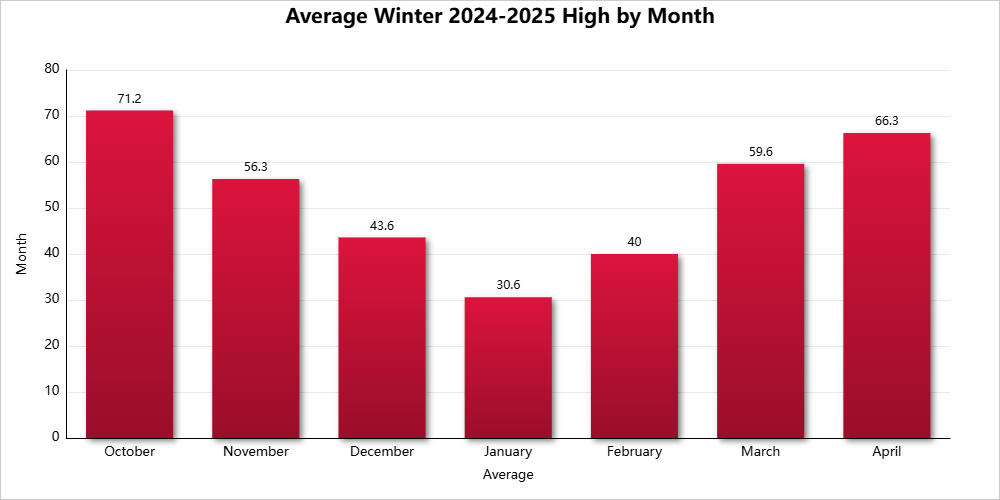
Average High Temperature October: 67.7 November: 51.6 December: 39.8 January: 32.7 February: 40.5 March: 60.4 April: 71.6
Cold Season Average High: 52.1 Cold Seasond Average High Departure: +1.8 Winter Season Average High: 37.6 Winter Season Average High Departure: -2.3
Mean High Departure from Normal October: +2.2 November: -0.7 December: -1.7 January: -4.4 February: -0.3 March: +9.3 April: +7.5
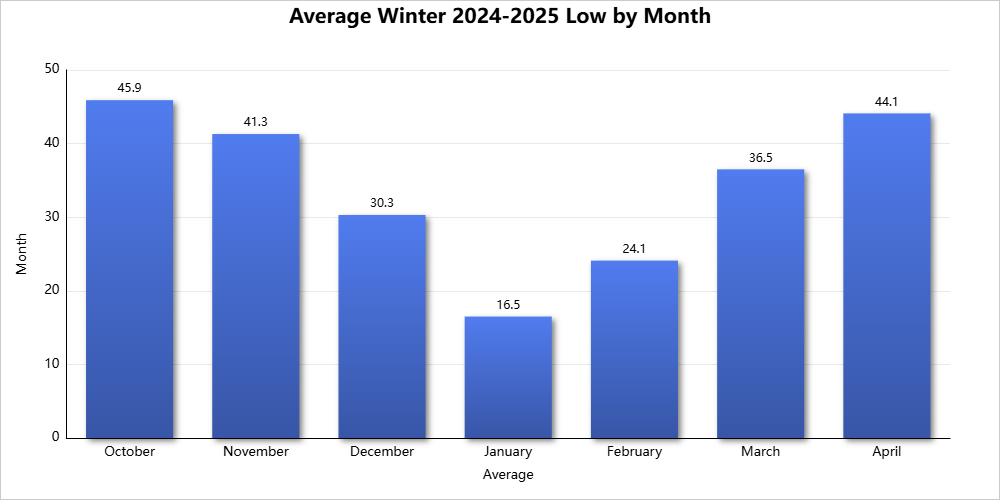
Average Low Temperature October: 46.8 November: 34.1 December: 23.8 January: 15.7 February: 22.4 March: 38.5 April: 48.4
Cold Season Average Low: 32.9 Cold Season Average Low Departure: +0.4 Winter Season Average Low: 20.6 Winter Season Average Low Departure: -4.0
Mean Low Departure from Normal October: +2.0 November: -0.9 December: -3.8 January: -6.3 February: -0.4 March: +6.5 April: +6.2
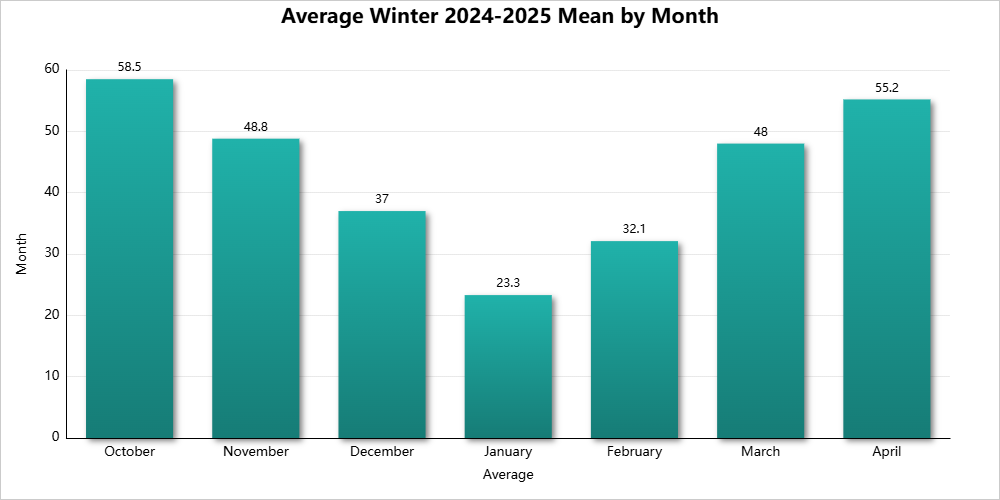
Mean Temperature October: 57.3 November: 42.9 December: 31.8 January: 24.2 February: 31.5 March: 49.5 April: 60.0
Cold Season Average Mean: 42.5 Cold Season Average Mean Departure: +1.0 Winter Season Average Mean: 29.1 Winter Season Average Mean Departure: -3.1
Mean Departure from Normal October: +2.1 November: -0.7 December: -2.7 January: -5.4 February: -1.0 March: +7.9 April: +6.8
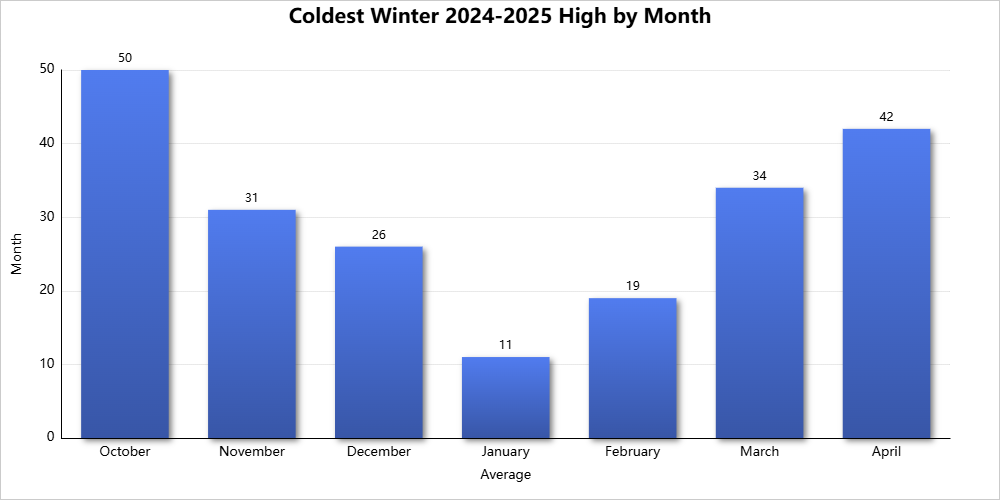
Coldest High Temperature October: 51 on the 22nd and 30th November: 33 on the 10th December: 18 on the 14th January: 12 on the 28th February: 19 on the 5th March: 27 on the 17th April: 46 on the 7th
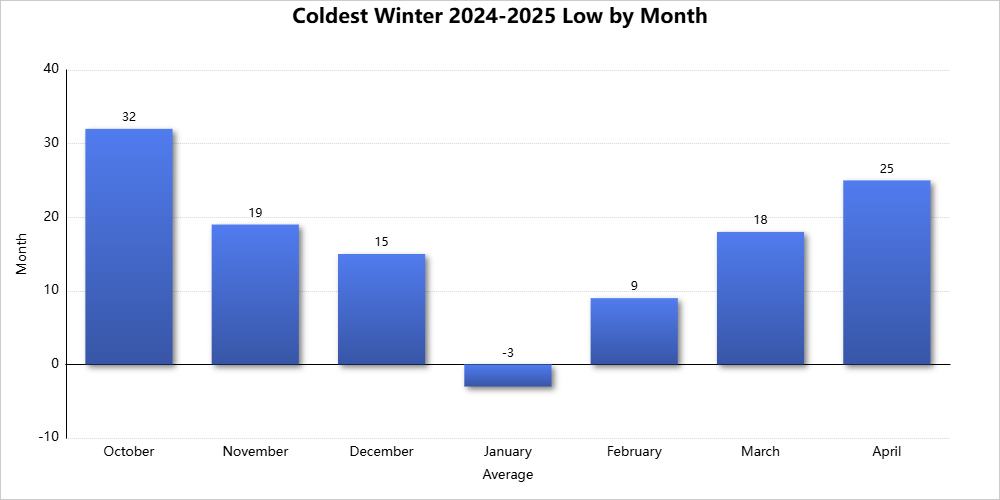
Coldest Low Temperature October: 34 on the 24th and 25th November: 19 on the 29th December: 1 on the 15th January: -9 on the 31st February: 0 on the 2nd March: 20 on the 17th and 18th April: 29 on the 8th
Coldest Mean Temperature October: 46 on the 24th and 30th November: 28.5 on the 10th and 29th December: 10 on the 15th January: 2 on the 28th February: 10.5 on the 5th March: 23.5 on the 17th April: 38.5 on the 7th
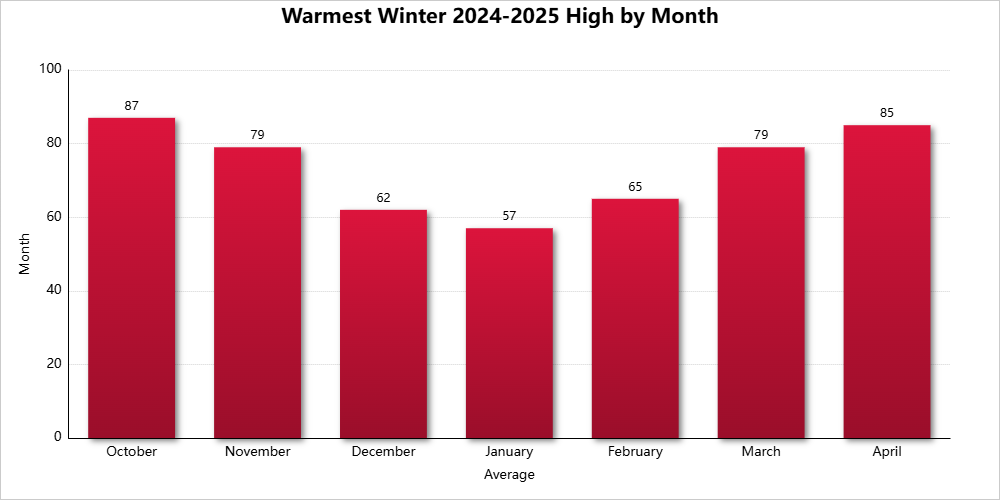
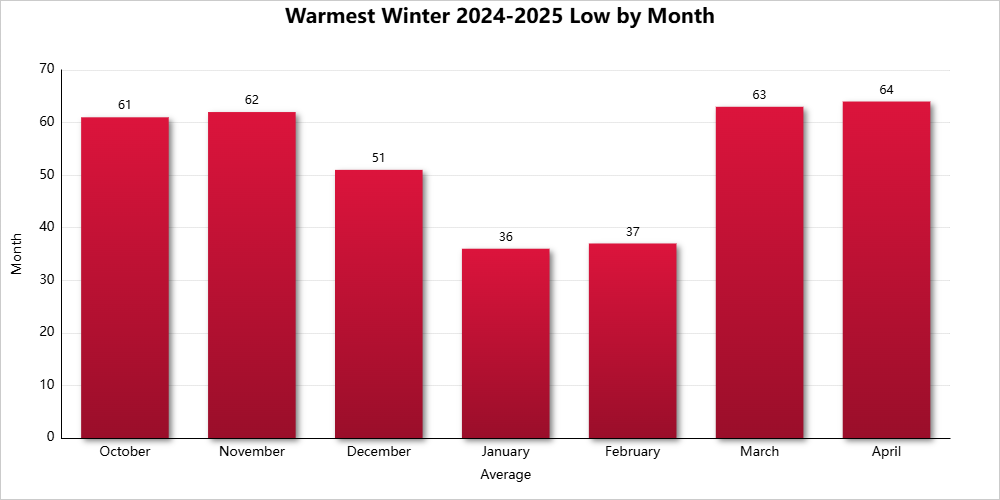
Warmest High Temperature October: 85 on the 4th November: 67 on the 5th December: 68 on the 28th January: 65 on the 9th February: 65 on the 18th March: 86 on the 22nd April: 84 on the 14th and 15th
Warmest Low Temperature October: 59 on the 7th November: 49 on the 15th December: 40 on the 28th January: 39 on the 9th February: 48 on the 18th March: 62 on the 31st April: 67 on the 3rd and 13th
Warmest Mean Temperature October: 70.5 on the 3rd and 4th November: 57.5 on the 15th December: 54 on the 28th January: 52 on the 9th February: 56.5 on the 18th March: 70.5 on the 31st April: 74.5 on the 15th
Temperature Records October None November None December A record daily high was tied on the 28th. The high of 68 degrees tied the previous record set in 1984. January A record daily high was set on the 9th. The high of 65 degrees broke the old record of 62 set in 1946 and 1949. A record daily low was set on the 31st. The low of -9 degrees broke the old record of -6 set in 2004. The period of January 24-January 31st featured 8 consecutive highs below 20 degrees. This ties the record for the longest such consecutive streak, matching similar records set 1/10-1/17/1893 and 2/6-2/13/1899. February None March A daily record warm low was set on the 7th. The low of 59 degrees broke the old record of 56 set in 1974. A daily record warm low was set on the 10th. The low of 56 degrees broke the old record of 53 set in 1879. A daily record high was set on the 22nd. The high of 86 degrees broke the old record of 85 set in 2012. This also broke the record for the warmest temperature ever recorded in March. A daily record warm low was set on the 31st. Thg low of 62 degrees broke the old record of 61 set in 1998. April A daily record warm low was set on the 3rd. The low of 67 degrees broke the old record of 58 set in both 1892 and 1963. A daily record warm low was set on the 13th. The low of 67 degrees broke the old record of 63 set in 2018. A daily record warm low was set on the 14th. The low of 63 degrees broke the old record of 61 set in 1941. A daily record high was tied on the 15th. The high of 84 degrees tied the old record of 84 set in 2010. A daily record warm low was set on the 15th. The low of 65 degrees broke the old record of 62 set in both 1912 and 1941.
Precipitation
Total Precipitation Days October: 7 November: 16 December: 19 January: 21 February: 14 March: 18 April: 19
Cold Season Total: 21.31″ Winter Season Total: 6.40″
Monthly Precipitation Departure from Normal October: +0.98″ November: -0.57″ December: -0.63″ January: -1.37″ February: -0.14″ March: +2.00″ April: -0.76″
Cold Season Departure from Normal: -0.49″ Winter Season Departure from Normal: -2.14″
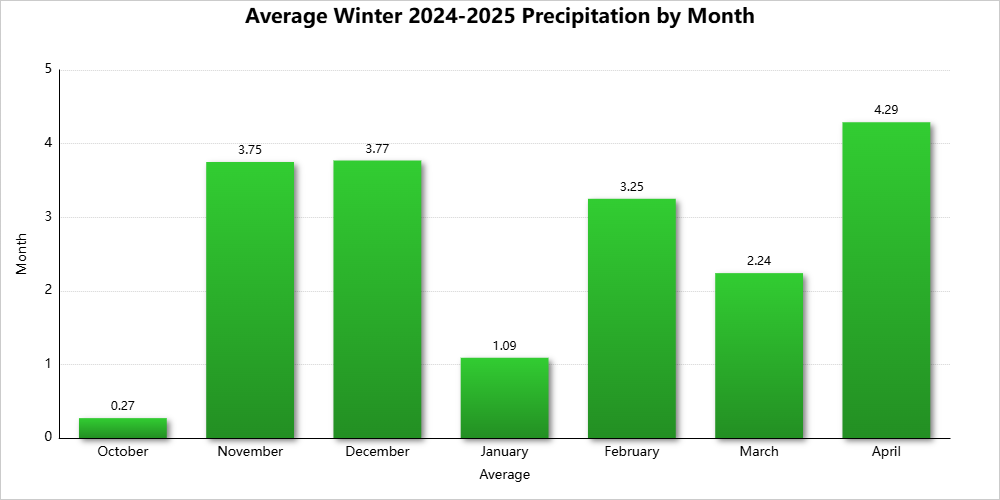
Greatest Precipitation October: 1.84″ on the 7th November: 0.70″ on the 25th December: 0.60″ on the 18th January: 1.09″ on the 25th February: 1.14″ on the 19th March: 1.03″ on the 27th April: 0.80″ on the 22nd
Cold Season Total: 33.9″ Winter Season Total: 28.5″
Monthly Snowfall Departure from Normal October: -0.2″ November: +0.6″ December: +7.1″ January: +3.6″ February: -4.4″ March: -0.5″ April: -0.5″
Cold Season Snowfall Departure: +5.7″ Winter Season Departure from Normal: +6.3″
Greatest Snowfall October: 0″ November: 1.3″ on the 10th December: 5.4″ on the 13th January: 11.9″ on the 25th February: 1.5″ on the 6th March: 3.0″ on the 2nd April: 0″ on All Days
Precipitation Records October 10/7/2025: Record daily precipitation of 1.84″, breaking the old record of 1.61″ set in 1998. November None December 12/2/2025: Record daily snowfall of 4.7″, breaking the old record of 3.0″ set in 1936. 12/13/2025: Record daily snowfall of 5.4″, breaking the old record of 3.6″ set in 1945. January 1/25/2026: Record daily snowfall of 11.9″, breaking the old record of 4.7″ set in 1988. 1/25/2026: Record daily precipitation of 1.09″, breaking the old record of 0.68″ set in 1952. February None March None April None
Total Snow Days October: 0 November: 9 December: 12 January: 16 February: 10 March: 6 April: 0
Deepest Snow Depth October: 0 November: 1″ on the 10th December: 5″ on the 2nd and 14th January: 12″ on the 26th February: 8″ on the 1st, 2nd and 3rd March: 2″ on the 2nd April: 0″ on All Days
Days with Snow Depth of 1″+ October: 0 November: 1 December: 11 January: 9 February: 14 March: 1 April: 0
Average Daily Snow Depth by Month October: 0 November: Trace December: 1.1″ January: 2.3″ Feburary: 2.5″ March: 0.1″ April: 0″
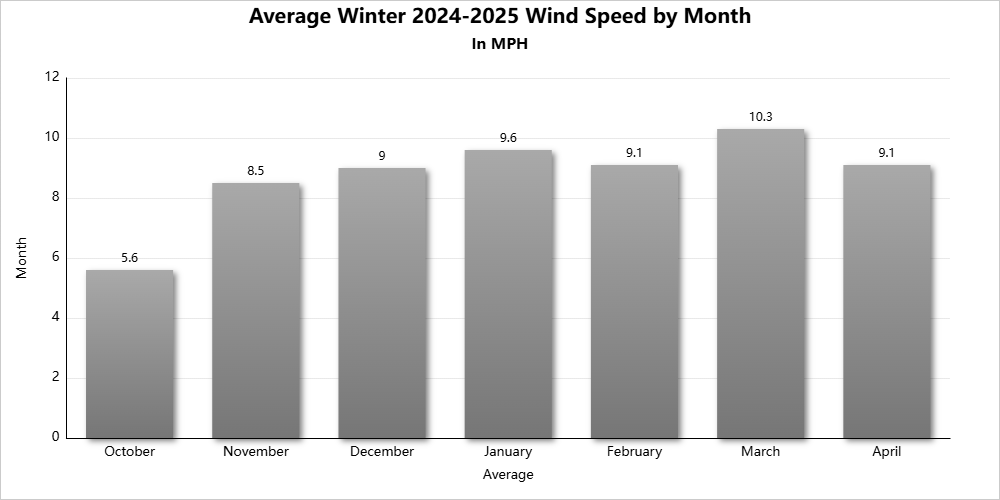
Average Daily Wind Speed in MPH October: 6.8 November: 8.2 December: 9.2 January: 9.8 February: 7.6 March: 10.4 April: 9.9
Highest Wind Gust in MPH October: 42 on the 21st November: 43 on the 5th and 26th December: 51 on the 29th January: 49 on the 19th February: 60 on the 20th March: 69 on the 22nd April: 54 on the 14th
Clear Days by Month October: 10 November: 4 December: 1 January: 2 February: 2 March: 2 April: 2
Partly Cloudy Days by Month October: 16 November: 15 December: 12 January: 10 February: 18 March: 14 April: 19
Cloudy Days by Month October: 5 November: 11 December: 18 January: 19 February: 8 March: 15 April: 9
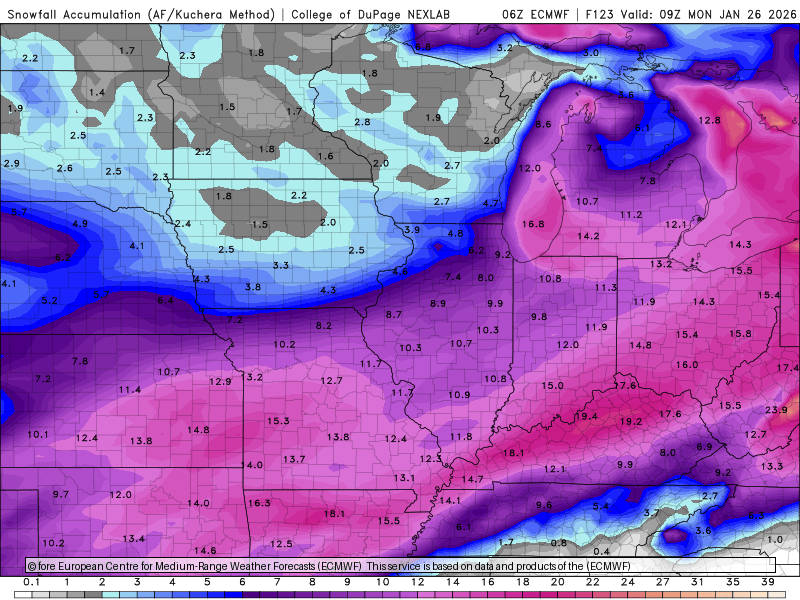
Final Update as of 9:24AM, 1/26/2026: Well, after all the model runs and predictions, the storm did indeed not only happen, but was a historic event for Central Ohio. A general 10″-15″ occurred in most areas. The 11.9″ at John Glenn International yesterday broke the daily snowfall record for the date, beating the old record of 4.7″ set in 1988. It also tied for the 3rd highest one-day snowfall total for any date in history, after only March 8, 2008’s 15.5″ and April 4, 1987’s 12.3″. Additionally, the 12″ storm total for January 24th-25th, 2026 will go down as the 7th biggest snowstorm of all-time in Columbus. Although I had originally planned to delete this post after the storm, I have instead decided to keep it up for posterity reasons in memory of this historic weather event. When available, I may add snowfall total maps to the post.
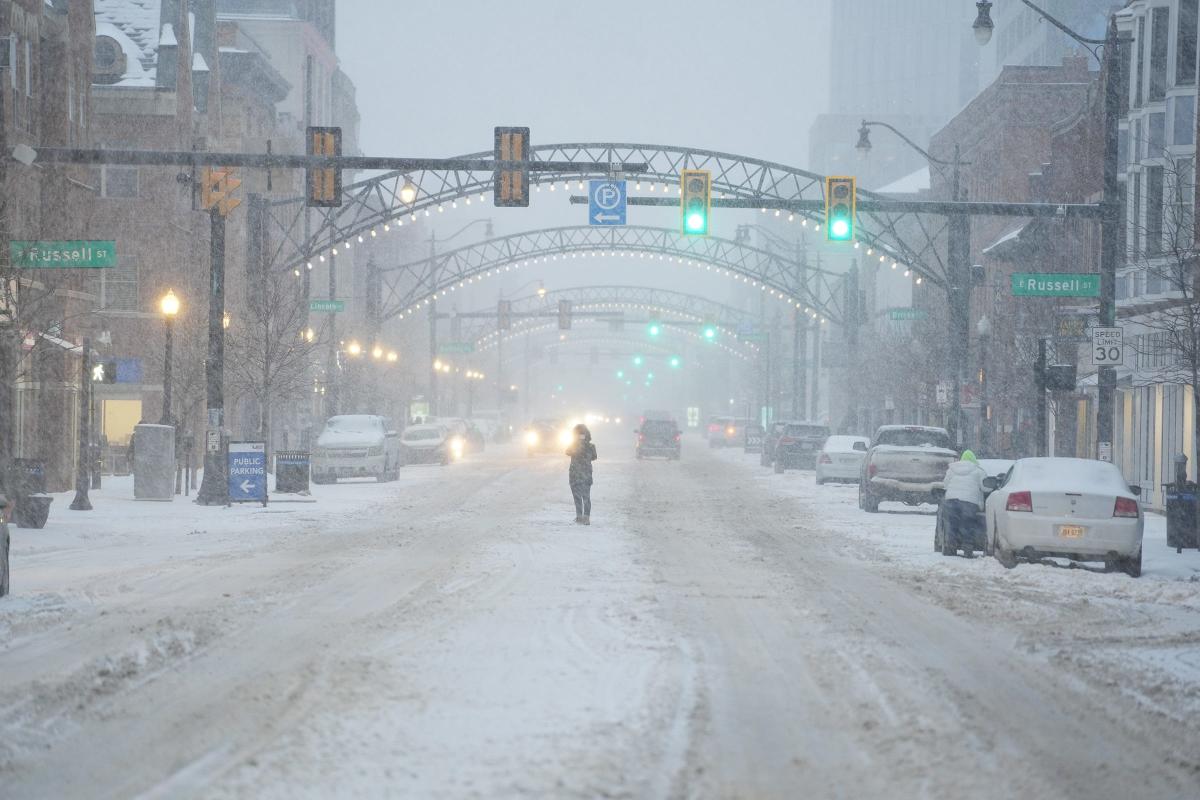
Updated as of 8:22AM, 1/25/2026: Columbus is waking up to a winter wonderland this morning. 6″-8″ has already fallen across the city with heavy snow rates continuing. In fact, the snow rate is about to get even heavier, with some of the strongest bands yet about to move in. The snowfall amounts are a bit higher than expected by this time, so with rates of 1″-2″ an hour falling for the next few hours, it is not out of the realm of possibility that the storm totals hit the higher estimates of 15″+. Follow snow totals here: Area Snow Reports
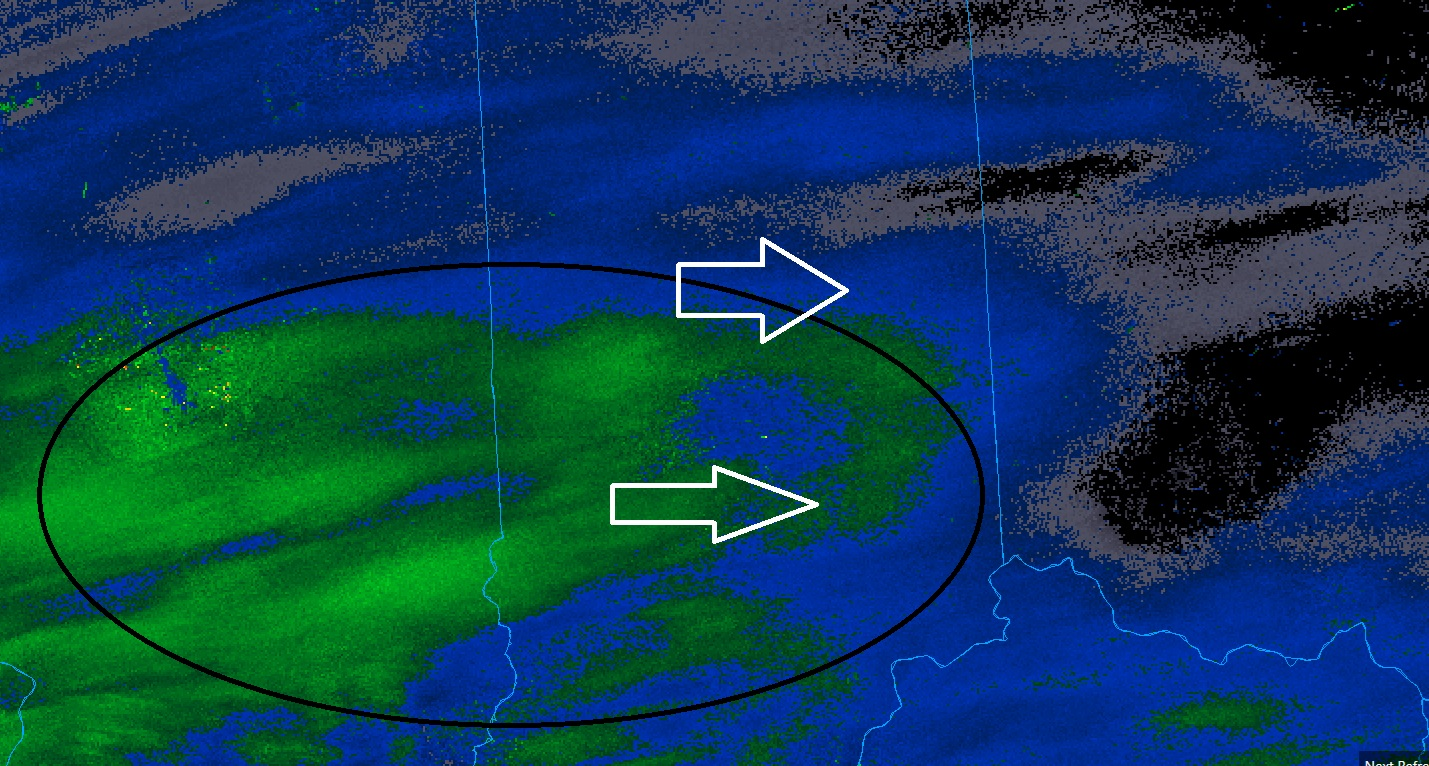
Updated as of 12:47AM, 1/25/2026: The Storm Prediction Center has issued a Mesoscale Discussion for heavy snow in a swatch from southern Illinois into the Columbus area for snow rates of 1″+ per hour. The radar shows heavy snow bands moving east-northeast in Columbus from the Southwest, and these should continue to pound the area well into the morning hours of Sunday. Expect snowfall rates to dramatically increase in Columbus no later than 1AM-1:20AM.
Updated af 6:40PM, 1/24/2026: Flakes starting to fly in the Columbus area!
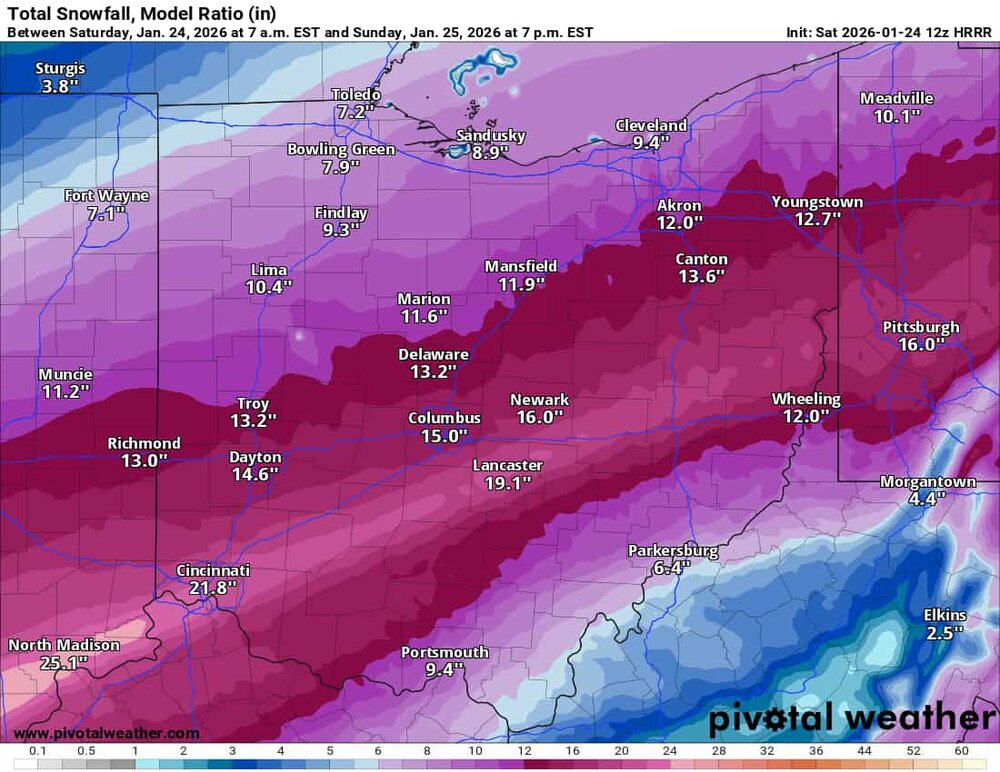
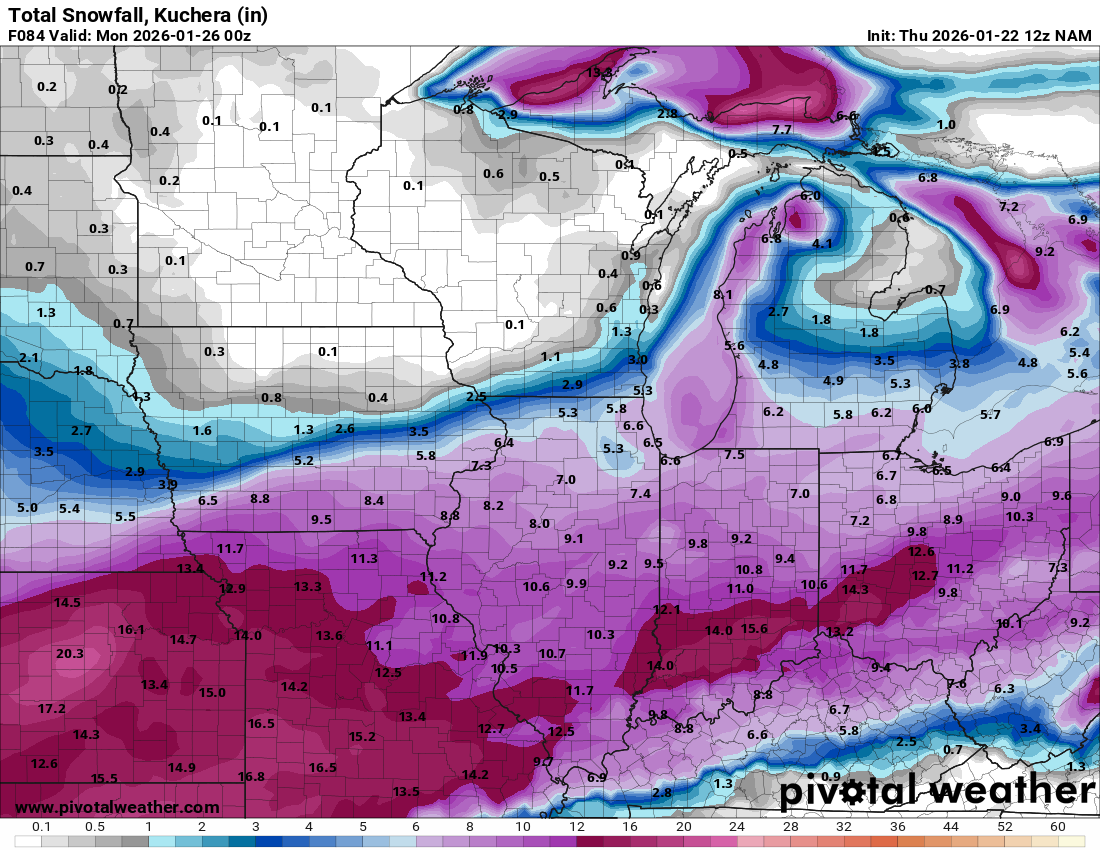
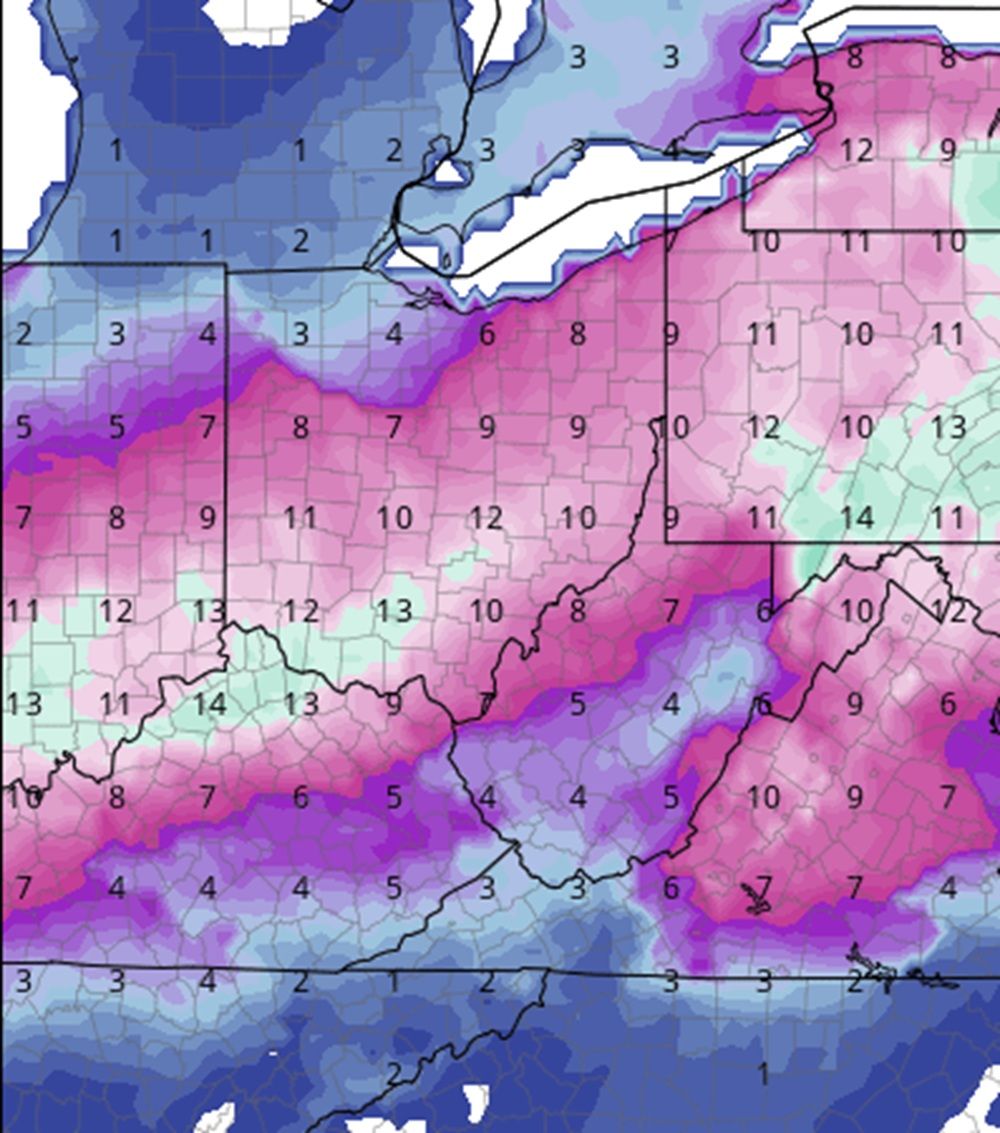
Updated as of 3:24PM, 1/24/2026: Some of the models are going absolutely bonkers with snow for Central Ohio. Here is the latest HRRR, showing totals approaching 2 FEET in Columbus. Needless to say, this is pretty unlikely. However, it does continue to show the historic potential of this storm.
As for the on-the-ground status of things… Snow is falling across large parts of southern and western Indiana into the Indianapolis metro, and should be entering Ohio within the next hour or so. There will be some dry air intitially to overcome, but it seems based on obs that once a heavier band develops, the snow will quickly reach the ground. What is interesting to note is that the heaviest returns are heading right for Central Ohio.
Updated as of 12:42PM, 1/24/2026: Governor DeWine has declared State of Emergency for the entire state in antipication of the storm. Columbus Mayor Ginther has warned that a very rare Level 3 Snow Emergency may end up being issued at some point during the storm.
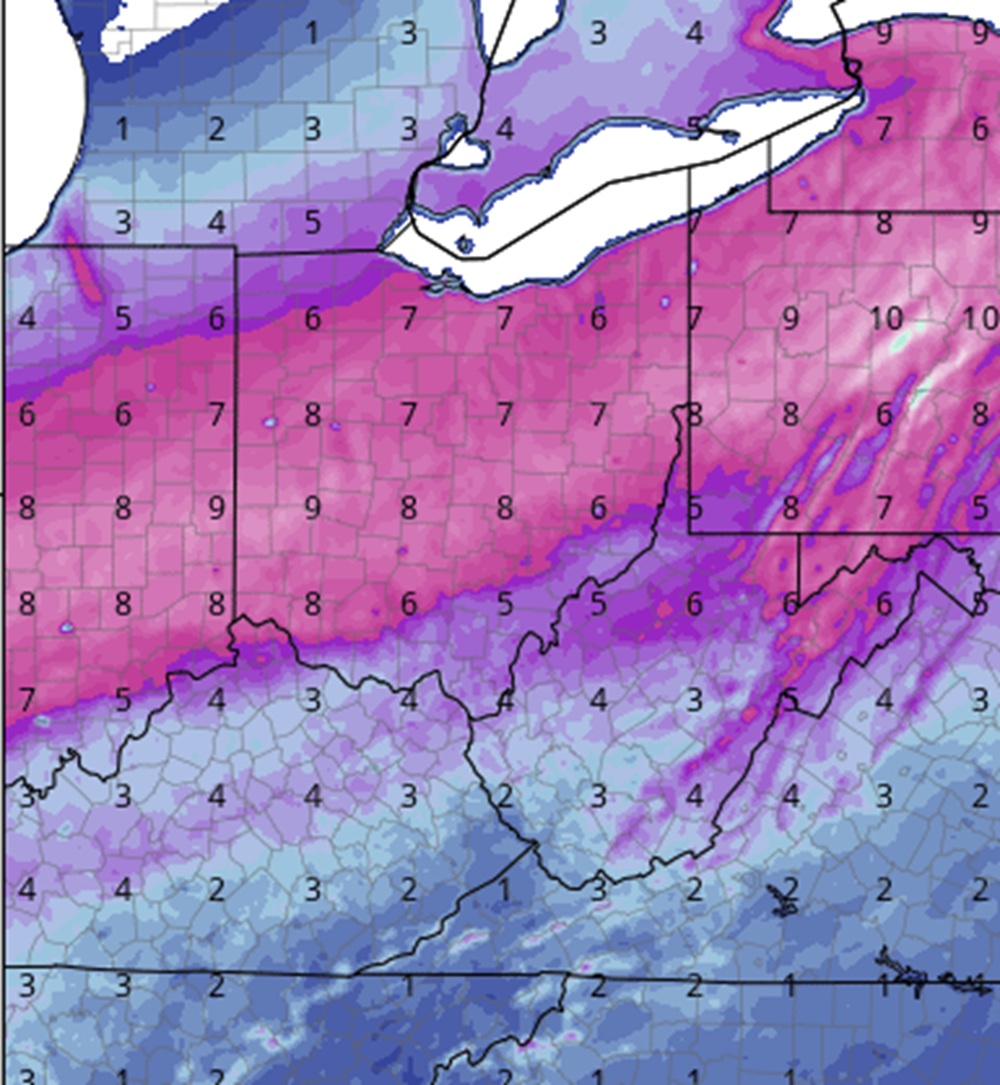
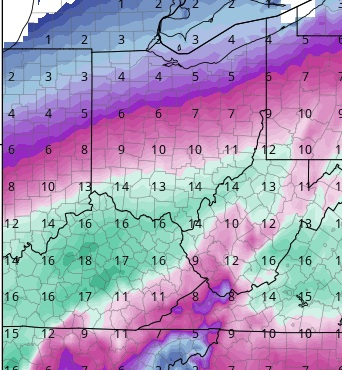
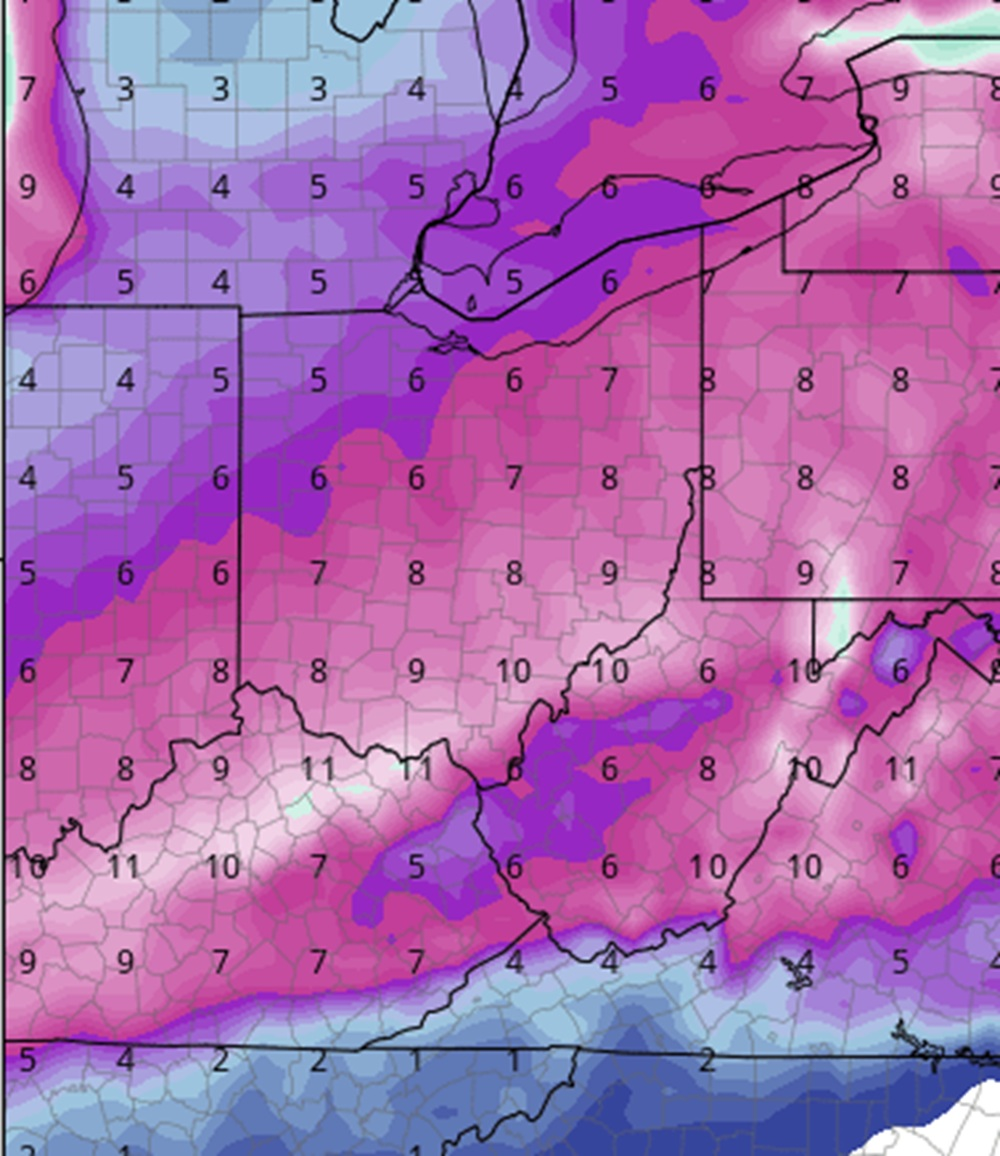
Meanwhile, short-range models continue to increase potential snow totals. Here was the true ratio for the HRRR. Those are some insane totals for Central and Southwest Ohio, very similar to March, 2008.
Previous Updates: Updated as of 8:35AM, 1/24/2026: Today’s the day! Short-range models overnight have actually increased snow totals across Columbus and Central Ohio. Curiously, NWS Wilmington went in the opposite direction and slightly lowered their own forecast, from 8″-15″ to 6″-14″. If models keep the same uptrends, I would expect them to increase predicted totals at some point today, and if so, I will update here. Regardless, I still think a solid 10″-12″ is likely, and based on the models, I think the potential for more than that is increasing.
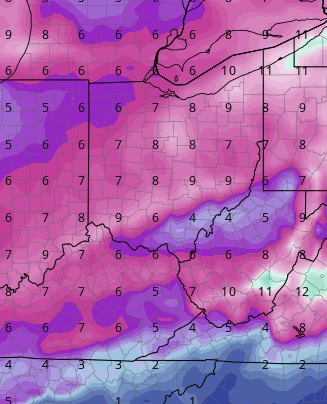
Let’s take a look at some of the latest short-term models. 6Z NAM- 8″-10″ (10-1 Ratio)- NAM has been further north than most other models, and it brings the mixing line further into Ohio but still well south of Columbus. With true ratios, this would be 10″-13″. 6Z GEM: 8″-10 (10-1 Ratio)- The RGEM is further south with the heaviest snows than NAM, but also has higher totals, even at 10-1, in Ohio. True ratios would be 10″-13″. 12Z HRRR- 10″-12″ (10-1 Ratio)- The HRRR is a model that updates every hour. The latest shows the heaviest bands right through Central Ohio. True ratios would suggest 13″-15″. 6Z GFS- 10″-12″ (10-1 Ratio)- GFS is not a short-range model, but it has gone much higher with snow totals in Ohio, now bringing 14-15″ into the southern 1/3rd, and thats on 10-1. Should ratios be higher, it’s actually predicting 17″-18″ for part of the state, and Columbus would get 13″-14″ as well.
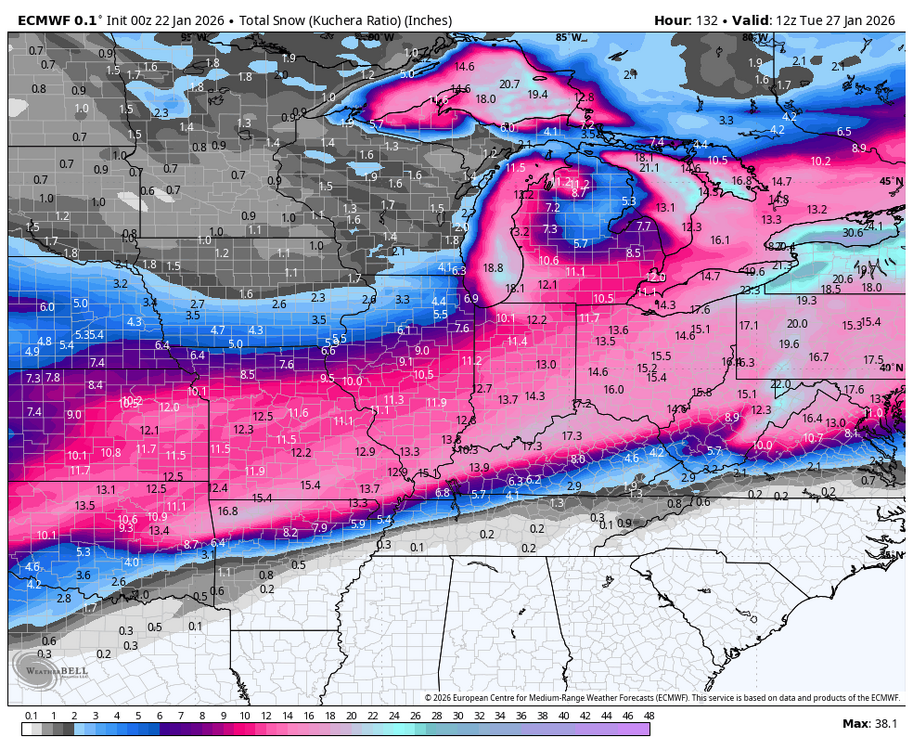
All other models bring high totals into the area, with the Euro remaining consistent with 15-16″ or so. Clearly there’s still some spread in totals, but they all generally bring a high chance of double-digit snowfall.
Meanwhile, as I said, Wilmington is hedging a bit given that they believe more mixing comes further north, but they do not have mixing coming into the Columbus area. Here is a snippet from the early morning discussion: “Generally expect Snow amounts in the 8 to 10 inch range for much of our area. Snow amounts across our south/southeast will of course be dependent on how much of a mix develops, so amounts may be a tad on the high side there. Would also not be surprised if we end up with an axis of a foot or so somewhere across our area. Think the best chance for this would be just to the northwest of the northward extent of the mixed pcpn, most likely somewhere along the I-71 corridor.”
So they clearly believe that the highest snow totals will indeed be through Columbus.
All current warnings and advisories remain in place for both the upcoming storm and the current cold. Additional updates will be made as needed.
Updated as of 8:35AM, 1/24/2026: Today’s the day! Short-range models overnight have actually increased snow totals across Columbus and Central Ohio. Curiously, NWS Wilmington went in the opposite direction and slightly lowered their own forecast, from 8″-15″ to 6″-14″. I’m not sure if this is just their normal tendency to be extra conservative, or something they’re sniffing out that the models clearly aren’t seeing. If models keep the same uptrends, I would expect them to increase predicted totals at some point today, and if so, I will update here. Regardless, I still think a solid 10″-12″ is likely, and based on the models, I think the potential for more than that is increasing.
Update as of 4:25PM, 1/23/2026: No significant updates to speak of. It seems like any threat of mix/sleet has been squashed for anywhere close to Columbus, so that should not affect snow totals there or through most of Central Ohio. As for accululations, they largely look the same as well as models seem to be honing in on a final track. At least 8″ is all but guaranteed across the region, and chances for double-digit snowfall is also highly likely for many locations. I would expect Columbus itself to range from 10″-12″, all said and done, but I would not be surprised if some areas saw up to 14″-15″. It’s just about nowcast time as the storm is taking shape in the Southern Plains.
Update as of 8:20AM, 1/23/2026. The National Weather Service has issued a Winter Storm Warning for all of Central Ohio. The Warning calls for 8″-12″, though the Columbus point forecast has up to 15″ possible. Here is the warning text: URGENT – WINTER WEATHER MESSAGE National Weather Service Wilmington OH 127 AM EST Fri Jan 23 2026 Wayne-Fayette-Union-Franklin-Ripley-Dearborn-Darke-Shelby-Logan-Union-Delaware-Miami-Champaign-Clark-Madison-Franklin-Licking-Preble-Montgomery-Greene-Fayette-Pickaway-Fairfield-Butler-Warren-Clinton-Hocking-Hamilton- Including the cities of Newark, Liberty, Troy, Versailles, Connersville, Bright, Beavercreek, Middletown, Eaton, Greendale, London, Plain City, Logan, Osgood, Urbana, Downtown Cincinnati, Wilmington, Marysville, Milan, Piqua, Brookville, Hidden Valley, Tipp City, Kettering, Franklin, Greenville, Washington Court House, Springfield, Camden, Lancaster, Oxford, Downtown Dayton, Batesville, Xenia, Lebanon, Pickerington, Blanchester, Mason, Landen, Aurora, Delaware, Circleville, Bellefontaine, Fairfield, Springboro, West College Corner, Richmond, Fairborn, Hamilton, West Jefferson, Downtown Columbus, Lawrenceburg, Dillsboro, and Sidney 127 AM EST Fri Jan 23 2026 …WINTER STORM WARNING IN EFFECT FROM 10 AM SATURDAY TO NOON EST MONDAY… * WHAT…Heavy snow expected. Total snow accumulations between 8 and 12 inches. * WHERE…Portions of east central and southeast Indiana and central, southwest, and west central Ohio. * WHEN…From 10 AM Saturday to noon EST Monday. * IMPACTS…Travel could be very difficult to impossible. The hazardous conditions could impact the Monday morning commute.
Here is the NWS point forecast for Columbus: Today Partly sunny, with a high near 17. Wind chill values as low as -3. Northwest wind 10 to 13 mph. Tonight Partly cloudy, with a low around 2. Wind chill values as low as -8. North wind 6 to 9 mph. Saturday A chance of snow after 1pm. Mostly cloudy, with a high near 14. Wind chill values as low as -8. East wind 5 to 8 mph. Chance of precipitation is 40%. Little or no snow accumulation expected. Saturday Night Snow. Low around 12. Wind chill values as low as zero. East wind around 8 mph. Chance of precipitation is 100%. New snow accumulation of 2 to 4 inches possible. Sunday Snow. The snow could be heavy at times. High near 24. Northeast wind 8 to 10 mph. Chance of precipitation is 100%. New snow accumulation of 4 to 8 inches possible. Sunday Night Snow likely, mainly before 1am. Cloudy, with a low around 9. Chance of precipitation is 70%. New snow accumulation of 1 to 3 inches possible. Monday Mostly cloudy, with a high near 16.
As to the evolution of the upcoming storm, it should begin sometime Saturday afternoon, most likely after 5PM. Overnight, models seem to have largely gotten rid of the idea of two distinct waves and have instead coalesced around one longer wave with just lighter snow Saturday evening instead of an actual break. The threat of mixing or sleet lowering totals is low at this point. Most models continue the snow through early Monday morning.
Either way, it seems that Central Ohio is set for a historic, and likely record-breaking snowstorm. The daily snowfall records for January 24th, 25th and 26th are as follows: January 24th: 5.7″ set in 1948 January 25th: 4.7″ set in 1988 January 26th: 4.4″ set in the Great Blizzard of 1978 It’s unclear if the records on the 24th and 26th will be surpassed, but it’s almost a guarantee that the 25th’s will be.
Additionally, it is possible that this storm becomes the largest on record for January. Here are the top 5 snowstorms for the month: January 6-7, 1901: 12.7″ January 8-9, 1884: 10.2″ January 13-14, 1917: 10.0″ January 16-17, 1978: 9.9″ January 6-7, 1996: 9.8″
Could this also become one of the largest snowstorms ever for Columbus?
Another side of the storm will obviously be the very cold weather during and after. Wind chills of -10 to -15 are expected over the next few days and beyond. As such, NWS has issued a Cold Weather Advisory. URGENT – WEATHER MESSAGE National Weather Service Wilmington OH 134 AM EST Fri Jan 23 2026 Fayette-Union-Franklin-Ripley-Dearborn-Ohio-Switzerland-Carroll-Gallatin-Boone-Kenton-Campbell-Owen-Grant-Pendleton-Bracken-Robertson-Mason-Lewis-Union-Delaware-Miami-Champaign-Clark-Madison-Franklin-Licking-Preble-Montgomery-Greene-Fayette-Pickaway-Fairfield-Butler-Warren-Clinton-Ross-Hocking-Hamilton- Clermont-Brown-Highland-Adams-Pike-Scioto- Including the cities of Withamsville, Carrollton, Troy, Crittenden, Bright, Beavercreek, Middletown, Head Of Grassy, Eaton, Greendale, Fort Thomas, Day Heights, Brookville, Kettering, Hillsboro, Pike Lake, Summerside, Mount Carmel, Pickerington, Landen, Delaware, Highland Heights, Circleville, Winchester, Dayton, West College Corner, Fairborn, West Jefferson, Greenfield, Williamstown, Dillsboro, Seaman, Liberty, Erlanger, Newport, Wilmington, Independence, Aberdeen, Peebles, Waverly, Springfield, Butler, Batesville, Xenia, Bellevue, Downtown Columbus, Lawrenceburg, Mount Repose, Versailles, Augusta, Ripley, Covington, Piketon, Milan, Burlington, Franklin, Manchester, Camp Dix, Florence, Owenton, Washington Court House, Oakbrook, Lancaster, Oxford, Lebanon, Mason, Aurora, Wheelersburg, Georgetown, Warsaw, Osgood, Newark, Rising Sun, Brooksville, Connersville, Vanceburg, Plain City, London, Logan, Downtown Cincinnati, Marysville, Piqua, West Union, Hidden Valley, Tipp City, Portsmouth, Mount Orab, Camden, Maysville, Chillicothe, Downtown Dayton, Milford, Tollesboro, Blanchester, Mulberry, Falmouth, Springboro, Vevay, Fairfield, Mount Olivet, Alexandria, Hamilton, Dry Ridge, and Urbana 134 AM EST Fri Jan 23 2026 …COLD WEATHER ADVISORY REMAINS IN EFFECT FROM 6 PM THIS EVENING TO NOON EST SATURDAY… * WHAT…Very cold wind chills as low as 12 below zero expected. * WHERE…Portions of east central and southeast Indiana, northeast and northern Kentucky, and central, south central, southwest, and west central Ohio. * WHEN…From 6 PM this evening to noon EST Saturday. * IMPACTS…The cold wind chills as low as 10 below zero could result in hypothermia if precautions are not taken.
This advisory is likely to be extended beyond Saturday, as temperatures are expected to remain very cold through the end of the month. In fact, they should remain below freezing through the first week of February.
Additionally, there are signs that another snow event, a potential clipper, may impact areas of Ohio perhaps on the 29th. It is showing up on several models, but the details are sketchy. Needless to say, the pattern will be very wintry for the next few weeks.
Updated as of 3PM, 1/22/2026. The NWS Point Forecast now calls for 6″-10″ through Sunday daytime with additional accumulation through Monday morning, so 8″-12″ is likely where they are. This still may be a bit low compared to forecast models, but we’ll have to see how that situation evolves.
Updated as of 12:40PM, 1/22/2026. A Winter Storm Watch was issued by NWS Wilmington early this morning. Here is that watch: URGENT – WINTER WEATHER MESSAGE National Weather Service Wilmington OH 205 AM EST Thu Jan 22 2026 Wayne-Fayette-Union-Franklin-Union-Delaware-Miami-Champaign-Clark-Madison-Franklin-Licking-Preble-Montgomery-Greene-Butler- Including the cities of Richmond, Springfield, Fairborn, Oxford, Fairfield, Beavercreek, Middletown, Newark, Troy, Camden, Delaware, Xenia, Brookville, Kettering, Downtown Columbus, Piqua, Urbana, Hamilton, Plain City, Liberty, West Jefferson, Connersville, West College Corner, Eaton, Downtown Dayton, Tipp City, London, and Marysville …WINTER STORM WATCH IN EFFECT FROM SATURDAY MORNING THROUGH LATE SUNDAY NIGHT… * WHAT…Heavy snow possible. Total snow accumulations between 4 and 8 inches possible. * WHERE…Portions of east central and southeast Indiana and central, southwest, and west central Ohio. * WHEN…From Saturday afternoon through late Sunday night. * IMPACTS…Travel could be very difficult.
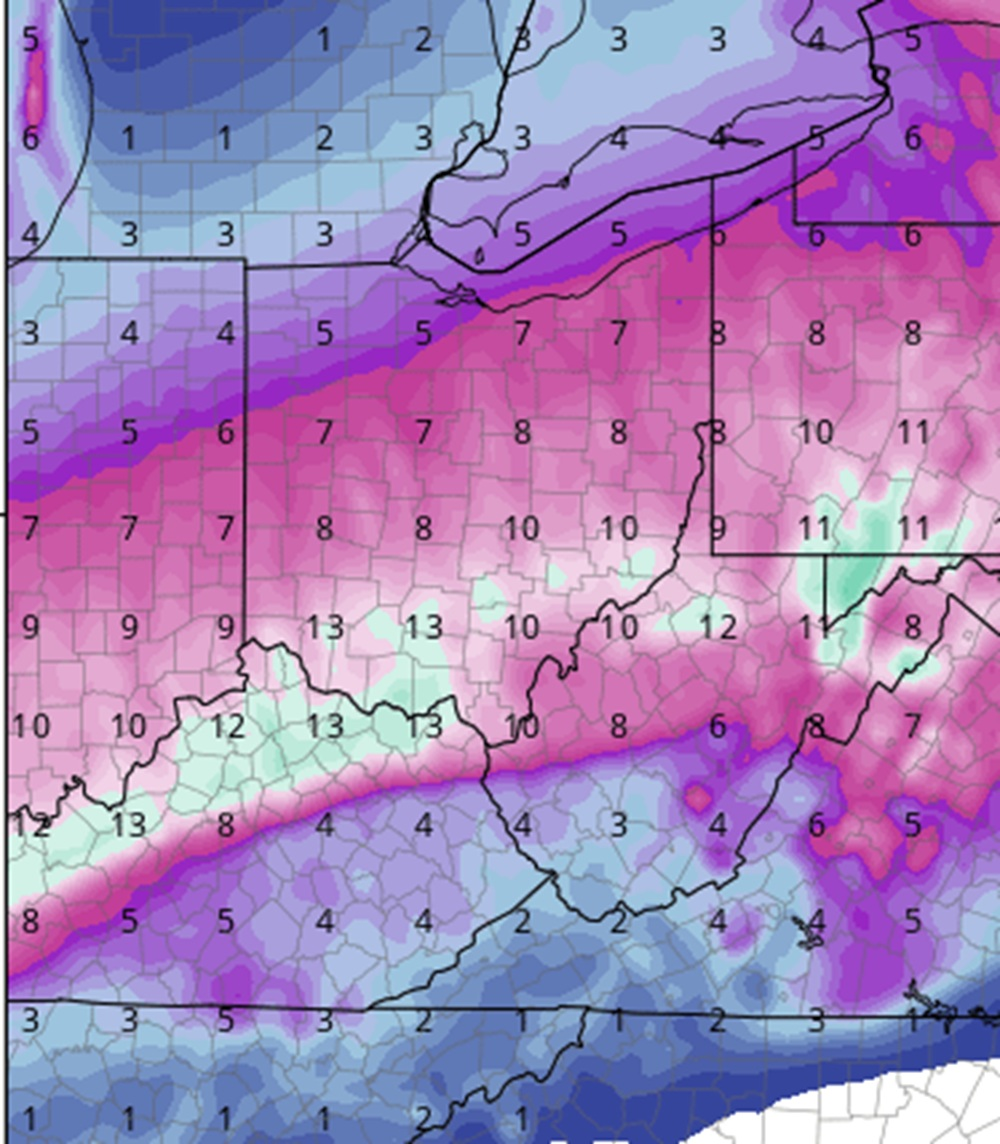
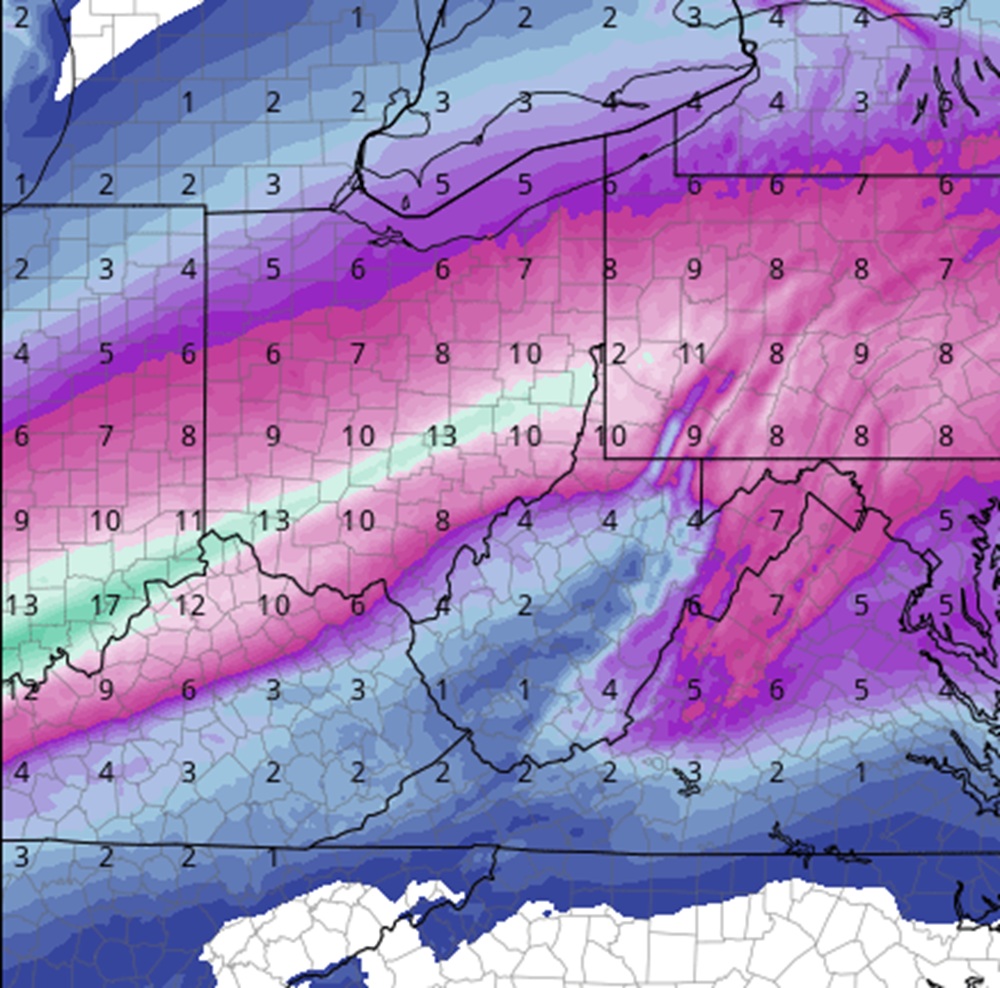
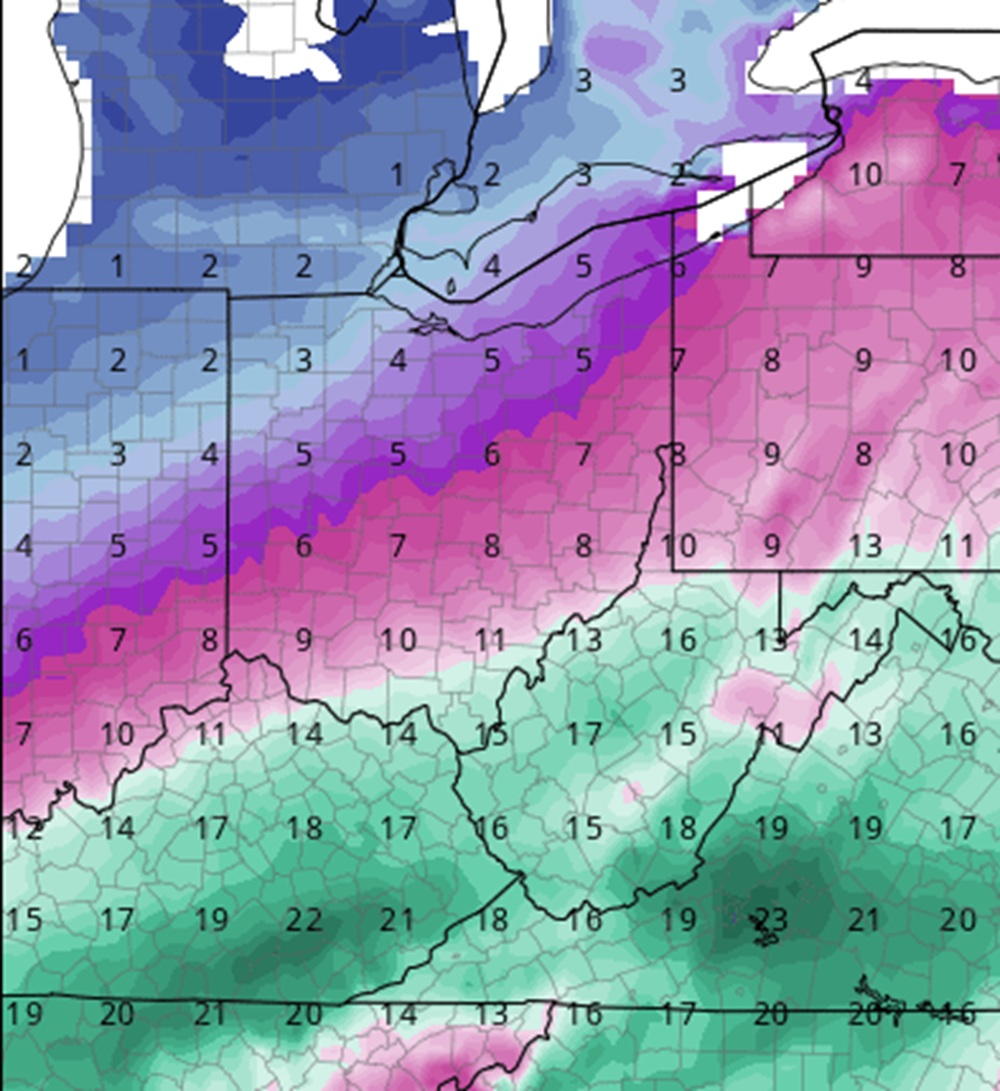
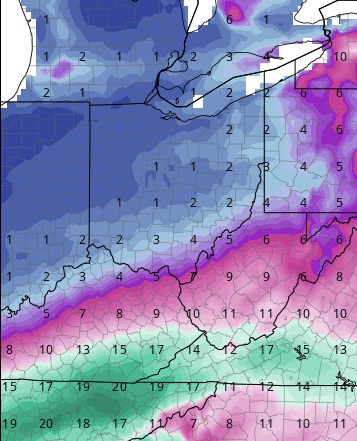
Models have gradually shifted the heaviest snows through South-Central and Central Ohio. Here are the latest model run snowfall forecast maps. 12Z NAM: 12″-14″ (True ratio) 0Z EURO: 14″-16″ (True ratio) 12Z GFS: “6-8” (10-1 ratio) 12Z GEM: 7″-9″ (10-1 ratio) 12Z ICON: 10″-12″ (True ratio)
“True ratio” is the snow amounts predicted by the total liquid precipitation multiplied by how high the snow-to-liquid ratio is predicted to be. They are essentially the full totals the model believes will fall. For 10-1 ratios on some models, these are likely to be below actual totals. The ratios for this event are highly likely to be well above 10-1, perhaps double, so GFS and GEM totals using those ratios are likely to be too low, as is the NWS forecast in the Watch. Needless to say, the models are showing the most significant snowstorm for Central Ohio since March, 2008.
As of 6PM, 1/21/2026, here were the latest snowfall maps via the various models. 18z ICON: 10″-13″ (True ratio) 18z GFS: 1″-3″ (10-1 ratio) 12z GEM: 6″-10″ (10-1 ratio) 9z Euro: 14″-16″ (True ratio) Obviously, there is a large range. The 18z GFS is notorious for bad runs, so keep that in mind. All others are showing a significant event.
In the meantime, Wilmington NWS office has issued a Winter Storm Watch for all of far southern Ohio. I would expect those watches to be issued further north sometime over the next day or so. WInter Storm Watch
**Here are this winter’s running statistical tally of Winter 2025-2026.
Cold Season data is for October-April, while Winter Season data is December-February only.
**Last Updated: 4/10/2026- Updated through March 31st, 2026
Temperatures
Average High Temperature October: 67.7 November: 51.6 December: 39.8 January: 32.7 February: 40.5 March: 60.4
Cold Season Average High to Date: 48.9 Cold Seasond Average High Departure to Date: +0.8 Winter Season Average High: 37.6 Winter Season Average High Departure: -2.3
Mean High Departure from Normal October: +2.2 November: -0.7 December: -1.7 January: -4.4 February: -0.3 March: +9.3
Average Low Temperature October: 46.8 November: 34.1 December: 23.8 January: 15.7 February: 22.4 March: 38.5
Cold Season Average Low to Date: 30.3 Cold Season Average Low Departure to Date: -0.6 Winter Season Average Low: 20.6 Winter Season Average Low Departure: -4.0
Mean Low Departure from Normal October: +2.0 November: -0.9 December: -3.8 January: -6.3 February: -0.4 March: +6.5
Mean Temperature October: 57.3 November: 42.9 December: 31.8 January: 24.2 February: 31.5 March: 49.5
Cold Season Average Mean to Date: 39.5 Cold Season Average Mean Departure to Date: 0.0 Winter Season Average Mean: 29.1 Winter Season Average Mean Departure: -3.1
Mean Departure from Normal October: +2.1 November: -0.7 December: -2.7 January: -5.4 February: -1.0 March: +7.9
Coldest High Temperature October: 51 on the 22nd and 30th November: 33 on the 10th December: 18 on the 14th January: 12 on the 28th February: 19 on the 5th March: 27 on the 17th
Coldest Low Temperature October: 34 on the 24th and 25th November: 19 on the 29th December: 1 on the 15th January: -9 on the 31st February: 0 on the 2nd March: 20 on the 17th and 18th
Coldest Mean Temperature October: 46 on the 24th and 30th November: 28.5 on the 10th and 29th December: 10 on the 15th January: 2 on the 28th February: 10.5 on the 5th March: 23.5 on the 17th
Warmest High Temperature October: 85 on the 4th November: 67 on the 5th December: 68 on the 28th January: 65 on the 9th February: 65 on the 18th March: 86 on the 22nd
Warmest Low Temperature October: 59 on the 7th November: 49 on the 15th December: 40 on the 28th January: 39 on the 9th February: 48 on the 18th March: 62 on the 31st
Warmest Mean Temperature October: 70.5 on the 3rd and 4th November: 57.5 on the 15th December: 54 on the 28th January: 52 on the 9th February: 56.5 on the 18th March: 70.5 on the 31st
Temperature Records October None November None December A record daily high was tied on the 28th. The high of 68 degrees tied the previous record set in 1984. January A record daily high was set on the 9th. The high of 65 degrees broke the old record of 62 set in 1946 and 1949. A record daily low was set on the 31st. The low of -9 degrees broke the old record of -6 set in 2004. The period of January 24-January 31st featured 8 consecutive highs below 20 degrees. This ties the record for the longest such consecutive streak, matching similar records set 1/10-1/17/1893 and 2/6-2/13/1899. February None March A daily record warm low was set on the 7th. The low of 59 degrees broke the old record of 56 set in 1974. A daily record warm low was set on the 10th. The low of 56 degrees broke the old record of 53 set in 1879. A daily record high was set on the 22nd. The high of 86 degrees broke the old record of 85 set in 2012. This also broke the record for the warmest temperature ever recorded in March.
Precipitation
Total Precipitation Days October: 7 November: 16 December: 19 January: 21 February: 14 March: 18
Cold Season Total to Date: 18.22″ Winter Season Total to Date: 6.40″
Monthly Precipitation Departure from Normal October: +0.98″ November: -0.57″ December: -0.63″ January: -1.37″ February: -0.14″ March: +2.00″
Cold Season Departure from Normal to Date: +0.27″ Winter Season Departure from Normal: -2.14″
Greatest Precipitation October: 1.84″ on the 7th November: 0.70″ on the 25th December: 0.60″ on the 18th January: 1.09″ on the 25th February: 1.14″ on the 19th March: 1.03″ on the 27th
Cold Season Total to Date: 33.9″ Winter Season Total: 28.5″
Through March 31st, the winter of 2025-2026 is the 26th snowiest on record. December was the 9th snowiest, January the 24th snowiest, February tied for 25th least snowiest and March was the 40th snowiest.
Monthly Snowfall Departure from Normal October: -0.2″ November: +0.6″ December: +7.1″ January: +3.6″ February: -4.4″ March: -0.5″
Cold Season Snowfall Departure to Date: +6.2″ Winter Season Departure from Normal: +6.3″
Greatest Snowfall October: 0″ November: 1.3″ on the 10th December: 5.4″ on the 13th January: 11.9″ on the 25th February: 1.5″ on the 6th March: 3.0″ on the 2nd
Precipitation Records October 10/7/2025: Record daily precipitation of 1.84″, breaking the old record of 1.61″ set in 1998. November None December 12/2/2025: Record daily snowfall of 4.7″, breaking the old record of 3.0″ set in 1936. 12/13/2025: Record daily snowfall of 5.4″, breaking the old record of 3.6″ set in 1945. January 1/25/2026: Record daily snowfall of 11.9″, breaking the old record of 4.7″ set in 1988. 1/25/2026: Record daily precipitation of 1.09″, breaking the old record of 0.68″ set in 1952. February None March None
Total Snow Days October: 0 November: 9 December: 12 January: 16 February: 10 March: 6
Deepest Snow Depth October: 0 November: 1″ on the 10th December: 5″ on the 2nd and 14th January: 12″ on the 26th February: 8″ on the 1st, 2nd and 3rd March: 2″ on the 2nd
Days with Snow Depth of 1″+ October: 0 November: 1 December: 11 January: 9 February: 14 March: 1
Average Daily Snow Depth by Month October: 0 November: Trace December: 1.1″ January: 2.3″ Feburary: 2.5″ March: 0.1″
Average Daily Wind Speed in MPH October: 6.8 November: 8.2 December: 9.2 January: 9.8 February: 7.6 March: 10.4
Highest Wind Gust in MPH October: 42 on the 21st November: 43 on the 5th and 26th December: 51 on the 29th January: 49 on the 19th February: 60 on the 20th March: 69 on the 22nd
Clear Days by Month October: 10 November: 4 December: 1 January: 2 February: 2 March: 2
Partly Cloudy Days by Month October: 16 November: 15 December: 12 January: 10 February: 18 March: 14
Cloudy Days by Month October: 5 November: 11 December: 18 January: 19 February: 8 March: 15
Winter 2024-2025 was the 4th season in a row in which snowfall was well below normal. Only a single winter in the past 10- 2017-2018- has had above normal snowfall, and only just. Two others- 2018-2019 and 2020-2021- had near normal snowfall, though still slightly below the 30-year average, and the other 7 have been significantly below normal. Average winter snowfall for the past decade has been just 17.8″, more than 10″ below the 1991-2020 average. Additionally, the 2024-2025 season lacked a 6″ snowfall, either daily or in any single event. There has been no 6″ snowfall since February 22, 2015, the second longest such period since records began. The December-February period was colder than normal, and it was the coldest heart of winter since 2014-2015. This was thanks largely to January, which also featured the majority of the season’s snowfall.
December-February Traditional winter numbers, 1991-2020 departures from normal where relevant, and overall winter rankings. Rankings are accurate as of the time of the post. Average High: 38.1 (-1.7) 44th Coldest Average Low: 23.6 (-0.9) 45th Coldest Mean: 30.8 (-1.4) Tied for 39th Coldest Coldest High: 11 on January 20th Coldest Low: -3 on January 22nd Coldest Mean: 5.5 on January 21st # of 32 or Below Highs: 29 (+3.2) 21st Most # of 32 or Below Lows: 72 (+3.2) 17th Most Warmest High: 65 on February 3rd Warmest Low: 51 on December 28th Warmest Mean: 57 on December 28th Precipitation: 8.11″ (-0.43″) 59th Wettest Snowfall: 14.6″ (-13.6″) 46th Least Snowy Average Daily Snow Depth: 0.6″ (-0.2″) Tied for 7th Lowest Maximum Snow Depth: 5″ on January 6th and 11th. Largest Snowstorm: 4.4″ on January 5th-6th. 1″+ Snowfall Events: 7 Tied for 8th Fewest # of Measurable Precipitation Days: 37 (-2.1) Tied for 13th Fewest # of Measurable Snowfall Days: 15 (-6.4) Tied for 11th Fewest Highest Average Daily Wind Speed in MPH: 19.2 on December 5th Highest Wind Gust in MPH: 55 on December 5th # of Clear Days: 4 4.44% # of Partly Cloudy Days: 39 43.33% # of Cloudy Days: 47 52.23%
Entire Cold Season: October-April Average High: 52.7 9th Warmest Average Low: 34.1 18th Warmest Mean: 43.4 9th Warmest Precipitation: 18.66″ 56th Wettest Snowfall: 14.8″ 29th Least Snowy Average Snow Depth: 0.3″ Tied for 4th Lowest Largest Snowstorm: 4.4″ on January 5th-6th # of 32 or Below Highs: 30 Tied for 21st Fewest # of 32 or Below Lows: 96 Tied for 17th Fewest # of Measurable Precipitation Days: 74 Tied for 9th Fewest # of Measurable Snowfall Days: 17 Tied for 8th Fewest Highest Average Daily Wind Speed in MPH: 19.2 on December 5th Highest Wind Gust in MPH: 59 on April 29th # of Clear Days: 34 16.04% # of Partly Cloudy Days: 90 42.45% # of Cloudy Days: 88 41.51%
High Temperature Records Set 11/1/2024- A record warm high of 78 was set for the date, breaking the old record of 77 set in 2022. 11/5/2024- A record warm high of 79 was set for the date, breaking the old record of 77 set in 2022. 2/3/2025- A record warm high of 65 was set for the date, breaking the old record of 63 set in 1890. 3/14/2025- A record warm high of 79 was set for the date, breaking the old record of 78 set in 1990.
Low Temperature Records Set 10/30/2024- A record warm low of 59 degrees was tied for the date, matching the previous record set in 2004. 11/5/2024- A record warm low of 62 was tied for the date, matching the old record set in 2022. 3/29/2025- A record warm low of 63 was set for the date, breaking the old record of 59 set in 1977.
Precipitation Records Set None set.
Snowfall Records Set 10/15/2024- A record 0.1″ of snowfall occurred for the date. It was the first recorded instance of measurable snowfall for the date.
Forecast for what would be Columbus’ largest snowfall of the season.
Highest Daily Precipitation by Month October 2024: 0.12″ on the 15th November 2024: 0.97″ on the 14th December 2024: 1.03″ on the 29th January 2025: 0.24″ on the 18th February 2025: 1.15″ on the 16th March 2025: 0.65″ on the 30th April 2025: 1.88″ on the 3rd
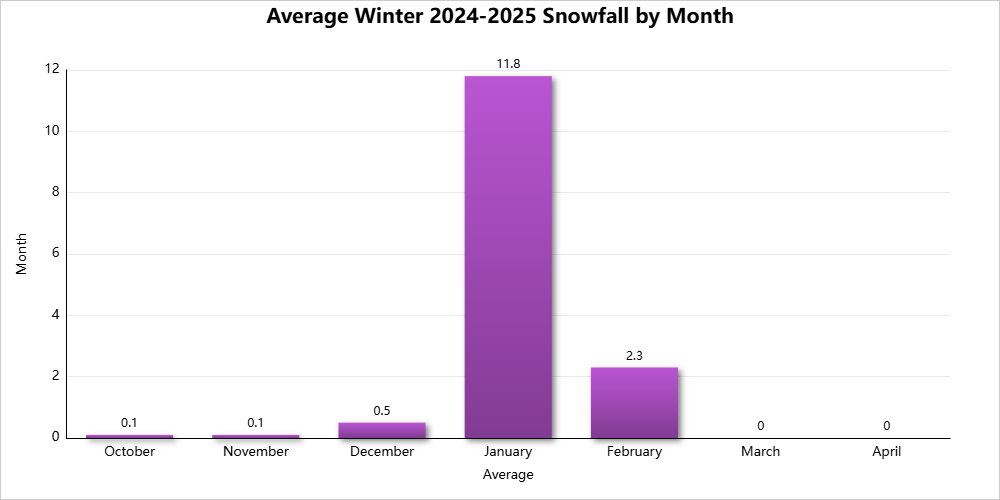
Highest Daily Snowfall By Month October 2024: 0.1″ on the 15th November 2024: 0.1″ on the 21st December 2024: 0.3″ on the 11th January 2025: 2.4″ on the 6th February 2025: 1.9″ on the 16th March 2025: Trace on multiple days. April 2025: Trace on the 6th and 7th
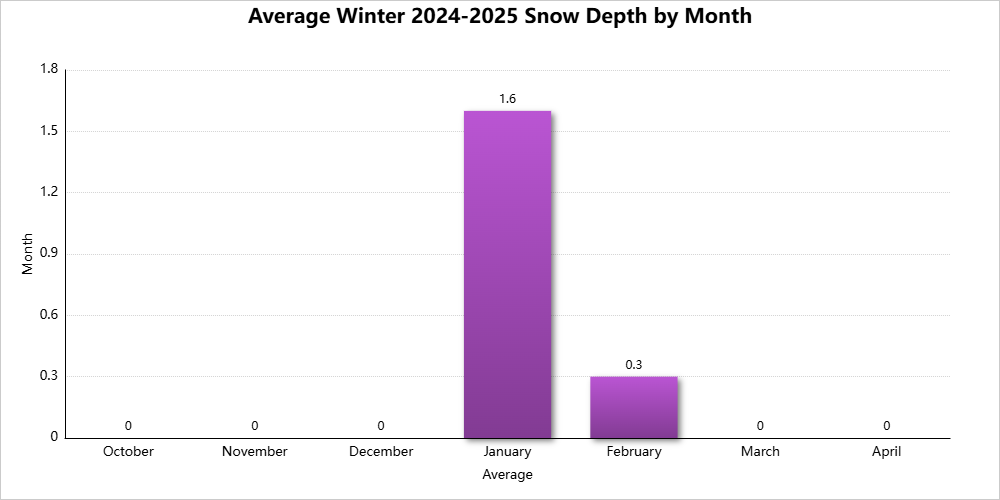
Deepest Snow Depth By Month October 2024: 0″ on all days. November 2024: Trace on the 29th December 2024: Trace on the 12th and 13th January 2025: 5″ on the 6th and 11th February 2025: 2″ on the 17th and 18th March 2025: Trace on the 17th April 2025: 0″ on all days.
Highest Wind Gust by Month in MPH October 2024: 46 on the 13th November 2024: 43 on the 20th December 2024: 55 on the 5th January 2025: 38 on the 16th February 2025: 43 on the 28th March 2025: 53 on the 30th April 2025: 59 on the 29th
Clear Days by Month October 2024: 18 58.06% November 2024: 3 10.0% December 2024: 0 0.0% January 2025: 3 9.68% February 2025: 1 3.57% March 2025: 4 12.9% April 2025: 5 16.67%
Partly Cloudy Days by Month October 2024: 12 38.71% November 2024: 11 36.67% December 2024: 12 38.71% January 2025: 13 41.94% February 2025: 14 50.0% March 2025: 17 54.84% April 2025: 11 36.66%
Cloudy Days by Month October 2024: 1 3.23% November 2024: 16 53.33% December 2024: 19 61.29% January 2025: 15 48.39% February 2025: 13 46.43% March 2025: 10 32.26% April 2025: 14 46.67%
I have been doing immediate, post-winter reviews since I began this website 13 years ago. While those posts are popular, I get tons of requests and searches for winters of decades past, so I thought it might be a good idea to periodically take a look back at some of them. By far, the winter of 1995-1996 has been at the top of the list from site visitors, so it makes sense to make it the inaugural winter of this series. Winter 1995-1996 was the most severe of the 1990s, and arguably the most severe winter between 1984-1985 and 2002-2003. The winter featured much above normal snowfall and below normal temperatures that included one arctic outbreak. This winter set multiple records that still stand today, and is regarded as one of the worst winters in Columbus- and Ohio- history.
December-February These are the statistics for the heart of Winter 1995-1996, as well as departures from average based on the current 1991-2020 normals. Average High: 36.9 (-2.9) Average Low: 21.1 (-3.4) Mean: 29.0 (-3.2) Coldest High: 6 on February 3rd Coldest Low: -3 on February 4th Coldest Mean: 3 on February 3rd and 4th # of 32 or Below Highs: 41 # of 32 or Below Lows: 73 Warmest High: 71 on February 27th Warmest Low: 57 on January 4th Warmest Mean: 64 on February 21st Precipitation: 7.84″ (+0.70″) Snowfall: 40.6″ (+18.4″) Average Daily Snow Depth: 1.8″ Maximum Snow Depth: 12″ on January 8th Largest Snowstorm: 9.8″ on January 6th-7th 1″+ Snowfall Events: 14 # of Measurable Precipitation Days: 45 # of Measurable Snowfall Days: 35 Highest Average Daily Wind Speed in MPH: 20 on January 27th Highest Wind Gust in MPH: 51 on February 24th
Entire Cold Season: October-April Average High: 47.1 Average Low: 29.1 Mean: 38.1 Precipitation: 24.14″ Snowfall: 54.1″ Average Snow Depth: 0.8″ Largest Snowstorm: 9.8″ on January 6th-7th # of 32 or Below Highs: 46 # of 32 or Below Lows: 127 # of Measurable Precipitation Days: 92 # of Measurable Snowfall Days: 49 Highest Average Daily Wind Speed in MPH: 21.6 on March 25th Highest Wind Gust in MPH: 58 on April 29th
Temperature
High Temperature Records Set On December 14th, the high reached 65 degrees, tying the record for the date set in 1901. On January 18th, the high reached 68 degrees, breaking the old record of 67 set in 1929. On February 3, the high only reached 6 degrees, breaking the old low maximum of 12 set in 1902. On February 27th, the high reached 71 degrees, tying the old record of 71 set in 1896.
Low Temperature Records Set On November 9th, the low fell to 17 degrees, breaking the old record of 18 set in 1991.
Precipitation
Precipitation Records Set On January 27th, 1.00″ of precipitation fell, breaking the old record of 0.97″ set in 1913. On November 11th, 1.03″ of precipitation fell, breaking the old record of 0.84″ set in 1974. This record was later surpassed for the date when 1.14″ fell in 2022. On December 19th, 0.68″ of precipitation fell, breaking the old record of 0.59″ set in 1982. This record was later surpassed for the date with 08.4″ in 2002 and later with 1.74″ in 2008. On April 29th, 1.82″ of precipitation fell, breaking the old record of 1.37″ set in 1893. This record was later surpassed for the date when 1.88″ fell in 2021.
Snowfall
Snowfall Records Set On November 21st, 1.9″ of snow fell, breaking the old record of 1.0″ set in 1911. On December 19th, 4.3″ of snow fell, breaking the old record of 3.2″ set in 1948. On January 7th, 8.8″ of snow fell, breaking the old record of 5.5″ set in 1979. This occurred during the Blizzard of 1996 On January 9th, 3.1″ of snow fell, breaking the old record of 2.7″ set in 1943. On March 7th, 2.3″ of snow fell, tying the old record set in 1911. This record was later surpassed when 5.0″ fell in 2008. On March 20th, 3.9″ of snow fell, breaking the old record of 3.0″ set in 1967.
Other
If you are interested in seeing original weather advisories for the entire 1995-1996 winter, the Winter 1995-1996 Weather Advisories provides them.