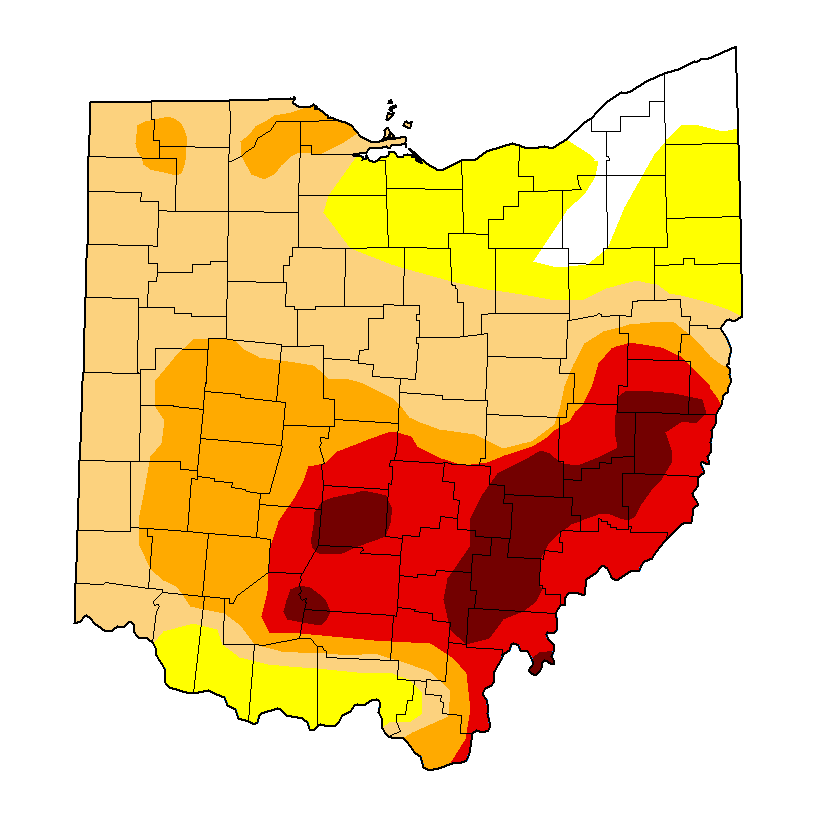
The Columbus area saw very little rain over the summer, and that trend has continued this September. This severe drought is affecting other parts of the state as well. How does the current dry period compare to the worst Columbus droughts historically, though?
2024’s longest period without measurable precipitation was 17 days, from 6/6/2024 to 6/22/2024.
However, having no precipitation at all for a significant period of time is relatively rare, and the formation of a drought usually occurs just because of low precipitation, not just no precipitation. And that’s certainly the case for 2024.
Top 10 Longest Periods with the Most Consecutive Days with 0.1″ or Less 1. 9/13/1963-10/30/1963: 48 2. 10/26/1904-12/9/1904: 45 3. 9/30/1924-11/12/1924: 44 4. 2/9/1969-3/23/1969: 43 5. 8/18/1908-9/27/1908, 6/12/1936-7/22/1936: 41 6. 10/1/1887-11/9/1887: 40 7. 7/17/1910-8/24/1910, 8/19/2024-9/26/2024: 39 8. 12/3/1955-1/9/1956: 38 9. 1/6/1944-2/10/1944, 9/29/1944-11/3/1944: 36 10. 12/14/1985-1/16/1986: 34
2024 produced the 9th longest period where daily rainfall failed to surpass 0.1″ for 39 consecutive days. Only 2 days during that period saw any measurable rainfall whatsoever.
The Summer of 2024 produced the 3rd lowest precipitation amount since reliable records began in 1879, with only the Dust Bowl years of 1930 and 1933 having slightly less. The 5.07″ that fell between June and August is extremely low. June’s precipitation was 6th lowest, July’s was a bit better at 16th lowest, and August’s was better still at 29th lowest. No month, though, saw 2″ or more, and the summer precipitation deficit was 7.68″ below normal, or less than 40% of normal. September is starting off dry as well. It’s already more than an inch below normal through the 11th, and there hasn’t been a single day with 0.1″ or more since August 18th. The forecast doesn’t show much hope, either. No rain- not even a small chance of it- is currently predicted through September 18th. If this pattern continues long enough, reservoirs may become dangerously low.
For Franklin County specifically, as of September 10th, 100% of the county is in the classification of Severe Drought, and 66.4% is classified as being in Extreme Drought.
The Winter 2023-2024 review is finally here, and it shows that yet another cold season never really showed up. 2023-2024 was a top 5 warmest winter on record. Outside of a short break in January, warmth persisted for almost the entire winter, likely courtesy of the strong El Niño. This contributed to well below normal snowfall. The below stats represent both the traditional winter season of December-February, and also the overall cold season of October-April. Rankings are accurate as to the time of the posting.
December-February Traditional winter numbers, 1991-2020 departures from normal where relevant, and overall winter rankings. Average High: 45.7 (+5.9) 5th Warmest Average Low: 30.2 (+5.7) 6th Warmest Mean: 37.9 (+5.7) 5th Warmest Coldest High: 16 on January 15th and 16th Coldest Low: 6 on January 15th and 20th Coldest Mean: 11 on January 15th # of 32 or Below Highs: 9 (-16.8) Tied for 4th Fewest # of 32 or Below Lows: 53 (-15.8) 5th Fewest Warmest High: 67 on February 26th and 27th Warmest Low: 56 on February 27th Warmest Mean: 62 on February 27th Precipitation: 9.29″ (+0.75″) 38th Wettest Snowfall: 12.4″ (-9.8″) 37th Least Snowiest Average Daily Snow Depth: 0.2″ (-0.6″) Tied for 3rd Lowest Maximum Snow Depth: 4″ on February 17th Largest Snowstorm: 4.4″ on February 16th 1″+ Snowfall Events: 3 Tied for 4th Fewest # of Measurable Precipitation Days: 37 (-2.1) Tied for 13th Fewest # of Measurable Snowfall Days: 13 (-8.4) Tied for 9th Fewest Highest Average Daily Wind Speed in MPH: 20.8 on January 13th Highest Wind Gust in MPH: 53 on February 28th # of Clear Days: 12 13.19% # of Partly Cloudy Days: 23 25.27% # of Cloudy Days: 56 61.54%
Entire Cold Season: October-April Average High: 54.7 2nd Warmest Average Low: 36.6 6th Warmest Mean: 45.6 3rd Warmest Precipitation: 22.82″ 32nd Wettest Snowfall: 12.6″ 22nd Least Snowiest Average Snow Depth: 0.1″ Tied for 2nd Lowest Largest Snowstorm: 4.4″ on February 16th # of 32 or Below Highs: 10 Tied for 1st Fewest # of 32 or Below Lows: 84 7th Fewest # of Measurable Precipitation Days: 76 Tied for 11th Fewest # of Measurable Snowfall Days: 14 Tied for 5th Fewest Highest Average Daily Wind Speed in MPH: 20.8 on January 13th Highest Wind Gust in MPH: 53 on February 28th # of Clear Days: 30 14.1% # of Partly Cloudy Days: 62 29.1% # of Cloudy Days: 121 56.8%
Average High By Month October 2023: 67.0 Tied for 34th Warmest November 2023: 54.8 Tied for 18th Warmest December 2023: 48.4 5th Warmest January 2024: 37.4 Tied for 50th Warmest February 2024: 51.8 Tied for 2nd Warmest March 2024: 56.6 12th Warmest April 2024: 66.9 Tied for 12th Warmest
High Temperature Records Set 2/28/2024- A record high of 67 was set, breaking the old record of 65 set in 1939.
Average Low By Month October 2023: 48.2 Tied for 21st Warmest November 2023: 33.7 Tied for 33rd Coldest December 2023: 35.3 2nd Warmest January 2024: 25.9 27th Warmest February 2024: 29.2 16th Warmest March 2024: 36.4 Tied for 19th Warmest April 2024: 47.0 3rd Warmest
Low Temperature Records Set 10/28/2023- A record warm minimum of 62 was set, breaking the old record of 61 set in 1918. 2/10/2024- A record warm minimum of 49 was set, breaking the old record of 47 set in 1938. 2/27/2024- A record warm minimum of 56 was set, breaking the old record of 48 set in 1996.
Mean By Month October 2023: 57.6 22nd Warmest November 2023: 44.2 Tied for 26th Warmest December 2023: 41.8 Tied for 4th Warmest January 2024: 31.7 Tied for 43rd Warmest February 2024: 40.5 5th Warmest March 2024: 46.5 Tied for 14th Warmest April 2024: 57.0 6th Warmest
Precipitation By Month October 2023: 3.11″ Tied for 34th Wettest November 2023: 1.89″ 40th Driest December 2023: 3.25″ Tied for 44th Wettest January 2024: 4.81″ 16th Wettest February 2024: 1.23″ 20th Driest March 2024: 2.66″ 49th Driest April 2024: 5.87″ 8th Wettest
Precipitation Records Set 1/9/2024- A record of 1.44″ was set, breaking the old record of 0.86″ set in 1898. 2/2/2024- A record of 2.05″ was set, breaking the old record of 1.51″ set in 1977.
Snowfall By Month October 2023: Trace Tied for 2nd Least Snowiest November 2023: Trace Tied for 2nd Least Snowiest December 2023: 0.4″ Tied for 6th Least Snowiest January 2024: 5.0″ Tied for 37th Least Snowiest February 2024: 7.0″ Tied for 40th Snowiest March 2024: 0.2″ Tied for 3rd Least Snowiest April 2024: Trace Tied for 2nd Least Snowiest
2023-2024 was the 9th consecutive season that had no snowfall events above 5″. This is the 2nd longest such period on record, surpassed only by the 14-year stretch of 1919-1933.
Average Snow Depth By Month October 2023: 0.0″ November 2023: Trace December 2023: Trace January 2024: 0.2″ February 2024: 0.4″ March 2024: 0.0″ April 2024: 0.0″
Maximum High By Month October 2023: 87 on the 2nd and 3rd November 2023: 73 on the 8th December 2023: 62 on the 25th January 2024: 61 on the 26th February 2024: 67 on the 26th and 27th March 2024: 75 on the 4th April 2024: 84 on the 16th and 29th
Minimum High By Month October 2023: 47 on the 31st November 2023: 30 on the 28th December 2023: 34 on the 19th January 2024: 16 on the 15th and 16th February 2024: 27 on the 17th March 2024: 36 on the 18th April 2024: 45 on the 5th
Maximum Low By Month October 2023: 63 on the 5th November 2023: 46 on the 7th December 2023: 51 on the 26th January 2024: 48 on the 25th February 2024: 56 on the 27th March 2024: 51 on the 5th April 2024: 64 on the 27th and 28th
Minimum Low By Month October 2023: 29 on the 31st November 2023: 17 on the 29th December 2023: 22 on the 14th January 2024: 6 on the 15th and 20th February 2024: 13 on the 18th March 2024: 23 on the 21st and 24th April 2024: 31 on the 7th
Highest Daily Precipitation by Month October 2023: 0.72″ on the 19th November 2023: 0.93″ on the 21st December 2023: 0.6″ on the 17th January 2024: 1.44″ on the 9th February 2024: 0.72″ on the 22nd March 2024: 0.44″ on the 26th April 2024: 2.05″ on the 2nd
Highest Daily Snowfall By Month October 2023: Trace on the 31st November 2023: Trace on the 27th December 2023: 0.3″ on the 18th January 2024: 2.2″ on the 19th February 2024: 4.4″ on the 16th March 2024: 0.2″ on the 10th April 2024: Trace on the 4th and 17th
Deepest Snow Depth By Month October 2023: 0.0″ on all days. November 2023: 0.0″ on all days. December 2023: Trace on the 19th January 2024: 2″ on the 20th February 2024: 4″ on the 17th March 2024: 0.0″ on all days. April 2024: 0.0″ on all days.
Average Daily Wind Speed by Month in MPH October 2023: 7.0 November 2023: 7.2 December 2023: 7.3 January 2024: 9.2 February 2024: 8.0 March 2024: 9.3 April 2024: 9.4
Highest Wind Gust by Month in MPH October 2023: 34 on the 6th November 2023: 35 on the 27th December 2023: 43 on the 18th January 2024: 44 on the 13th February 2024: 53 on the 28th March 2024: 47 on the 14th April 2024: 43 on the 12th and 17th
Clear Days by Month October 2023: 5 16.13% November 2023: 10 33.33% December 2023: 4 12.9% January 2024: 0 0.0% February 2024: 7 24.14% March 2024: 3 9.68% April 2024: 3 10.0%
Partly Cloudy Days by Month October 2023: 11 35.48% November 2023: 13 43.33% December 2023: 7 22.58% January 2024: 8 25.81% February 2024: 17 58.62% March 2024: 18 58.06% April 2024: 15 50.0%
Cloudy Days by Month October 2023: 15 48.39% November 2023: 7 23.33% December 2023: 20 64.52% January 2024: 23 74.19% February 2024: 5 17.24% March 2024: 10 32.26% April 2024: 12 40.0%
The overall cold period saw relatively fewer cloudy days than normal. December and January were cloudier than normal, but November, February and March were less so than normal.
Other Notable Winter 2023-2024 Events
The Columbus Tornado History page gives greater detail on the February 28th, March 14th and April 2nd tornadic events.
A small snow event should affect the Columbus area today into tomorrow morning, with forecasts calling for up to 2″ of snow when all’s said and done. While by no means a significant event, it could end up being one of the largest snowfalls of the entire 2023-2024 winter season. The reason- El Niño.
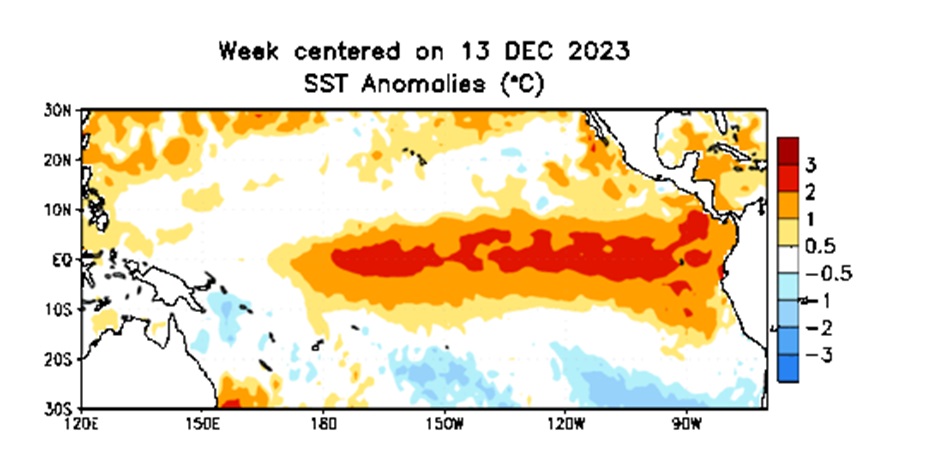
El Niño winters in Ohio tend to be much warmer than normal with much below normal snowfall. This is especially true when the El Niño is moderate to strong, as it is now. Let’s take a look back at how different ENSO states (or El Nino Southern Oscillation) produced different results in Columbus winter history.
ENSO conditions come in 3 different forms- El Niño, which is when the Equatorial Pacific is warmer than normal, Neutral, when the waters are neither cold nor warm, and La Niña, which features colder than normal Equatorial Pacific waters. Since the 1950-1951 season, there have been 24 Neutral seasons, 25 La Niña seasons and 25 El Niño seasons, so the breakdown has been very even. Because there is a lag because Pacific water temperatures and atmospheric response, the conditions that affect winter weather can typically be traced back to Fall water temperatures rather than winter. To see how 2023-2024 might shape up, we have to look at the September-October-November Pacific water temperature anomalies. During that time, the anomaly was +1.8. Which seasons had an anomaly of +1.5 to +2 during September-October-November? As it turns out, not very many- only 1965, 1972, 1982 and 1987.
How were those 4 subsequent winters in terms of temperature and snowfall? Mean Temperature 1965-1966: 29.4 1972-1973: 32.8 1982-1983: 34.7 1987-1988: 30.5 Avg: 31.9 Temperatures overall were somewhat split, with 2 winters being slightly below normal and 2 winters with well-above normal temperatures, with the average of the 4 being slightly above. Snowfall 1965-1966: 17.5″ 1972-1973: 24.5″ 1982-1983: 11.5″ 1987-1988: 23.9″ Avg: 19.4″ Snowfall was well below normal in all 4 seasons, with an average of about 8″ below normal. The snowfall that did fall typically came in 1-2 moderate events with very little otherwise. 1965-1966 5.9″ 1/22/66 3.7″ 2/1/66 1.2″ 1/29/66 1965-1966 had a few moderate events, but the 3 days here were the only 3 days during the entire winter that featured an inch or more of daily snowfall. This winter also occurred during a generally snowier, colder decade. 1972-1973 6.3″ 4/12/1973 4.0″ 11/30/1972 2.1″ 3/17/1973 1972-1973 again featured a few moderate events as well that contained the bulk of the season’s snow. The interesting thing about this winter is that those events occurred outside of the main December-January-February heart of winter. 1982-1983 1.9″ 2/6/1983, 3/11/1983 1.1″ 1/15/1983 1.0″ 12/10/1982 1982-1983 ended up being what’s called a Super ENSO event, with a very strong El Niño. Temperatures were very warm the entire winter, and snowfall was less than 50% of normal. 1987-1988 4.7″ 1/25/1988 1.8″ 12/3/1987 1.6″ 2/11/1988 1987-1988 only had a single moderate event, with most other snowfalls during the season amounting to a few tenths.
Bottom line: Don’t expect major snowfalls this winter.
Now, these are just 4 seasons. Other slightly stronger or weaker El Niño seasons produced very different results. Furthermore, the orientation of where the warmest water is in the Pacific can have very different outcomes. For example, if the warmer water is hugging the coast of South America, winters tend to be warmer and snowless, but if that warmer water is centered further west in the Pacific, winters can be very cold and snowy. For example, both the winters of 2002-2003 and 2009-2010 were west-based El Niño seasons, and they were historically snowy and cold winters. 2023-2024 is decidedly an east-based Niño, however, so it’s unlikely we will see anything but a rather boring winter with warmer than normal temperatures and below average snowfall. Obviously, depending on your viewpoint, that could be a very good thing.
The Winter 2022-2023 Review shows that the season was one of the warmest ever recorded for Columbus, with near consistent above average- and sometimes record-breaking temperatures. Snow, as a consequence, was well below average.
The rankings below are good through the 2022-2023 season.
December-February Only Average High: 45.8 4th Warmest Average Low: 29.4 7th Warmest Mean: 37.6 5th Warmest Precipitation: 7.80″ 62nd Wettest Snowfall: 11.2″ 30th Least Snowy Average Daily Snow Depth: 0.3″ Tied for 4th Lowest Largest Snowstorm: 4.9″ on 12/23/2022 # of 32 or Below Highs: 10 5th Fewest # of 32 or Below Lows: 51 Tied for 4th Fewest # of Measurable Precipitation Days: 40 Tied for 13th Most # of Measurable Snowfall Days: 10 Tied for 6th Fewest Highest Average Daily Wind Speed in MPH: 23.3 on 12/23/2022 Highest Wind Gust in MPH: 54 on 1/19/2023 # of Clear Days: 6 6.67% # of Partly Cloudy Days: 38 42.22% # of Cloudy Days: 46 51.11%
Early winter ended up being the coldest and snowiest part of the season, with every subsequent month getting warmer. There were very few freezing days during the heart of the winter, and despite a somewhat stormy pattern with seemingly endless windy days, there was relatively little precipitation.
The biggest snowstorm was on December 23rd, when a very strong low pressure system and cold front brought heavy snow and very cold temperatures, making for one of the coldest Christmas Eves and Days in many years.
Entire Cold Season: October-April Average High: 53.8 3rd Warmest Average Low: 34.5 Tied for 14th Warmest Mean: 44.1 Tied for 6th Warmest Precipitation: 19.13″ 63rd Driest Snowfall: 14.5″ Tied for 21st Least Snowy Average Snow Depth: 0.1″ Tied for 2nd Lowest Largest Snowstorm: 4.9″ on 12/23/2022 # of 32 or Below Highs: 11 Tied for 2nd Fewest # of 32 or Below Lows: 83 6th Fewest # of Measurable Precipitation Days: 79 Tied for 14th Fewest # of Measurable Snowfall Days: 15 Tied for 6th Fewest Highest Average Daily Wind Speed in MPH: 23.3 on 12/23/2022 Highest Wind Gust in MPH: 59 on 3/3/2023 # of Clear Days: 30 14.15% # of Partly Cloudy Days: 95 44.81% # of Cloudy Days: 87 41.04%
The entire cold season didn’t really live up to its name. All months except October ended up above normal. Now let’s break down those months individually.
Average High By Month October 2022: 65.6 44th Warmest November 2022: 54.6 Tied for 19th Warmest December 2022: 41.8 Tied for 36th Warmest January 2023: 43.8 13th Warmest February 2023: 52.3 1st Warmest March 2023: 52.6 33rd Warmest April 2023: 65.7 20th Warmest
February, 2023 had the warmest average high mean on record, beating the next closest year- 2017- by 0.5 degrees.
Average Low By Month October 2022: 42.7 Tied for 28th Coldest November 2022: 36.0 29th Warmest December 2022: 27.4 Tied for 40th Warmest January 2023: 31.0 6th Warmest February 2023: 30.0 10th Warmest March 2023: 32.1 Tied for 45th Warmest April 2023: 42.0 Tied for 35th Warmest
Mean By Month October 2022: 54.1 Tied for 33rd Coldest November 2022: 45.3 Tied for 18th Warmest December 2022: 34.6 Tied for 37th Warmest January 2023: 37.4 10th Warmest February 2023: 41.1 3rd Warmest March 2023: 42.4 Tied for 40th Warmest April 2023: 53.9 Tied for 23rd Warmest
Precipitation By Month October 2022: 0.60″ 11th Driest November 2022: 2.34″ 58th Driest December 2022: 2.02″ 39th Driest January 2023: 4.16″ 28th Wettest February 2023: 1.62″ Tied for 41st Driest March 2023: 5.22″ 17th Wettest April 2023: 3.17″ Tied for 64th Wettest
Snowfall By Month October 2022: Trace Tied for 2nd Least Snowy November 2022: 0.3″ Tied for 5th Least Snowy December 2022: 5.8″ 38th Snowiest January 2023: 5.4″ Tied for 39th Least Snowy February 2023: Trace 1st Least Snowy March 2023: 1.0″ Tied for 10th Least Snowy April 2023: Trace Tied for 2nd Least Snowy
February’s Trace was the lowest ever recorded for the month.
Average Snow Depth By Month October 2022: 0.0″ November 2022: 0.0″ December 2022: 0.7″ January 2023: 0.1″ February 2023: 0.0″ March 2023: 0.0″ April 2023: 0.0″
Maximum High By Month October 2022: 77 on the 6th, 23rd and 24th November 2022: 77 on the 5th December 2022: 65 on the 30th January 2023: 62 on the 3rd February 2023: 73 on the 23rd March 2023: 75 on the 1st April 2023: 84 on the 20th
Maximum High Records -The 77 on November 5th was a record for the date, beating the old record of 76 set in 1977. – The 65 on December 30th was a record for the date, beating the old record of 63 set in 1964. -The 72 on February 9th was a record for the date, beating the old record of 66 set in 2001. -The 72 on February 15th was a record for the date, beating the old record of 70 set in 1954. -The 73 on February 23rd was a record for the date, beating the old record of 72 set in 2017. -The 75 on March 1st was a record for the date, beating the old record of 65 set in 1972 and 1997.
Minimum High By Month October 2022: 45 on the 18th November 2022: 30 on the 20th December 2022: 14 on the 24th January 2023: 26 on the 31st February 2023: 30 on the 1st March 2023: 33 on the 14th April 2023: 46 on the 2nd and 17th
Maximum Low By Month October 2022: 57 on the 31st November 2022: 62 on the 5th December 2022: 54 on the 30th January 2023: 56 on the 3rd February 2023: 47 on the 15th March 2023: 47 on the 23rd April 2023: 60 on the 5th
Maximum Low Records -The 62 on November 6th was a record for the date, beating the old record of 61 set in 1977. -The 49 on January 2nd tied the record for the date, matching 1997, 2000 and 2005. -The 56 on January 3rd was a record for the date, beating the old record of 55 set in 1997.
Minimum Low By Month October 2022: 32 on the 20th November 2022: 17 on the 20th December 2022: -7 on the 23rd January 2023: 16 on the 15th February 2023: 12 on the 4th March 2023: 18 on the 19th April 2023: 29 on the 25th
Highest Daily Precipitation by Month October 2022: 0.15″ on the 12th and 30th November 2022: 1.14″ on the 11th December 2022: 0.44″ on the 15th January 2023: 0.73″ on the 12th February 2023: 0.73″ on the 27th March 2023: 1.6″ on the 3rd April 2023: 0.91″ on the 5th
Precipitation Records -The 1.14″ on November 11th set a record for the date, beating the old record of 1.03″ set in 1995. -The 1.60″ on March 3rd set a record for the date, beating the old record of 1.31″ set in 2020.
Highest Daily Snowfall By Month October 2022: Trace on the 18th November 2022: 0.2″ on the 12th December 2022: 4.9″ on the 23rd January 2023: 3.0″ on the 22nd February 2023: Trace on the 3rd and 17th March 2023: 0.4″ on the 12th and 13th April 2023: Trace on the 17th
Deepest Snow Depth By Month October 2022: 0.0″ November 2022: Trace on the 13th December 2022: 4″ on the 23rd, 24th, 25th and 27th January 2023: 2″ on the 23rd February 2023: Trace on the 1st March 2023: 1″ on the 14th April 2023: 0.0″
Average Daily Wind Speed by Month in MPH October 2022: 7.9 November 2022: 8.2 December 2022: 8.0 January 2023: 8.4 February 2023: 9.7 March 2023: 10.0 April 2023: 8.1
Highest Wind Gust by Month in MPH October 2022: 38 on the 26th November 2022: 44 on the 27th and 30th December 2022: 46 on the 23rd January 2023: 54 on the 19th February 2023: 49 on the 9th March 2023: 59 on the 3rd April 2023: 50 on the 1st
Clear Days by Month October 2022: 8 25.81% November 2022: 6 20.0% December 2022: 2 6.45% January 2023: 0 0.0% February 2023: 4 14.29% March 2023: 5 16.13% April 2023: 5 16.67%
Partly Cloudy Days by Month October 2022: 17 54.84% November 2022: 13 43.33% December 2022: 10 32.26% January 2023: 13 41.94% February 2023: 15 53.57% March 2023: 15 48.39% April 2023: 12 40.0%
Cloudy Days by Month October 2022: 6 19.35% November 2022: 11 36.67% December 2022: 19 61.29% January 2023: 18 58.06% February 2023: 9 32.14% March 2023: 11 35.48% April 2023: 13 43.33%
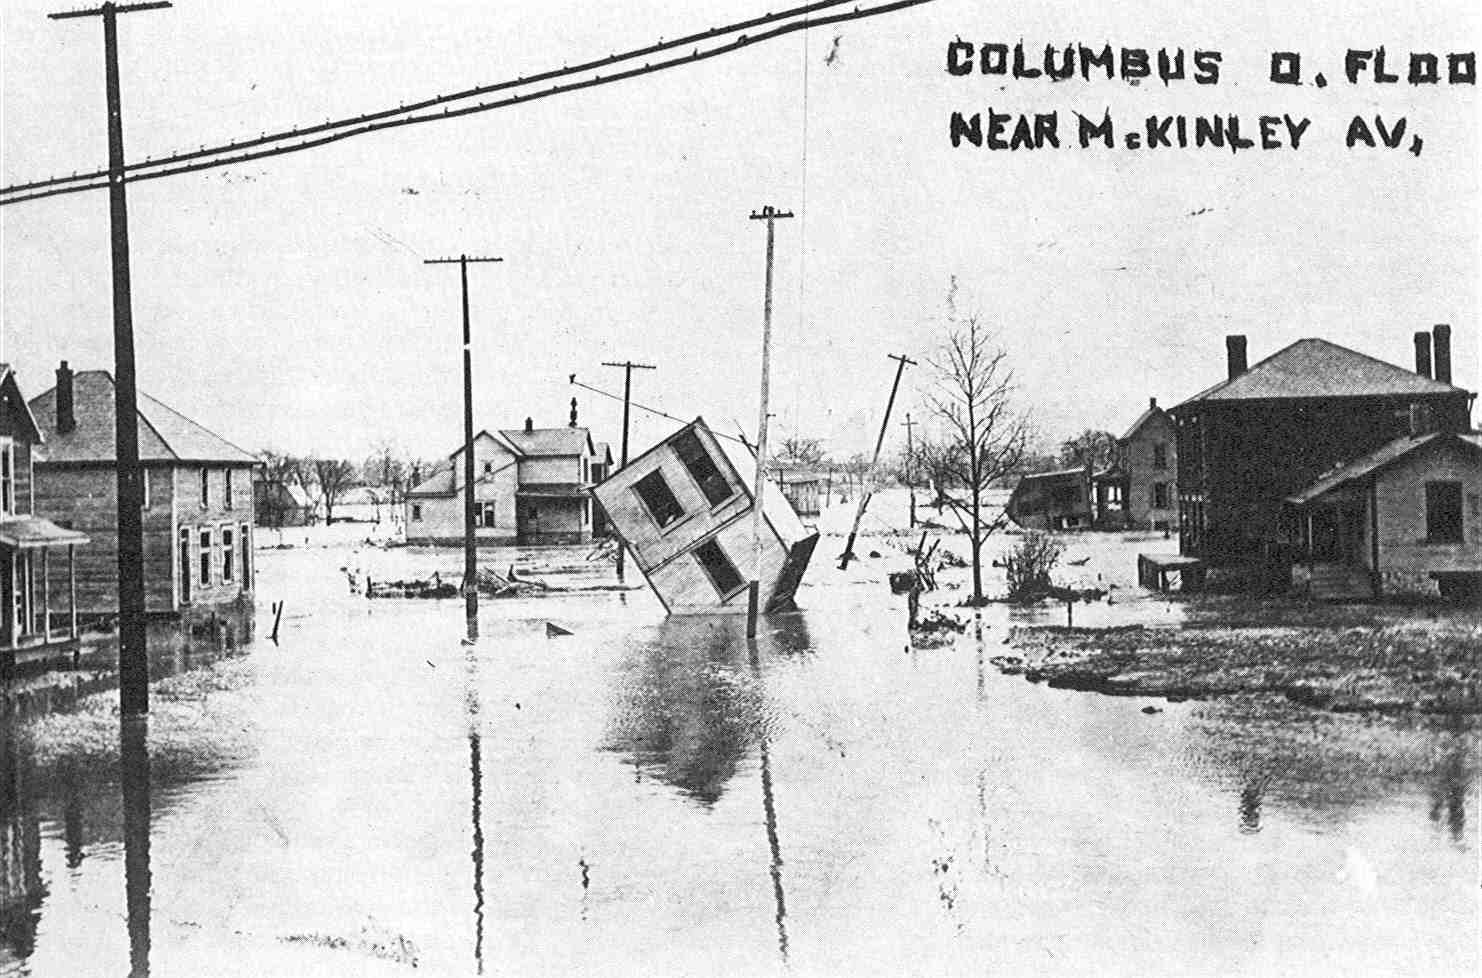
Photo Location: Intersection of McKinley Avenue and North Souder Avenue, looking west. Photo Date: March, 1913 Photo History: The Great Flood of 1913 was the most devastating and deadly flood in Ohio history. 6″-12″ of rain fell between March 23-27, 1913 as two weather systems followed one after the other. Most of the rain fell across the headwaters of major rivers, including the Scioto. The subsequent flood destroyed levees in Columbus and flooded parts of Franklinton- among other areas- with up to 17′ of water with a record crest. The entire riverfront suffered heavy damage with hundreds of buildings damaged or destroyed. 100 people were reportedly killed around the city. Floods like 1913- and later in 1959- eventually led to the federal government limiting new development and investment in Franklinton, which caused it to decline for decades. It wasn’t until 2004 with the completion of the Franklinton floodwall that those limitations were lifted.
The same view today.
Columbus wasn’t the only victim of this great flood. Virtually every major city saw some significant impact, but Dayton arguably got it much worse than any other.