After a very long delay, the 2020 Census data has arrived! In this first series of related posts, we will compared Columbus to national peer and Midwest metro areas. Metros used here are those that were within 1.5-2.5 million in either 2010 or 2020, as well as Midwest metros of 500,000 or more in either 2010 or 2020, and all Ohio metros.
Total Population by Metro Area by Year
Green metros moved up in the rankings 2010-2020 and red moved down.
Rank | 2010 | 2020 |
1 | Chicago: 9,461,105 | Chicago: 9,618,502 |
2 | Detroit: 4,296,250 | Detroit: 4,392,041 |
3 | Minneapolis: 3,346,859 | Minneapolis: 3,690,261 |
4 | St. Louis: 2,787,701 | St. Louis: 2,820,253 |
5 | Pittsburgh: 2,356,285 | Orlando: 2,673,376 |
6 | Charlotte: 2,243,960 | Charlotte: 2,660,329 |
7 | Portland: 2,226,009 | San Antonio: 2,558,143 |
8 | Sacramento: 2,149,127 | Portland: 2,512,859 |
9 | San Antonio: 2,142,508 | Sacramento: 2,379,382 |
10 | Cincinnati: 2,137,667 | Pittsburgh: 2,370,930 |
11 | Orlando: 2,134,411 | Austin: 2,283,371 |
12 | Cleveland: 2,077,240 | Las Vegas: 2,265,461 |
13 | Kansas City: 2,009,240 | Cincinnati: 2,256,884 |
14 | Las Vegas: 1,951,269 | Kansas City: 2,192,035 |
15 | Columbus: 1,901,974 | Columbus: 2,138,926 |
16 | Indianapolis: 1,887,877 | Indianapolis: 2,111,040 |
17 | San Jose: 1,836,911 | Cleveland: 2,088,251 |
18 | Austin: 1,716,289 | San Jose: 2,000,251 |
19 | Virginia Beach: 1,713,954 | Nashville: 1,989,519 |
20 | Nashville: 1,646,200 | Virginia Beach: 1,799,674 |
21 | Providence: 1,600,852 | Providence: 1,676,579 |
22 | Milwaukee: 1,555,908 | Jacksonville: 1,605,848 |
23 | Jacksonville: 1,345,596 | Milwaukee: 1,574,731 |
24 | Grand Rapids: 993,670 | Grand Rapids: 1,087,592 |
25 | Omaha: 865,350 | Omaha: 967,604 |
26 | Dayton: 799,232 | Dayton: 809,248 |
27 | Akron: 703,200 | Des Moines: 707,915 |
28 | Toledo: 651,429 | Akron: 701,449 |
29 | Wichita: 623,061 | Madison: 670,447 |
30 | Des Moines: 606,475 | Wichita: 643,768 |
31 | Madison: 605,435 | Toledo: 641,549 |
32 | Youngstown: 565,773 | Lansing: 548,248 |
33 | Lansing: 534,684 | Youngstown: 531,420 |
34 | Canton: 404,422 | Canton: 396,669 |
Columbus largely held its own in the rankings this decade, but it poised to eventually pass a few of the metros currently ahead of it.
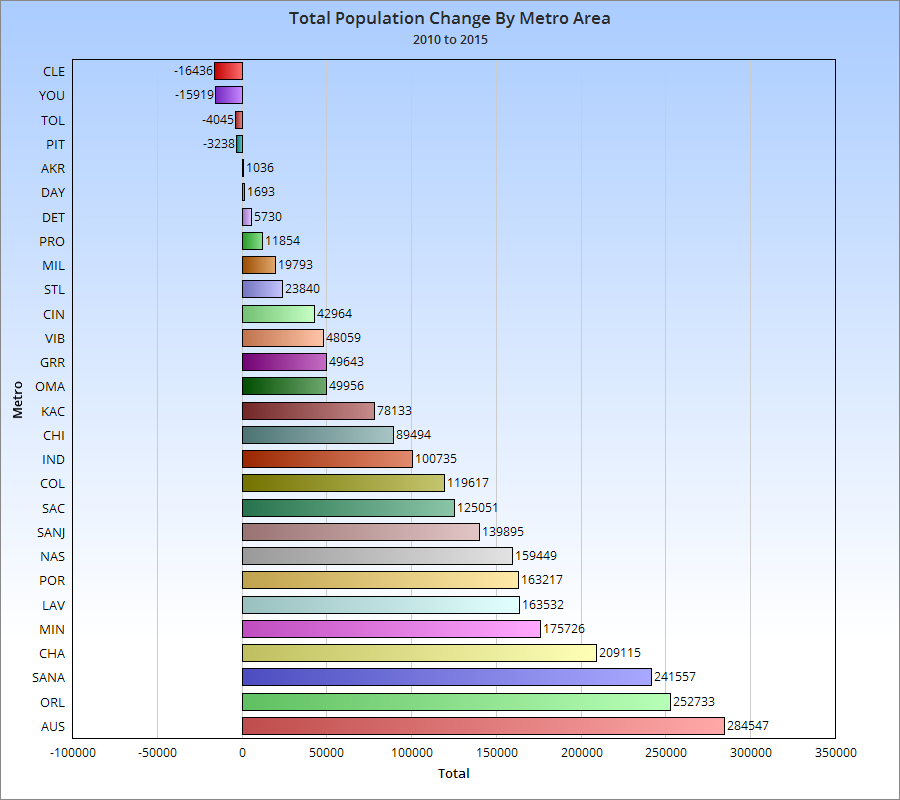
Total Metro Growth by Metro 2010-2020
1. Austin: +567,082
2. Orland: +538,965
3. Charlotte: +416,369
4. San Antonio: +415,635
5. Minneapolis: +343,402
6. Nashville: +343,319
7. Las Vegas: +314,192
8. Portland: +286,850
9. Jacksonville: +260,252
10. Sacramento: +248,255
11. Columbus: +236,952
12. Indianapolis: +223,163
13. Kansas City: +182,693
14. San Jose: +163,557
15. Chicago: +157,397
16. Cincinnati: +119,217
17. Omaha: +102,254
18. Des Moines: +101,440
19. Detroit: +95,791
20. Grand Rapids: +93,922
21. Virginia Beach: +85,720
22. Providence: +75,727
23. Madison: +65,012
24. St. Louis: +32,552
25. Wichita: +20,707
26. Milwaukee: +18,823
27. Pittsburgh: +14,645
28. Lansing: +13,564
29. Cleveland: +11,011
30. Dayton: +10,016
31. Akron: -1,751
32. Canton: -7,753
33. Toledo: -9,880
34. Youngstown: -34,353
Columbus had the 2nd highest growth in the Midwest after Minneapolis, and is growing much faster than 3 metros currently ranked ahead of it- Cincinnati, Kansas City and Pittsburgh- which it will likely pass at some point in the future. For Cincinnati, for example, current growth rates would suggest Columbus will pass it sometime around 2027. In any event, Columbus’ metro growth was the highest in its history, and about 10,000 more than occurred during the 2000s.
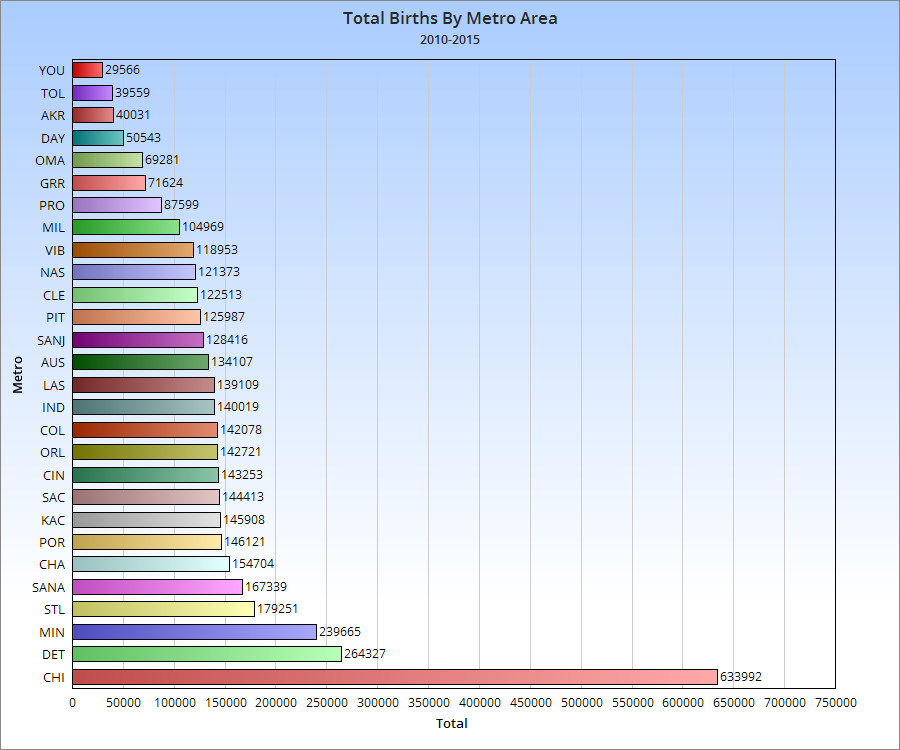
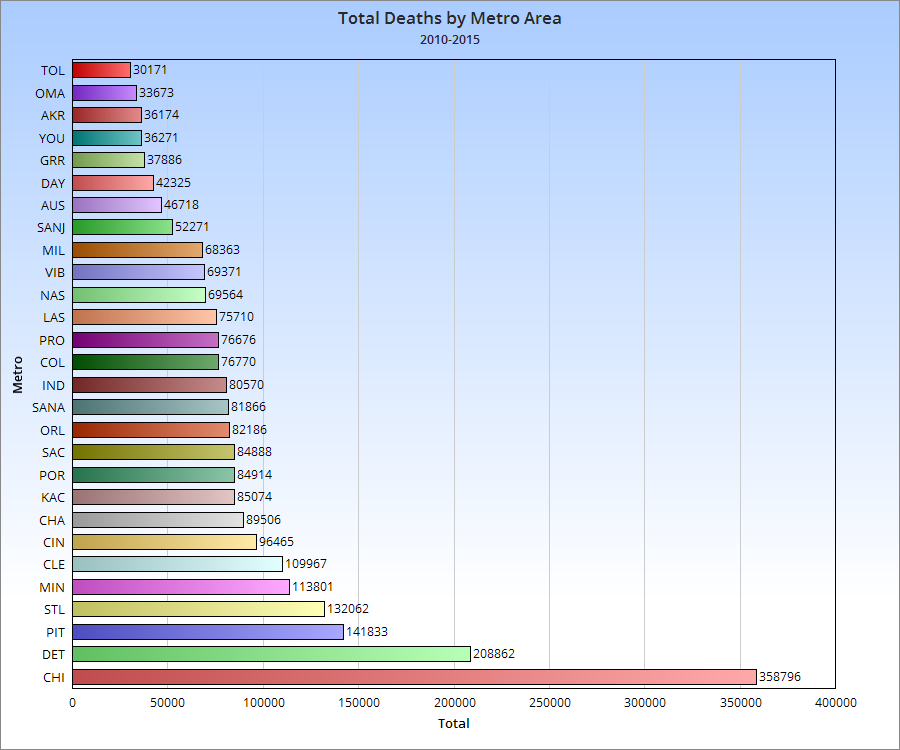
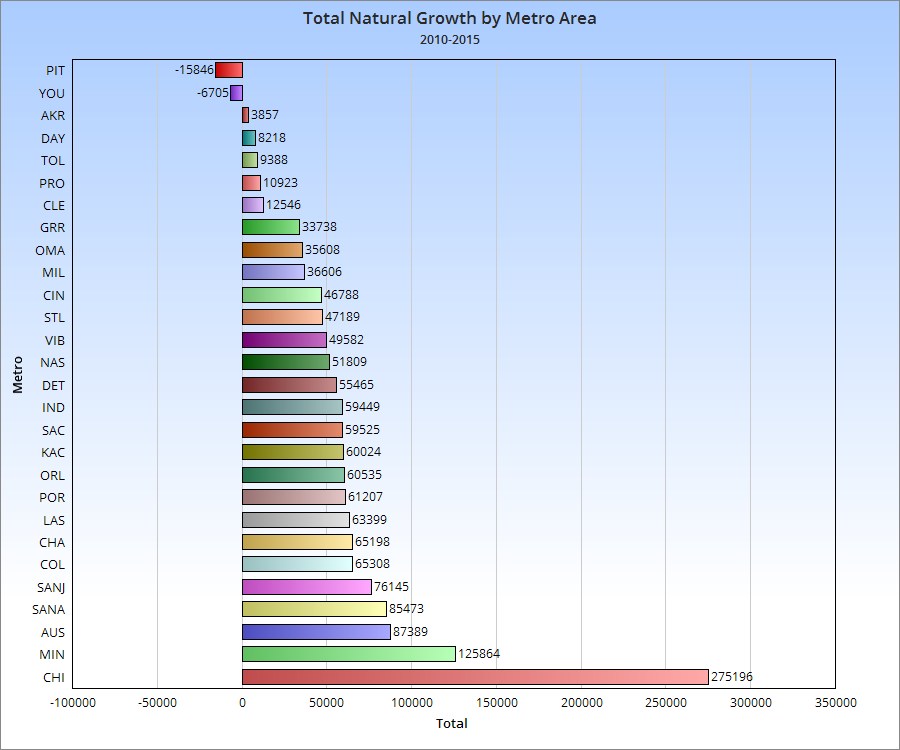
Data related to metro components of growth, such as immigration and deaths vs. births, have yet to be released. Those should come out sometime next month, and will be posted here when they do.