2025 county and metro area population estimates have been released by the US Census. These numbers are for the change between July, 2024 and July, 2025.
The Census has released 2019 metro population estimates. This comparison uses those figures to rank the Columbus metro with other metros under the following categories: Ohio metros with at least 250,000 people. Midwest metros with at least 500,000 people. National metros with 1.5-2.599 million people.
Total Metro Area Population Census 2010, July 1, 2018 and July 1, 2019 Census 2010——————————-July 1, 2018————————July 1, 2019 1. Chicago, IL: 9,461,105————-1. Chicago: 9,484,158———–1. Chicago: 9,458,539 2. Detroit, MI: 4,296,250—————2. Detroit: 4,322,084————-2. Detroit: 4,319,629 3. Minneapolis, MN: 3,348,8459—-3. Minneapolis: 3,610,061–3. Minneapolis: 3,640,043 4. St. Louis, MO: 2,787,701———-4. St. Louis: 2,803,958———4. St. Louis: 2,803,228 5. Pittsburgh, PA: 2,356,285——5. San Antonio: 2,512,379—5. San Antonio: 2,550,960 6. San Juan, PR: 2,350,126———-6. Portland: 2,473,350———6. Portland: 2,492,412 7. Portland, OR: 2,226,009——-7. Sacramento: 2,341,940—–7. Sacramento: 2,363,730 8. Sacramento, CA: 2,149,127—–8. Pittsburgh: 2,322,653——–8. Pittsburgh: 2,317,600 9. San Antonio, TX: 2,142,516—–9. Las Vegas: 2,226,115——-9. Las Vegas: 2,266,715 10. Cincinnati: 2,114,580———–10. Cincinnati: 2,211,936——-10. Austin: 2,227,083 11. Cleveland: 2,077,240———–11. Austin: 2,165,497———–11. Cincinnati: 2,221,208 12. Kansas City, MO: 2,009,342-12. Kansas City: 2,144,427–12. Kanas City: 2,157,990 13. Las Vegas, NV: 1,951,269—–13. Columbus: 2,104,194—–13. Columbus: 2,122,271 14. Columbus: 1,901,974——-14. Cleveland: 2,053,795—–14. Indianapolis: 2,074,537 15. Indianapolis, IN: 1,887,877—15. Indianapolis: 2,052,368—15. Cleveland: 2,048,449 16. San Jose, CA: 1,836,911—16. San Juan: 2,022,139———16. San Juan: 2,023,227 17. Austin, TX: 1,716,289————17. San Jose: 1,993,804—–17. San Jose: 1,990,660 18. Virginia Beach, VA: 1,676,822—18. Nashville: 1,904,726—18. Nashville: 1,934,317 19. Nashville: 1,670,890—19. Virginia Beach: 1,763,713–19. Virginia Beach: 1,768,901 20. Providence, RI: 1,600,852—-20. Providence: 1,622,379—20. Providence: 1,624,578 21. Milwaukee, WI: 1,555,908—–21. Milwaukee: 1,573,995—21. Milwaukee: 1,575,179 22. Jacksonville, FL: 1,345,596-22. Jacksonville: 1,532,663–22. Jacksonville: 1,559,514 23. Grand Rapids: 988,938–23. Grand Rapids: 1,071,370-23. Grand Rapids: 1,077,370 24. Omaha, NE: 865,350————–24. Omaha: 940,970—-24. Omaha: 949,442 25. Dayton: 799,232——————–25. Dayton: 805,088—–25. Dayton: 807,611 26. Akron: 703,200———————26. Akron: 703,855——–26. Akron: 703,479 27. Wichita, KS: 630,919————27. Des Moines: 690,915—27. Des Moines: 699,292 28. Toledo: 610,001——————28.Madison: 659,927——–28. Madison: 664,865 29. Madison, WI: 605,435———–29. Toledo: 643,089——–29. Toledo: 641,816 30. Des Moines, IA: 569,633——-30. Wichita: 637,519——30. Wichita: 640,218 31. Youngstown: 565,773———–31. Lansing: 548,674—–31. Lansing: 550,391 32. Lansing, MI: 534,684————32. Youngstown: 538,226—32. Youngstown: 536,081 33. Canton: 404,422——————33. Canton: 401,165—-33. Canton: 399,927
Charlotte and Orlando metros, previous national peers, have grown past the population standard limit of 2.599 million and are no longer used. Lansing and San Juan have been added.
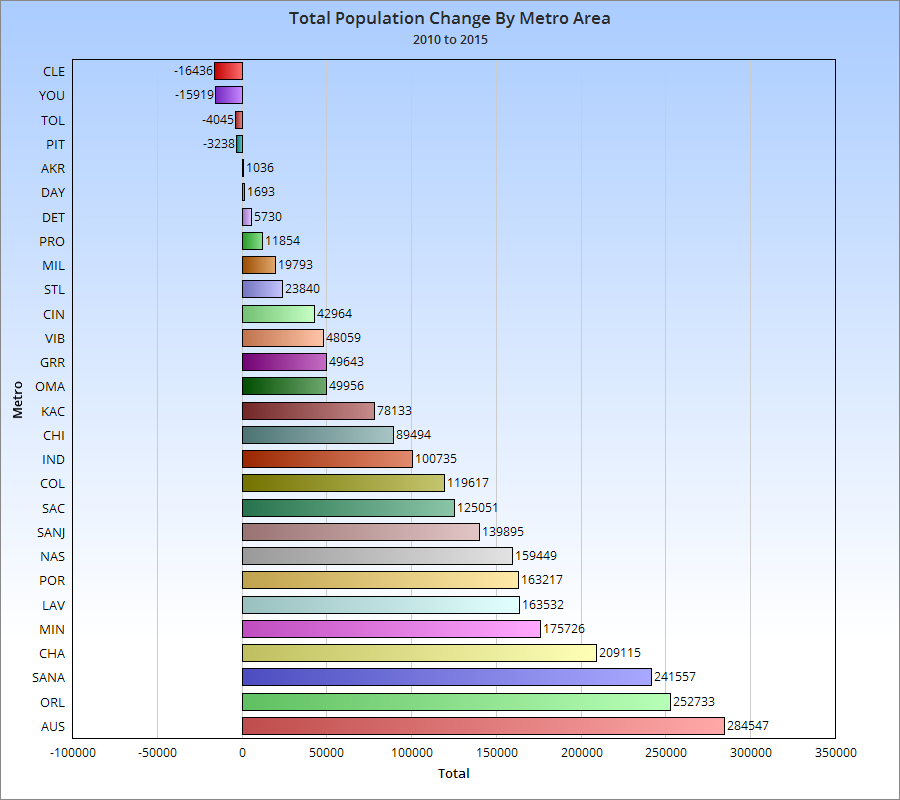
Metro Area Total Growth Census 2010-July 1, 2019 and July 1, 2018-July 1, 2019 Census 2010-July 1, 2019—————————–July 1, 2018-July 1, 2019 1. Austin: +510,794————————————–1. Austin: +61,586 2. San Antonio: +408,452——————————2. Las Vegas: +40,600 3. Las Vegas: +315,446——————————–3. San Antonio: +38,581 4. Minneapolis: +306,410——————————4. Minneapolis: +29,982 5. Nashville: +288,117———————————-5. Nashville: +29,591 6. Portland: +266,403———————————–6. Jacksonville: +26,851 7. Columbus: +220,297——————————–7. Indianapolis: +22,169 8. Sacramento: +214,603——————————8. Sacramento: +21,790 9. Jacksonville: +213,918——————————9. Portland: +19,062 10. Indianapolis: +186,660—————————-10. Columbus: +18,077 11. San Jose: +153,749——————————–11. Kansas City: +13,563 12. Kansas City: +148,648—————————–12. Cincinnati: +9,272 13. Des Moines: +92,817——————————-13. Omaha: +8,472 14. Omaha: +84,092————————————-14. Des Moines: +8,377 15. Grand Rapids: +83,700—————————–15. Grand Rapids: +6,000 16. Cincinnati: +83,541———————————-16. Virginia Beach: +5,188 17. Madison: +59,430————————————17. Madison: +4,938 18. Virginia Beach: +54,947—————————-18. Wichita: +2,699 19. Providence: +23,726——————————–19. Dayton: +2,523 20. Detroit: +23,379—————————————20. Providence: +2,199 21. Milwaukee: +19,271———————————21. Lansing: +1,717 22. Wichita: +17,157————————————-22. Milwaukee: +1,184 23. Lansing: +15,707————————————23. San Juan: +1,088 24. St. Louis: +15,527———————————–24. Akron: -376 25. Dayton: +8,379—————————————25. St. Louis: -730 26. Akron: +279——————————————-26. Canton: -810 27. Chicago: -2,566————————————–27. Toledo: -1,273 28. Canton: -6,902—————————————28. Youngstown: -2,45 29. Toledo: -9,613—————————————-29. Detroit: -2,455 30. Cleveland: -28,791———————————-30. San Jose: -3,144 31. Youngstown: -29,692——————————-31. Pittsburgh: -5,053 32. Pittsburgh: -36,685———————————32. Cleveland: -5,346 33. San Juan: -326,899——————————–33. Chicago: -25,619
Now let’s look at the components of population change for metro areas.
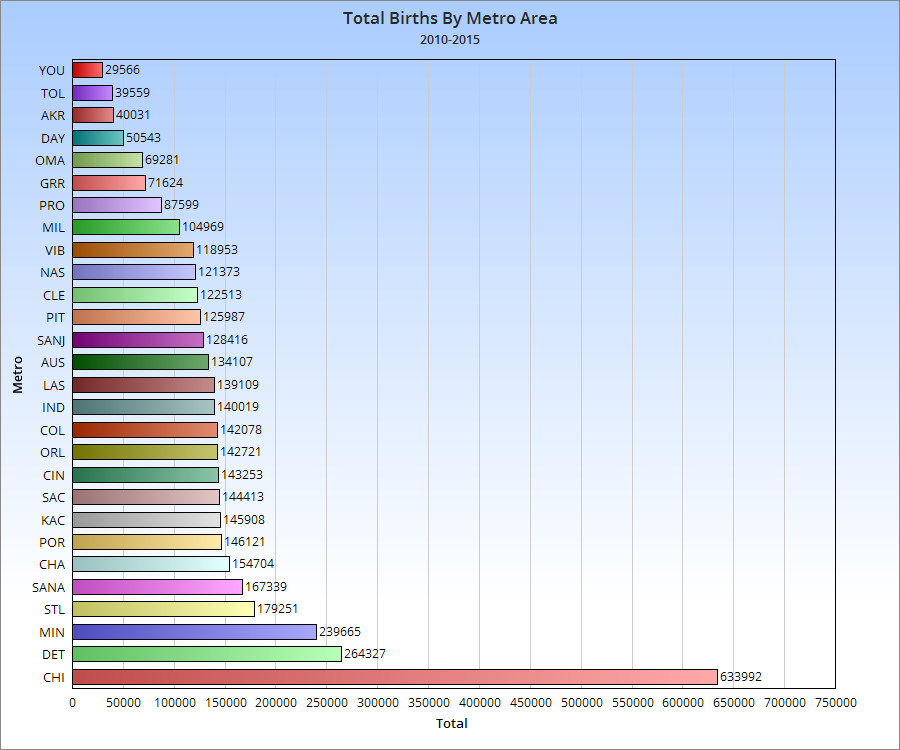
Total Births By Metro Census 2010-July 1, 2019 and July 1, 2018-July 1, 2019 Census 2010-July 1, 2019———————–July 1, 2018-July 1, 2019 1. Chicago: 1,085,985——————————-1. Chicago: 108,425 2. Detroit: 462,696————————————2. Detroit: 48,879 3. Minneapolis: 419,634—————————–3. Minneapolis: 44,602 4. St. Louis: 310,273———————————4. San Antonio: 32,592 5. San Antonio: 300,032—————————-5. St. Louis: 31,686 6. Kansas City: 253,384—————————-6. Columbus: 27,096 7. Cincinnati: 253,180——————————-7. Las Vegas: 27,048 8. Portland: 253,110———————————8. Cincinnati: 26,892 9. Sacramento: 252,144—————————9. Sacramento: 26,752 10. Columbus: 251,291—————————10. Kanas City: 26,497 11. Las Vegas: 247,787—————————11. Indianapolis: 26,300 12. Indianapolis: 246,099————————-12. Portland: 26,204 13. Austin: 239,673———————————13. Austin: 26,115 14. San Jose: 220,891—————————–14. Nashville: 24,308 15. Pittsburgh: 218,159—————————-15. Pittsburgh: 22,570 16. Nashville: 216,969—————————–16. San Jose: 22,487 17. Cleveland: 212,523—————————-17. Cleveland: 22,003 18. Virginia Beach: 209,617———————-18. Virginia Beach: 21,589 19. Milwaukee: 182,815—————————19. Milwaukee: 18,927 20. Jacksonville: 167,526————————-20. Jacksonville: 18,592 21. Providence: 152,794————————–21. Providence: 16,182 22. Grand Rapids: 125,556———————-22. Grand Rapids: 13,339 23. Omaha: 122,306——————————23. Omaha: 12,848 24. Dayton: 88,783——————————–24. Dayton: 9,391 25. Des Moines: 85,530————————–25. Des Moines: 9,311 26. Wichita: 81,503——————————–26. Wichita: 8,057 27. Toledo: 71,848———————————27. Toledo: 7,428 28. Akron: 69,159———————————-28. Akron: 7,196 29. Madison: 67,559——————————29. Madison: 6,988 30. Lansing: 54,679——————————-30. Lansing: 5,702 31. Youngstown: 51,745————————-31. Youngstown: 5,450 32. Canton: 40,730——————————–32. Canton: 4,254
Components of change stats are not available for San Juan.
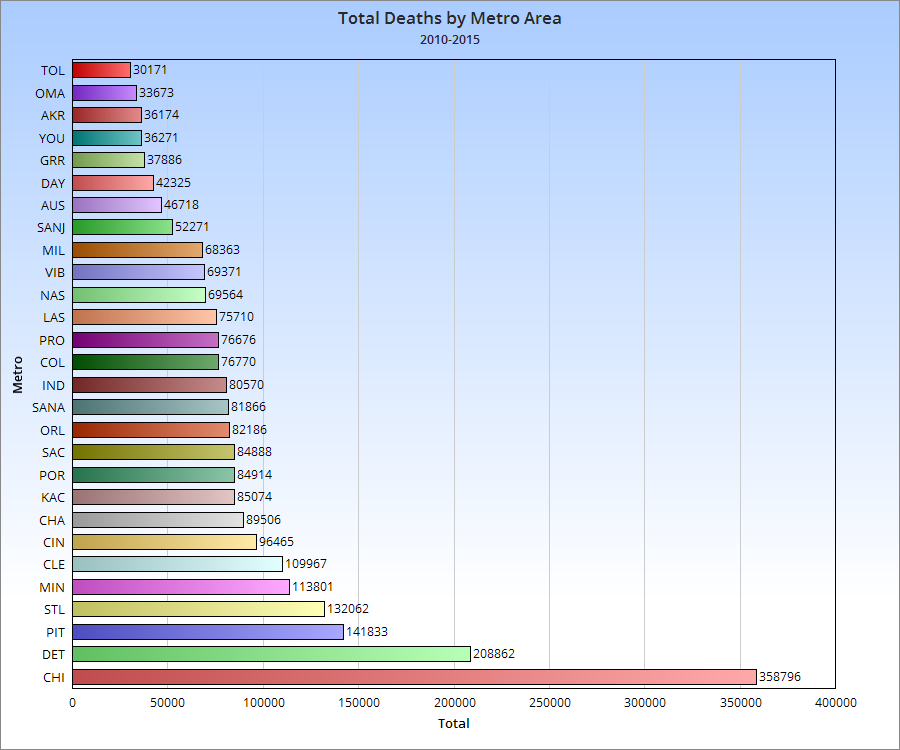
Total Deaths By Metro Census 2010-July 1, 2019 and July 1, 2018-July 1, 2019 Census 2010-July 1, 2019———————————July 1, 2018-July 1, 2019 1. Chicago: -647,739——————————————-1. Chicago: -74,501 2. Detroit: -377,943———————————————2. Detroit: -42,151 3. Pittsburgh: -253,686—————————————-3. St. Louis: -27,669 4. St. Louis: -241,884——————————————4. Pittsburgh: -27,387 5. Minneapolis: -210,510————————————-5. Minneapolis: -24,290 6. Cleveland: -198,044—————————————-6. Cleveland: -21,464 7. Cincinnati: -179,563—————————————-7. Cincinnati: -20,279 8. Sacramento: -157,234————————————-8. Sacramento: -18,933 9. Portland: -156,592——————————————9. San Antonio: -18,551 10. Kansas City: -155,166———————————–10. Portland: -18,458 11. San Antonio: -153,339———————————–11. Las Vegas: -17,919 12. Indianapolis: -148,608———————————–12. Kansas City: -17,692 13. Columbus: -142,665————————————–13. Columbus: -16,704 14. Las Vegas: -142,415————————————-14. Indianapolis: -16,678 15. Providence: -139,006————————————15. Virginia Beach: -15,280 16. Virginia Beach: -131,065——————————–16. Providence: -15,189 17. Nashville: -128,228—————————————17. Nashville: -15,122 18. Milwaukee: -123,806————————————-18. Jacksonville: -14,089 19. Jacksonville: -114,660———————————–19. Milwaukee: -13,810 20. San Jose: -94,587—————————————-20. San Jose: -11,582 21. Austin: -89,867——————————————–21. Austin: -11,445 22. Dayton: -77,893——————————————-22. Dayton: -8,506 23. Grand Rapids: -69,869———————————-23. Grand Rapids: -7,947 24. Akron: -65,852——————————————–24. Akron: -7,196 25. Youngstown: -64,558————————————25. Omaha: -6,931 26. Omaha: -62,030——————————————26. Youngstown: -6,842 27. Toledo: -59,436——————————————-27. Toledo: -6,624 28. Wichita: -51,734——————————————28. Wichita: 5,732 29. Des Moines: -44,857————————————29. Des Moines: 5,175 30. Canton: -41,233——————————————30. Lansing: -4,577 31. Lansing: -40,586—————————————–31. Madison: -4,453 32. Madison: -39,499—————————————-32. Canton: -4,395
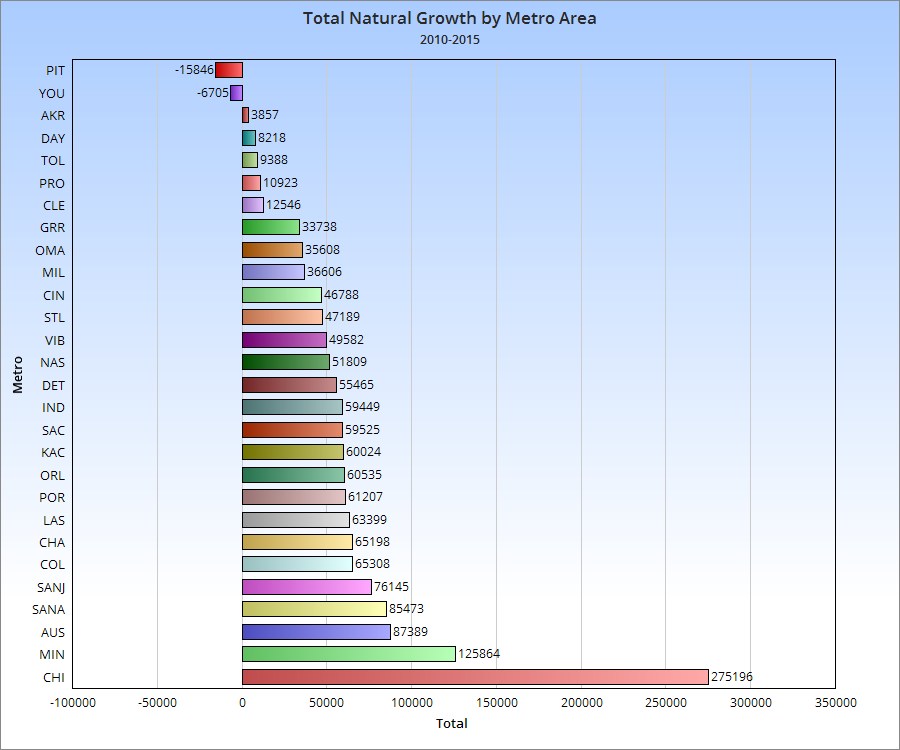
Total Net Natural Change (Births vs. Deaths) By Metro Census 2010-July 1, 2019 and July 1, 2018-July 1, 2019 Census 2010-July 1, 2019———————————July 1, 2018-July 1, 2019 1. Chicago: 438,246———————————————1. Chicago: 33,924 2. Minneapolis: 209,124—————————————-2. Minneapolis: 20,312 3. Austin: 149,806———————————————–3. Austin: 14,670 4. San Antonio: 146,693—————————————4. San Antonio: 14,041 5. San Jose: 126,304——————————————-5. San Jose: 10,905 6. Columbus: 108,626——————————————6. Columbus: 10,392 7. Las Vegas: 105,372—————————————–7. Indianapolis: 9,622 8. Kansas City: 98,218—————————————–8. Nashville: 9,186 9. Indianapolis: 97,491—————————————–9. Las Vegas: 9,129 10. Portland: 96,518——————————————-10. Kansas City: 8,805 11. Sacramento: 94,910————————————–11. Sacramento: 7,819 12. Nashville: 88,741——————————————12. Portland: 7,746 13. Detroit: 84,753———————————————-13. Detroit: 6,728 14. Virginia Beach: 78,552———————————–14. Cincinnati: 6,613 15. Cincinnati: 73,617—————————————–15. Virginia Beach: 6,309 16. St. Louis: 68,389——————————————-16. Omaha: 5,917 17. Omaha: 60,276———————————————17. Grand Rapids: 5,392 18. Milwaukee: 59,009—————————————–18. Milwaukee: 5,117 19. Grand Rapids: 55,687————————————19. Jacksonville: 4,503 20. Jacksonville: 52,866————————————–20. Des Moines: 4,136 21. Des Moines: 40,673————————————–21. St. Louis: 4,017 22. Wichita: 29,769——————————————–22. Madison: 2,535 23. Madison: 28,060——————————————23. Wichita: 2,325 24. Cleveland: 14,479—————————————-24. Lansing: 1,125 25. Lansing: 14,093——————————————25. Providence: 993 26. Providence: 13,788————————————–26. Dayton: 885 27. Toledo: 12,412——————————————–27. Toledo: 804 28. Dayton: 10,890——————————————-28. Cleveland: 539 29. Akron: 3,307———————————————-29. Akron: 0 30. Canton: -503———————————————-30. Canton: -141 31. Youngstown: -12,813———————————–31. Youngstown: -1,392 32. Pittsburgh: -35,527————————————–32. Pittsburgh: -4,817
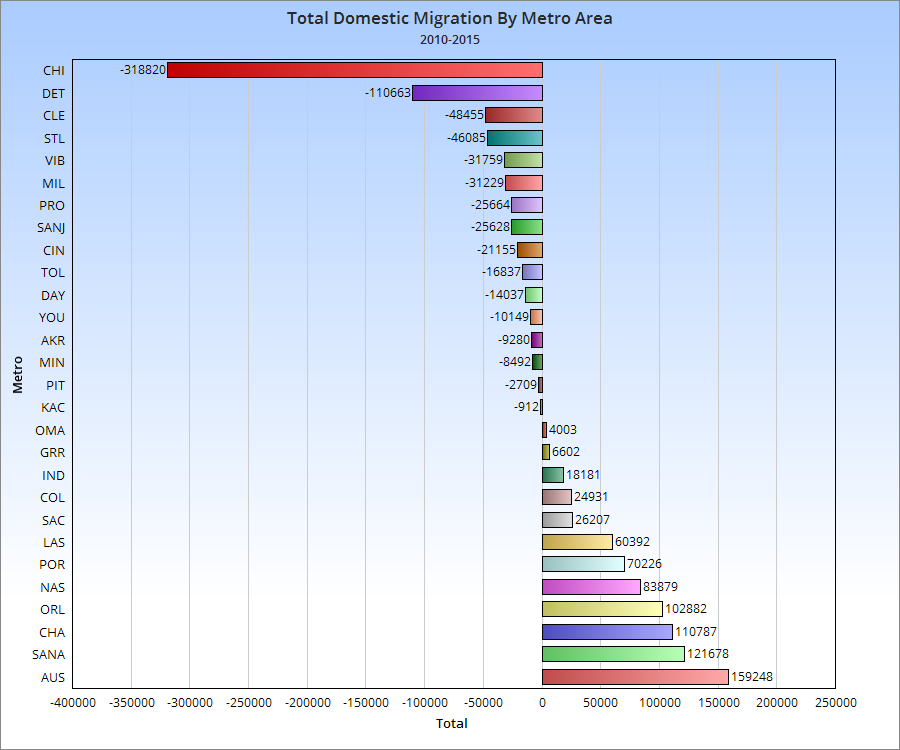
Total Domestic Migration By Metro Census 2010-July 1, 2019 and July 1, 2018-July 1, 2019 Census 2010-July 1, 2019———————————July 1, 2018-July 1, 2019 1. Austin: 293,162———————————————–1. Austin: 41,334 2. San Antonio; 214,509—————————————2. Las Vegas: 31,643 3. Las Vegas: 185,570—————————————–3. San Antonio: 21,987 4. Nashville: 158,336——————————————-4. Jacksonville: 20,051 5. Jacksonville: 126,483—————————————5. Nashville: 15,482 6. Portland: 121,473——————————————–6. Sacramento: 9,941 7. Sacramento: 69,723—————————————-7. Portland: 8,374 8. Columbus: 53,301——————————————-8. Indianapolis: 6,196 9. Indianapolis: 46,076—————————————-9. Columbus: 3,746 10. Des Moines: 40,183————————————–10. Des Moines: 3,718 11. Kansas City: 24,457————————————–11. Minneapolis: 3,202 12. Madison: 15,880——————————————12. Kansas City: 2,437 13. Minneapolis: 11,638————————————–13. Madison: 1,418 14. Grand Rapids: 10,903———————————–14. Cincinnati: 1,193 15. Omaha: 7,537———————————————-15. Omaha: 1,068 16. Canton: -7,124———————————————16. Dayton: 896 17. Dayton: -15,586——————————————–17. Wichita: -291 18. Akron: -15,683———————————————-18. Grand Rapids: -669 19. Lansing: -18,240——————————————-19. Canton: -677 20. Youngstown: -19,317————————————-20. Youngstown: -751 21. Cincinnati: -19,944—————————————-21. Lansing: -840 22. Wichita: -21,454——————————————-22. Akron: -1,190 23. Toledo: -27,740——————————————–23. Virginia Beach: -2,197 24. Pittsburgh: -31,804—————————————24. Toledo: -2,339 25. Providence: -38,503————————————-25. Pittsburgh: -2,658 26. Virginia Beach: -59,729———————————26. Providence: -3,185 27. Milwaukee: -64,395————————————–27. Milwaukee: -5,140 28. Cleveland: -78,763————————————–28. Cleveland: -7,250 29. St. Louis: -85,003—————————————-29. St. Louis: -7,685 30. San Jose: -124,105————————————-30. Detroit: -16,655 31. Detroit: -172,225—————————————–31. San Jose: -27,495 32. Chicago: -638,599—————————————32. Chicago: -74,950
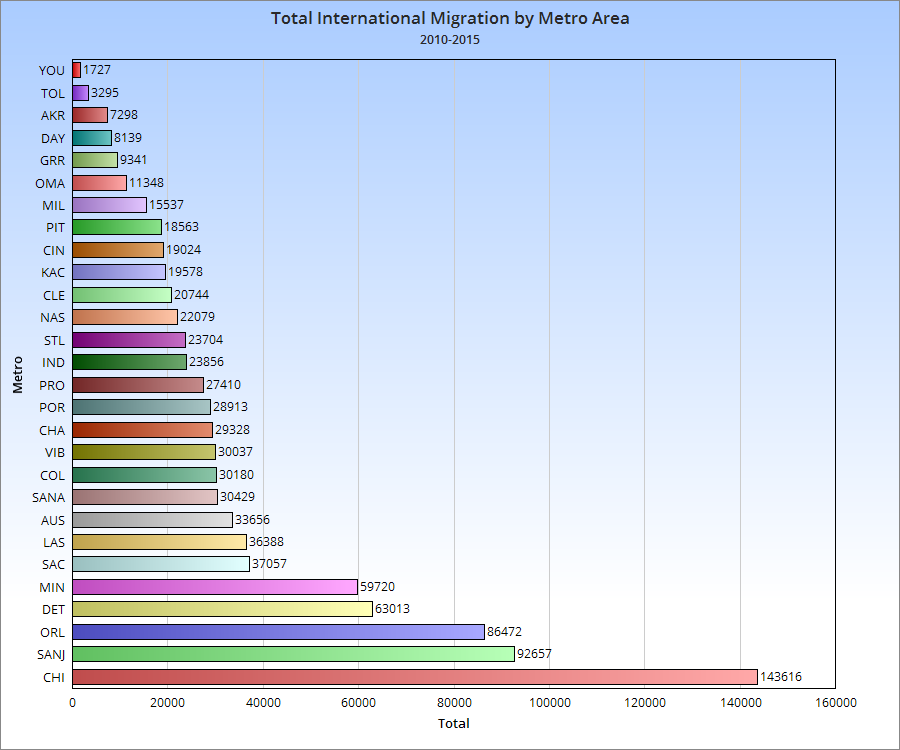
Total International Migration By Metro Census 2010-July 1, 2019 and July 1, 2018-July 1, 2019 Census 2010-July 1, 2019———————————July 1, 2018-July 1, 2019 1. Chicago: 197,093——————————————-1. Chicago: 15,257 2. San Jose: 152,520—————————————–2. San Jose: 13,371 3. Detroit: 110,907———————————————3. Detroit: 7,516 4. Minneapolis: 87,847—————————————4. Minneapolis: 6,645 5. Austin: 62,740———————————————–5. Indianapolis: 6,394 6. Columbus: 58,853——————————————6. Austin: 5,280 7. Sacramento: 51,225—————————————7. Nashville: 4,937 8. Providence: 49,015—————————————-8. Providence: 4,455 9. Portland: 47,983——————————————–9. Sacramento: 4,053 10. San Antonio: 45,348————————————10. Columbus: 4,032 11. Indianapolis: 43,502————————————-11. St. Louis: 2,991 12. Nashville: 39,422—————————————–12. Portland: 2,960 13. Virginia Beach: 36,319———————————-13. Pittsburgh: 2,555 14. Cleveland: 36,318—————————————-14. San Antonio: 2,504 15. Jacksonville: 34,089————————————-15. Kansas City: 2,377 16. St. Louis: 32,872—————————————–16. Jacksonville: 2,251 17. Cincinnati: 31,157—————————————-17. Cincinnati: 1,547 18. Pittsburgh: 30,654—————————————-18. Omaha: 1,517 19. Kansas City: 27,259————————————-19. Lansing: 1,452 20. Milwaukee: 25,298—————————————20. Cleveland: 1,433 21. Las Vegas: 23,319—————————————21. Grand Rapids: 1,316 22. Lansing: 19,865——————————————22. Milwaukee: 1,277 23. Grand Rapids: 17,629———————————-23. Virginia Beach: 1,165 24. Omaha: 16,785——————————————24. Madison: 988 25. Madison: 15,600—————————————–25. Akron: 836 26. Dayton: 13,473——————————————26. Dayton: 785 27. Akron: 13,086——————————————–27. Wichta: 688 28. Des Moines: 11,716————————————28. Des Moines: 519 29. Wichita: 9,096——————————————-29. Toledo: 270 30. Toledo: 5,646——————————————–30. Canton: 25 31. Youngstown: 2,675————————————-31. Youngstown: 25 32. Canton: 1,073——————————————–32. Las Vegas: -360
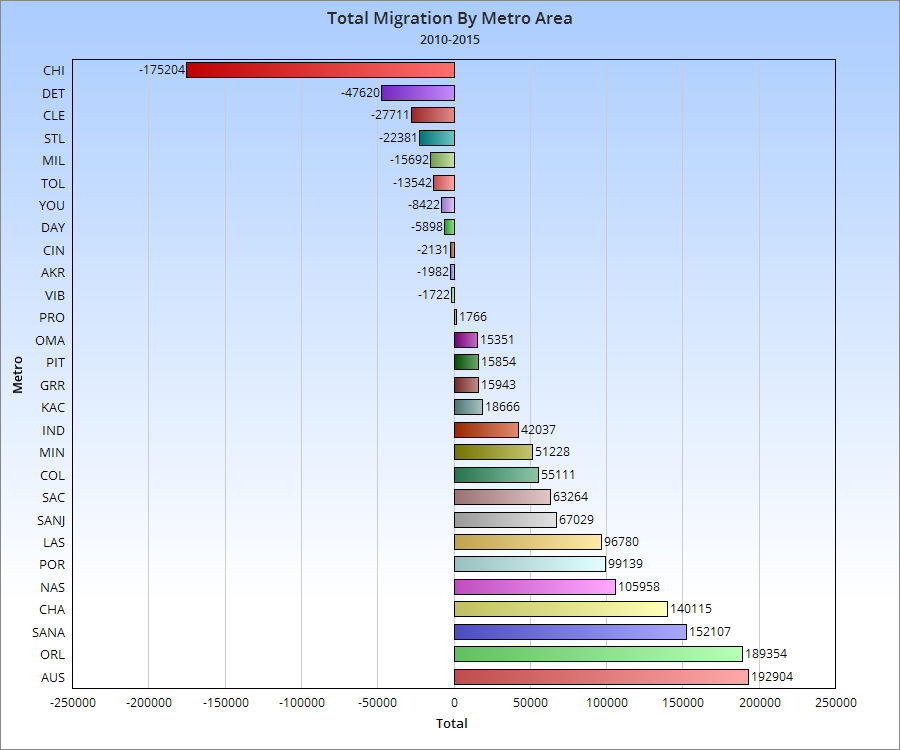
Total Net Migration By Metro Census 2010-July 1, 2019 and July 1, 2018-July 1, 2019 Census 2010-July 1, 2019———————————July 1, 2018-July 1, 2019 1. Austin: 355,902———————————————1. Austin: 46,614 2. San Antonio: 259,857————————————-2. Las Vegas: 31,283 3. Las Vegas: 208,889—————————————3. San Antonio: 24,491 4. Nasvhille: 197,758—————————————–4. Jacksonville: 22,302 5. Portland: 169,456——————————————5. Nashville: 20,419 6. Jacksonville: 160,572————————————-6. Sacramento: 13,994 7. Sacramento: 120,948————————————-7. Indianapolis: 12,590 8. Columbus: 112,154—————————————-8. Portland: 11,334 9. Minneapolis: 99,458—————————————9. Minneapolis: 9,847 10. Indianapolis: 89,578————————————10. Columbus: 7,778 11. Des Moines: 51,899————————————-11. Kansas City: 4,814 12. Kansas City: 51,716————————————-12. Des Moines: 4,237 13. Madison: 31,480——————————————13. Cincinnati: 2,740 14. Grand Rapids: 28,352———————————–14. Omaha: 2,585 15. San Jose: 28,415—————————————-15. Madison: 2,406 16. Omaha: 24,322——————————————-16. Dayton: 1,681 17. Cincinnati: 11,213—————————————-17. Providence: 1,270 18. Providence: 10,512————————————–18. Grand Rapids: 647 19. Lansing: 1,625——————————————–19. Lansing: 612 20. Pittsburgh: -1,150—————————————-20. Wichita: 397 21. Dayton: -2,113——————————————–21. Pittsburgh: -103 22. Akron: -2,597———————————————-22. Akron: -354 23. Canton: -6,051——————————————–23. Canton: -652 24. Wichita: -12,358——————————————24. Youngstown: -726 25. Youngstown: -16,642————————————25. Virginia Beach: -1,032 26. Toledo: -22,094——————————————-26. Toledo: -2,069 27. Virginia Beach: -23,410——————————–27. Milwaukee: -3,863 28. Milwaukee: -39,097————————————-28. St. Louis: -4,694 29. Cleveland: -42,445————————————–29. Cleveland: -5,817 30. St. Louis: -52,131—————————————-30. Detroit: -9,139 31. Detroit: -61,318——————————————31. San Jose: -14,124 32. Chicago: -441,506————————————–32. Chicago: -59,693
The 2019 metro population estimates show Columbus largely holding its own against state, regional and national peers.
As promised, here are the 2015 metro area population estimates for Columbus and its regional and national peers.
2015 Metro Population Estimates Chicago, IL: 9,551,031 Detroit, MI: 4,302,043 Minneapolis, MN: 3,524,583 St. Louis, MO: 2,811,588 Charlotte, NC: 2,426,363 Portland, OR: 2,389,228 Orlando, FL: 2,387,138 San Antonio, TX: 2,384,075 Pittsburgh, PA: 2,353,045 Sacramento, CA: 2,274,194 Cincinnati: 2,157,719 Las Vegas, NV: 2,114,801 Kansas City, MO: 2,087,471 Cleveland: 2,060,810 Columbus: 2,021,632 Austin, TX: 2,000,860 Indianapolis: 1,988,817 San Jose, CA: 1,976,836 Nashville, TN: 1,830,345 Virginia Beach, VA: 1,724,876 Providence, RI: 1,613,070 Milwaukee, WI: 1,575,747 Grand Rapids, MI: 1,038,583 Omaha, NE: 915,312 Dayton: 800,909 Akron: 704,243 Toledo: 605,956 Youngstown: 549,885
Components of Metro Area Population Change As you can see, while Columbus has a middle of the road birth rate for its peers, its relatively low death rate means that it manages to be near the top of the its peer group in natural growth.
It seems that while international migration is competitive with peers in the Columbus metro, domestic migration would need to improve to truly be at the upper peer level. At the very least, it is positive.
In a related post to the recent metro population comparison of Columbus to its peer 1.5-2.5 million group, I wanted to see where the metros stood as far as their current racial makeup as well as where they are trending. So here are the current Columbus metro diversity trends, along with 17 other peer metros, according to the US Census.
First, let’s take a look at the breakdown of race by metro in 2012, the last year that data is available.
Columbus had the 5th highest % of its metro population as White, non-Hispanic. Columbus came in at #8 for the % of its metro population being Black, non Hispanic. Columbus ranks 9th for its % of metro population that is Asian, non-Hispanic. Columbus ranked poorly in this group, coming in at 15th of 18. Finally, Columbus ranked 7th in the population of Other, non-Hispanic as a % of the total metro population.
So currently, what is the overall diversity ranking of the 18 metros? To find out, I used a simple formula: Each metro would be assigned points (1-18) based on the ranking position in each racial group. Here are the final rankings. Overall, Columbus comes in as the 8th most-diverse metro in its 18-peer group. So a bit better than average and perhaps a bit surprising to some.
But what about where this diversity is trending? To find out, I looked at 2005 and 2012 and calculated how each racial group had changed over the period. Columbus did relatively well with Non-Hispanic Whites, growing at the 5th best pace. The Columbus metro came in the top 10, at #7, for Non-Hispanic Black population growth. The metro didn’t fare as well on growth in the Asian population, coming in at 10th. Columbus came in at #6 for this group. So using the same point system from above, what were the fastest diversifying metros as of 2012?
The Columbus metro was the 5th fastest diversifying metro in its peer group in 2012.
Overall, Columbus ranks higher than and much higher than average in both current racial diversity and the rate of racial diversity growth, respectively. The Columbus vs. Other Cities page examines many types of similar population and demographic comparisons.