Domestic Migration by State Report


domestic migration by state

Over the last few decades, much attention has been given to the fact that domestic migration by state has heavily favored the “Sun Belt”, states made up of the Southeast west to the West Coast. While Northern states weren’t all losing people, the region as a whole sent far more people to the Sun Belt than they retained. This helped fuel the respective Southern boom, and media story after media story over the years have made sweeping predictions of this growing powerhouse region, often centered around the idea that the boom had no foreseeable end. The irony with these predictions is that they ignored history. For more than 2 centuries, the North was where people moved. Its states and cities saw massive influxes of population. As recently as the decade of the 1950s, Ohio grew by nearly 2 million alone. Economic conditions in decline, job losses, particularly in the manufacturing industry, increases in the cost of living and other factors ended the boom and helped to bring about the rise of the South, so to speak. Since at least the 1960s, the story has been about the Sun Belt/West.

The Censusdoes state migration estimates every year, and there are some interesting things going on in the data that may indicate that the boom in the South is faltering while the North’s fortunes are not looking as grim as they once did.

First, what are the regions?
South: Alabama, Arkansas, Florida, Georgia, Kentucky, Louisiana, Mississippi, North Carolina, Oklahoma, South Carolina, Tennessee, Texas, Virginia and West Virginia.
North: Connecticut, Delaware, Washington D.C., Illinois, Indiana, Iowa, Kansas, Maine, Maryland, Massachusetts, Michigan, Minnesota, Missouri, Nebraska, New Hampshire, New Jersey, New York, North Dakota, Ohio, Pennsylvania, Rhode Island, South Dakota, Vermont and Wisconsin.
West: Alaska, Arizona, California, Colorado, Hawaii, Idaho, Montana, Nevada, New Mexico, Oregon, Utah, Washington and Wyoming.

Let’s next look at the states by rank of domestic migration in 2005, the earliest available year for the state data, and compared it to 2012, the most recent year available. This period covers the period just before and just after the Great Recession.

Domestic Migration Rank, 2005 vs. 2012, by Total
2005___________________________________2012

1. Florida: +188,035_________________________1. Florida: +108,823
2. Arizona: +131,501_________________________2. Texas: +105,565
3. Texas: +124,522__________________________3. Colorado: +43,530
4. Georgia: +88,250________________________4. Washington: +37,187
5. North Carolina: +51,575___________________5. North Carolina: +34,846
6. Tennessee: +43,901______________________6. South Carolina: +34,149
7. Oregon: +43,360_________________________7. Nevada: +25,835
8. Washington: +38,093_____________________8. Arizona: +25,615
9. South Carolina: +32,312___________________9. Georgia: +25,204
10. Arkansas: +30,765______________________10. Missouri: +20,176
11. Nevada: +26,839________________________11. North Dakota: +14,254
12. Idaho: +20,308_________________________12. Tennessee: +13,255
13. Colorado: +16,963______________________13. Virginia: +12,110
14. Oklahoma: +16,372_____________________14. Arkansas: +11,981
15. Alabama: +14,501______________________15. Oregon: +10,742
16. New Mexico: +13,714___________________16. New Hampshire: +10,711
17. Delaware: +12,561______________________17. Delaware: +10,610
18. Virginia: +11,121________________________18. Kentucky: +8,899
19. Kentucky: +7,451______________________19. Mississippi: +6,569
20. Missouri: +6,338______________________20. Oklahoma: +6,402
21. Iowa: +5,406__________________________21. Utah: +5,717
22. Montana: +4,185______________________22. Vermont: +4,375
23. Pennsylvania: +2,868__________________23. South Dakota: +3,578
24. Maine: +2,447_________________________24. Montana: +3,410
25. Hawaii: +2,388________________________25. Idaho: +3,400
26. West Virginia: +998____________________26. Wisconsin: +1,468
27. New Hampshire: +497__________________27. Iowa: +275
28. South Dakota: +360____________________28. Ohio: -105
29. Wyoming: -366________________________29. West Virginia: -300
30. Minnesota: -1,154______________________30. Wyoming: -639
31. Kansas: -2,244_________________________31. Maryland: -2,821
32. North Dakota: -2,553___________________32. Rhode Island: -2,948
33. Wisconsin: -2,756______________________33. Louisiana: -4,741
34. Vermont: -3,580_______________________34. Kansas: -4,850
35. Nebraska: -5,128_______________________35. Nebraska: -5,174
36. Utah: -5,639___________________________36. Hawaii: -6,364
37. Connecticut: -6,536____________________37. Connecticut: -6,712
38. Mississippi: -7,120_____________________38. Washington D.C.: -7,470
39. Indiana: -9,222_________________________39. New Mexico: -9,228
40. Maryland: -9,718_______________________40. Alabama: -9,431
41. Washington D.C.: -12,872________________41. Indiana: -10,460
42. Rhode Island: -15,037___________________42. Maine: -11,025
43. New Jersey: -22,051____________________43. Minnesota: -14,904
44. Alaska: -23,567________________________44. Massachusetts: -15,579
45. Ohio: -40,841__________________________45. Pennsylvania: -21,656
46. Massachusetts: -52,726________________46. Michigan: -41,761
47. Michigan: -53,852______________________47. Alaska: -49,250
48. Illinois: -55,932________________________48. Illinois: -68,356
49. Louisiana: -99,684_____________________49. California: -73,345
50. New York: -239,848____________________50. New Jersey: -89,666
51. California: -266,243_____________________51. New York: -135,149

So in 2005, the breakdown was as follows:
12 of 14 Southern states had positive domestic migration. The only 2 that did not, Louisiana and Mississippi, were heavily influenced in 2005 by Hurricane Katrina, which caused large numbers of displaced residents to leave the states entirely.
7 of 24 Northern states has positive domestic migration. The 7 states were mixed between the Midwest and the Northeast/Mid-Atlantic. Just one Great Lakes State had positive domestic migration in 2005.
9 of 13 Western states had positive domestic migration. Only California and a few Mountain West states had negative numbers.

The 2005 numbers show the overall domestic migration picture as it had been for at least the last few decades, if not much longer. The South and West were the dominant net gainers of domestic migration, while most of the North sent people to those regions.

In 2012, the breakdown was as follows:
11 of 14 Southern states had positive domestic migration. Even with Katrina-hit state Mississippi having net gains in 2012, the overall number of states with positive gains declined.
8 of 24 Northern states had positive domestic migration, a slight improvement over 2005.
8 of 13 Western states had positive domestic migration, a slight decline over 2005.

But the breakdowns don’t tell us the whole story. When trying to compare the two years, trends are very important, and the trends are far more revealing.

Total Change 2005-2012 By Rank
1. California: +192,898
2. New York: +104,699
3. Louisiana: +94,943
4. Ohio: +40,736
5. Massachusetts: +37,147
6. Colorado: +26,567
7. North Dakota: +16,807
8. Missouri: +13,838
9. Mississippi: +13,689
10. Michigan: +12,091
11. Rhode Island: +12,089
12. Utah: +11,356
13. New Hampshire: +10,214
14. Vermont: +7,955
15. Maryland: +6,897
16.Washington, D.C.: +5,402
17. Wisconsin: +4,224
18. South Dakota: +3,218
19. South Carolina: +1,837
20. Kentucky: +1,448
21. Virginia: +989
22. Nebraska: -46
23. Connecticut: -176
24. Wyoming: -273
25. Montana: -775
26. Washington: -906
27. Nevada: -1,004
28. Indiana: -1,238
29. West Virginia: -1,298
30. Delaware: -1,951
31. Kansas: -2,606
32. Iowa: -5,131
33. Hawaii: -8,752
34. Oklahoma: -9,970
35. Illinois: -12,424
36. Maine: -13,472
37. Minnesota: -13,750
38. North Carolina: -16,729
39. Idaho: -16,908
40. Arkansas: -18,784
41. Texas: -18,957
42. New Mexico: -22,942
43. Alabama: -23,932
44. Pennsylvania: -24,524
45. Alaska: -25,683
46. Tennessee: -30,646
47. Oregon: -32,618
48. Georgia: -63,046
49. New Jersey: -67,615
50. Florida: -79,212
51. Arizona: -105,886

5 of 14 Southern states improved their domestic migration rates 2005-2012.
13 of 24 Northern states improved their domestic migration rates 2005-2012.
3 of 13 Western states improved their domestic migration rates 2005-2012.

Ohio had the 4th best improvement over the period, a huge change. But some might ask, is it really a change when the rates may still be positive or negative like they were before? Well, yes and no. 7 years is not that long, and we’re talking about decades-long patterns here. Those won’t change like flipping a switch. It will take time. The point is more that for many states that have faced negative numbers for a long time, there is positive momentum now that they did not have before. Another question some may ask, however, is if the recession during the period reduced mobility. In some cases, I’m sure that it did, but if so, that reduction seems to have been centered on the South. A reduction in mobility would only indicate that migration rates would reduce to levels around 0, neither particularly positive nor negative. That reduction would NOT necessarily support switches from positive to negative or increases in negative or positive rates that already exist. Meaning that reduced mobility would mean that positive would become less positive as fewer people moved in, and negative would become less negative as fewer people left. On a state and regional basis, there is a wide range of results that do not support that geographic mobility alone is the culprit, or even a primary factor.


Peer and Columbus Metro Population Densities


Metro population densities

Over the years, I’ve learned that Columbus has a very suburban reputation, meaning that it is perceived to have very low density throughout, especially because it aggressively annexed suburban areas into the city limits decades ago. With those claims, I wondered what the metro population densities would be if Columbus’ area size was scaled down to others, with the goal of finding out if it really deserves the suburban reputation. Bare with me, because there is a lot to look at.

First, I used Columbus’ 18 peer metros (population 1.5-2.5 million) per the Census, as well as the 14 largest Midwest metros. Since there was some overlap in the 2 groups, it made for a total group comparison of 27. So a fairly sizeable group. Next, I used the mile marker population, which in the City Hall census analysis is made up of circles going out from the center. So it’s just a matter of finding the area of each circle and dividing the population into that. What’s left is the density by area.

Density at Mile Marker 1, with an Area of 3.14 Square Miles.
2000———————————-2010

1. Chicago: 42,492.4______________________ 1. Chicago:57,870.7
2. Minneapolis: 36,801.6__________________ 2. Minneapolis: 39,339.5
3. Providence, RI: 36,476.1_______________ 3. Providence, RI: 36,693.0
4. San Jose, CA: 31,854.8_________________ 4. San Jose, CA: 33,438.9
5. Las Vegas: 27,618.8____________________ 5. Milwaukee: 27,471.7
6. Milwaukee: 26,755.1____________________ 6. Portland, OR: 25,987.6
7. Grand Rapids, MI: 25,748.1_____________ 7. Las Vegas: 25,069.1
8. Pittsburgh: 25,570.7___________________ 8. Grand Rapids, MI: 24,080.6
9. Cincinnati: 22,728.0___________________ 9. Pittsburgh: 23,464.3
10. Portland, OR: 21,256.1________________ 10. Austin, TX: 23,149.4
11. Toledo: 20,973.6______________________ 11. Cincinnati: 20,781.5
12. Austin, TX: 20,301.9__________________ 12. San Antonio, TX: 18,596.8
13. San Antonio, TX: 20,156.7_____________ 13. Omaha: 17,905.7
14. Akron: 19,946.2_______________________ 14. Toledo: 17,751.3
15. Omaha: 17,922.6_______________________ 15. Akron: 17,106.7
16. Dayton: 16,311.5______________________ 16. Columbus: 15,817.5
17. Columbus: 16,151.6____________________ 17. Nashville: 15,529.3
18. Indianapolis: 15,865.6________________ 18. Sacramento, CA: 15,512.7
19. Nashville: 15,554.4___________________ 19. Charlotte, NC: 14,873.9
20. Sacramento, CA: 15,385.7______________ 20. Indianapolis: 14,356.4

Density at Mile Marker 2, with an Area of 12.57 Square Miles.
2000————————————–2010
1. Chicago: 22,808.1______________________ 1. Chicago: 25,339.9
2. San Jose, CA: 18,854.7_________________ 2. San Jose, CA: 19,696.3
3. Minneapolis: 17,936.8__________________ 3. Minneapolis: 18,212.2
4. Milwaukee: 16,799.9____________________ 4. Milwaukee: 16,609.1
5. Providence, RI: 16,134.9_______________ 5. Providence, RI: 16,457.6
6. Las Vegas: 16,016.4____________________ 6. Las Vegas: 15,331.4
7. Pittsburgh: 13,232.7___________________ 7. Austin, TX: 12,524.4
8. San Antonio, TX: 12,427.0______________ 8. Pittsburgh: 12,123.2
9. Cincinnati: 12,250.1___________________ 9. Portland, OR: 11,881.0
10. Austin, TX: 12,152.8__________________ 10. San Antonio, TX: 11,690.5
11. Columbus: 11,203.7____________________ 11. Sacramento, CA: 11,324.8
12. Akron: 10,999.9_______________________ 12. Cincinnati: 10,997.2
13. Grand Rapids, MI: 10,884.2____________ 13. Columbus: 10,726.0
14. Sacramento, CA: 10,606.1______________ 14. Grand Rapids, MI: 10,146.0
15. Dayton: 9,756.8_______________________ 15. Akron: 9,737.1
16. Indianapolis: 9,383.0_________________ 16. Omaha: 8,993.2
17. Omaha: 8,960.7________________________ 17. Indianapolis: 8,147.3
18. Toledo: 8,816.9_______________________ 18. Dayton: 8,100.0
19. Orlando: 8,212.5______________________ 19. Charlotte: 8,086.8
20. Charlotte: 8,095.5____________________ 20. Nashville: 7,777.6

Density at Mile Marker 3, with an Area of 28.27 Square Miles
2000————————————2010

1. Chicago: 17,528.7_____________________ 1. Chicago: 18,003.2
2. San Jose, CA: 13,883.0________________ 2. San Jose, CA: 14,549.2
3. Las Vegas: 11,646.0___________________ 3. Las Vegas: 11,576.2
4. Minneapolis: 11,494.2_________________ 4. Minneapolis: 11,503.3
5. Milwaukee: 11,448.9___________________ 5. Milwaukee: 11,288.0
6. Providence: 11,173.7__________________ 6. Providence, RI: 11,240.2
7. Pittsburgh: 10,594.4__________________ 7. Pittsburgh: 9,738.7
8. San Antonio. TX: 9,234.3______________ 8. Portland, OR: 8,973.6
9. Portland, OR: 8,257.0_________________ 9. San Antonio, TX: 8,846.8
10. Cincinnati: 8,141.9__________________ 10. Columbus: 7,834.0
11. Columbus: 8,134.9____________________ 11. Sacramento, CA: 7,668.7
12. Sacramento, CA: 7,261.5______________ 12. Austin, TX: 7,534.0
13. Austin, TX: 7,232.3__________________ 13. Cincinnati: 7,273.6
14. Akron: 6,925.4_______________________ 14. Grand Rapids, MI: 6,540.0
15. Grand Rapids, MI: 6,852.0____________ 15. Akron: 6,284.9
16. Indianapolis: 6,727.9________________ 16. Orlando: 6,055.1
17. Toledo: 6,651.5______________________ 17. Omaha: 5,968.3
18. Dayton: 6,382.8______________________ 18. Toledo: 5,982.1
19. St. Louis: 6,093.7___________________ 19. Indianapolis: 5,879.9
20. Kansas City: 6,025.1_________________ 20. St. Louis: 5,663.8

Density at Mile Marker 4, with an Area of 50.27 Square Miles
2000———————————2010

1. Chicago: 15,447.2____________________ 1. Chicago: 15,205.9
2. San Jose, CA: 12,209.3_______________ 2. San Jose, CA: 12,629.6
3. Las Vegas: 9,788.0___________________ 3. Las Vegas: 10,022.2
4. Minneapolis: 8,874.4_________________ 4. Minneapolis: 8,921.8
5. Milwaukee: 8,823.8___________________ 5. Milwaukee: 8,725.5
6. Providence, RI: 8,454.3______________ 6. Providence, RI: 8,483.8
7. Pittsburgh: 8,216.0__________________ 7. Portland, OR: 7,785.5
8. Portland, OR: 7,282.9________________ 8. Pittsburgh: 7,602.6
9. San Antonio, TX: 7,208.6_____________ 9. San Antonio, TX: 6,995.5
10. Cincinnati: 6,922.8_________________ 10. Cincinnati: 6,279.4
11. Columbus: 6,449.3___________________ 11. Columbus: 6,257.4
12. Sacramento, CA: 5,744.7_____________ 12. Sacramento, CA: 6,138.5
13. Austin, TX: 5,541.5_________________ 13. Austin, TX: 5,847.2
14. St. Louis: 5,447.5__________________ 14. Omaha: 5,047.2
15. Cleveland: 5,356.2__________________ 15. St. Louis: 5,001.6
16. Indianapolis: 5,348.8_______________ 16. Grand Rapids, MI: 4,922.9
17. Detroit: 5,163.1____________________ 17. Orlando: 4,911.7
18. Omaha: 5,019.8______________________ 18. Indianapolis: 4,793.5
19. Akron: 4,900.7______________________ 19. Akron: 4,532.0
20. Dayton: 4,889.3_____________________ 20. Cleveland: 4,521.8

Density at Mile Marker 5, with an Area of 78.54 Square Miles
Note that this area size is about the current city size of Cincinnati and Cleveland.
2000————————————2010
1. Chicago: 14,213.6___________________ 1. Chicago: 13,591.0
2. San Jose, CA: 10,464.0______________ 2. San Jose, CA: 11,037.1
3. Las Vegas: 8,521.9__________________ 3. Las Vegas: 9,062.8
4. Minneapolis: 7,443.0________________ 4. Minneapolis: 7,455.9
5. Milwaukee: 7,081.2__________________ 5. Milwaukee: 7,029.1
6. Pittsburgh: 7,009.9_________________ 6. Pittsburgh: 6,492.7
7. San Antonio, TX: 6,326.6____________ 7. Portland, OR: 6,442.3
8. Providence, RI: 6,048.3_____________ 8. San Antonio, TX: 6,223.4
9. Portland, OR: 5,950.1_______________ 9. Providence, RI: 6,055.8
10. Cincinnati: 5,588.9________________ 10. Sacramento, CA: 5,664.2
11. Cleveland: 5,494.6_________________ 11. Orlando: 5,274.1
12. Columbus: 5,252.9__________________ 12. Columbus: 5,152.1
13. Sacramento, CA: 5,104.0____________ 13. Cincinnati: 5,096.2
14. Orlando: 4,993.7___________________ 14. Austin, TX: 4,993.7
15. Austin, TX: 4,786.5________________ 15. Cleveland: 4,602.4
16. Detroit: 4,748.7___________________ 16. St. Louis: 4,285.4
17. St. Louis: 4,731.5_________________ 17. Indianapolis: 4,086.1
18. Indianapolis: 4,447.7______________ 18. Omaha: 3,962.2
19. Akron: 4,025.9_____________________ 19. Grand Rapids, MI: 3,887.3
20. Grand Rapids, MI: 3,990.6__________ 20. Akron: 3,778.8

So if Columbus was the same size as Cincinnati and Cleveland, it would be the most dense city of the 3. And it’s generally in the top half of the grouping in its most urban areas.

But what about further out, past the urban core?

Density at Mile Marker 10, with an Area of 314.16 Square Miles.
This area size is much larger than the city limits of Columbus, but it gives an idea of the larger area’s density and not just within the city limits.
2000———————————–2010
1. Chicago: 9,344.3______________________ 1. Chicago: 8,795.0
2. San Jose, CA: 4,563.2_________________ 2. San Jose, CA: 4,809.8
3. Minneapolis: 4,183.2__________________ 3. Las Vegas: 4,794.2
4. Detroit: 4,117.4______________________ 4. Portland, OR: 4,230.3
5. Las Vegas: 3,877.3____________________ 5. Minneapolis: 4,178.3
6. Portland: 3,780.8_____________________ 6. San Antonio, TX: 3,454.9
7. Cleveland: 3,308.4____________________ 7. Detroit: 3,354.7
8. Pittsburgh: 3,279.8___________________ 8. Columbus: 3,163.9
9. San Antonio, TX: 3,217.8______________ 9. Pittsburgh: 3,080.4
10. Milwaukee: 3,013.7___________________ 10. Orlando: 3,055.0
11. Columbus: 2,973.3____________________ 11. Sacramento, CA: 3,016.4
12. St. Louis: 2,937.6___________________ 12. Milwaukee: 3,006.2
13. Cincinnati: 2,873.4__________________ 13. Cleveland: 2,923.7
14. Orlando: 2,783.9_____________________ 14. Indianapolis: 2,772.6
15. Sacramento, CA: 2,736.7______________ 15. St. Louis: 2,751.3
16. Indianapolis: 2,652.6________________ 16. Cincinnati: 2,746.8
17. Kansas City: 2,599.0_________________ 17. Kansas City: 2,538.3
18. Providence, RI: 2,360.0______________ 18. Austin, TX: 2,439.6
19. Austin, TX: 2,111.3__________________ 19. Providence, RI: 2,375.1
20. Dayton: 1,920.7______________________ 20. Charlotte, NC: 2,332.7

So what does all this tell us? That while Columbus is not the most dense city of its peer group, or within the Midwest group, it probably does not wholly deserve its low-density, suburban reputation. Most of the measurements are in the top half of the grouping for density, yes, but it is clearly the most weak in the urban core closest to Downtown, as that ranking is the lowest for it. The Mile 0 population, for example, is down near the very bottom, and that is a good reason why densities are not as high as they should/could be. Currently, Downtown and surrounding neighborhoods are seeing a residential development boom, so that will help, but the city needs to think a lot bigger if it wants that stereotype to truly go away. The recent abandonment of the Convention Center mixed-use project is not a good way to go about that goal… and it should be a goal.


1810 US Census


The 1810 US Census doesn’t exactly have a lot of information available. The earliest censuses seem to focus more on economic information rather than population and demographics.

In 1810, Ohio had just 36 counties and Columbus had not been founded yet. Franklin County, however, did exist at the time, as well as Franklinton and a few other towns.

Franklin County
Cotton Goods Value in Dollars: $6,043
Rank of Ohio’s Counties: 3rd
Flaxen Goods Value in Dollars: $13,935
Rank of Ohio’s Counties: 13th
Blended and Unnamed Cloths and Stuffs Value in Dollars: $9,927
Rank of Ohio’s Counties: 15th
Woolen Goods Value in Dollars: $2,496
Rank of Ohio’s Counties: 13th
# of Looms: 150
# of Naileries: 1
# of Tanneries: 5

That’s all I have for now, but if I find more information about the area in 1810, I will add it here.

2012 City Population Estimates


2012 city population estimates Columbus, Ohio

Here are the 2012 city population estimates for just about every location within the Columbus Metro Area.

The numbers show what the 2010 Census population was, the July 1, 2012 estimate, and the total change over that period.

City- 2010 – 2012 – Change
Alexandria 517 518 +1
Amanda 737 741 +4
Ashley 1,330 1,344 +14
Ashville 4,097 4,115 +18
Baltimore 2,966 2,968 +2
Bexley 13,057 13,252 +195
Bremen 1,425 1,438 +13
Brice 115 116 +1
Buckeye Lake 2,746 2,723 -23
Canal Winchester 7,101 7,393 +292
Cardington 2,047 2,046 -1
Carroll 524 524 0
Chesterville 228 229 +1
Circleville 13,314 13,453 +139
Columbus 787,033 809,798 +22765
Commercial Point 1,582 1,587 +5
Corning 583 579 -4
Crooksville 2,534 2,518 -16
Darbyville 222 224 +2
Delaware 34,753 35,925 +1172
Dublin 41,751 42,906 +1155
Edison 437 439 +2
Fulton 258 259 +1
Gahanna 33,248 33,828 +580
Galena 653 666 +13
Glenford 173 176 +3
Grandview Heights 6536 6910 +374
Granville 5646 5638 -8
Gratiot 221 221 0
Grove City 35575 36832 +1257
Groveport 5363 5540 +177
Hanover 921 1002 +81
Harrisburg 320 326 +6
Hartford 397 393 -4
Heath 10310 10389 +79
Hebron 2336 2350 +14
Hemlock 155 155 0
Hilliard 28435 30564 +2129
Johnstown 4632 4806 +174
Junction City 819 816 -3
Kirkersville 525 528 +3
Lancaster 38780 38880 +100
Laurelville 527 523 -4
Lithopolis 1106 1181 +75
Lockbourne 237 241 +4
Logan 7152 7157 +5
London 9904 9876 -28
Magnetic Springs 268 270 +2
Marble Cliff 573 580 +7
Marengo 342 344 +2
Marysville 22094 22051 -43
Midway 322 322 0
Milford Center 792 802 +10
Millersport 1044 1047 +3
Minerva Park 1272 1291 +19
Mount Gilead 3660 3658 -2
Mount Sterling 1782 1716 -66
Murray City 449 445 -4
New Albany 7724 8507 +783
Newark 47573 47688 +115
New Holland 801 827 +26
New Lexington 4731 4751 +20
New Straitsville 722 720 -2
Obetz 4532 4628 +96
Orient 270 272 +2
Ostrander 643 656 +13
Pataskala 14962 15091 +129
Pickerington 18291 18692 +401
Plain City 4225 4221 -4
Pleasantville 960 955 -5
Powell 11500 11960 +460
Rendville 36 36 0
Reynoldsburg 35893 36347 +454
Richwood 2229 2238 +9
Riverlea 545 555 +10
Rushville 302 304 +2
St Louisville 373 374 +1
Shawnee 655 652 -3
Shawnee Hills 681 709 +28
Somerset 1481 1473 -8
South Bloomfield 1744 1770 +26
South Solon 355 355 0
Sparta 161 162 +1
Stoutsville 560 563 +3
Sunbury 4389 4605 +216
Tarlton 282 285 +3
Thornville 991 995 +4
Thurston 604 607 +3
Unionville Center 233 235 +2
Upper Arlington 33771 34203 +432
Urbancrest 960 975 +15
Utica 2132 2130 -2
Valleyview 620 627 +7
Westerville 36120 37073 +953
West Jefferson 4222 4199 -23
West Rushville 134 135 +1
Whitehall 18062 18403 +341
Williamsport 1023 1032 +9
Worthington 13575 13757 +182

For those counting, there are 99 places in that list. 79 of them, or 79.8%, show growth over the period. Every place within Franklin County saw growth- maybe not down to the neighborhood level- but in all of the towns and cities.

Columbus passed 800,000 for the first time, and its actual growth rate increased from about 1.1% annually to 1.6% annually.


New 2012 Metro and County Population Estimates


New 2012 Metro and County Population Estimates

New 2012 metro and county population estimates have been released by the US Census, so we’ll break down the numbers and see if any trends pop out.

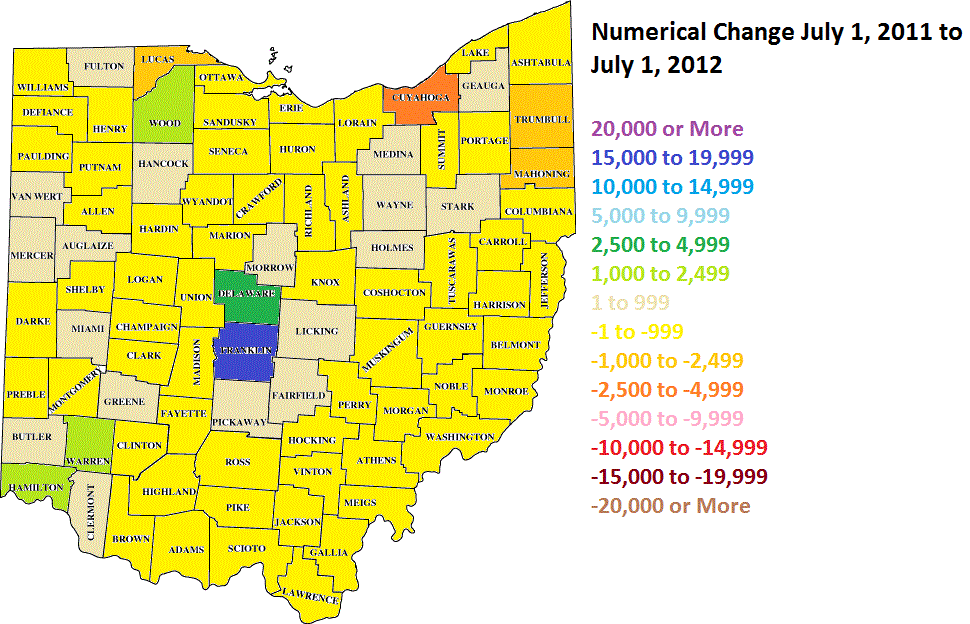
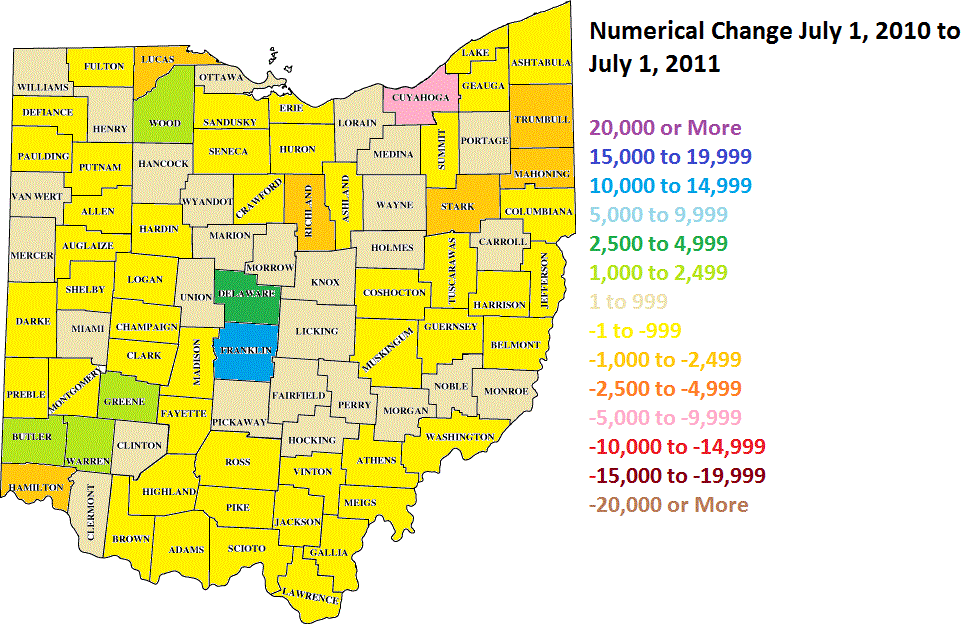
First the statewide county maps for numerical change for 2010-2011 and 2011-2012.


Some good and bad with these. The bad is that fewer counties were estimated to be growing from 2011-2012 than were in 2010-2011. The good news it that central core counties improved their growth or slowed their losses, such as Franklin, Cuyahoga and Hamilton. This may mean that population is consolidating around urban cores rather than being spread out… or it may just mean that more counties are losing population.

Top 10 Counties with Greatest Numerical Growth
1. Franklin: +16,273
2. Delaware: +2,444
3. Warren: +1,893
4. Hamilton: +1,350
5. Wood: +1,291
6. Butler: +657
7. Clermont: +619
8. Hancock: +560
9. Stark: +540
10. Geauga: +362

If we take every county estimate, Ohio grew by 10,502, which is a slight improvement from 2011′s 8,447, which itself was faster than 2010′s 7,608. Still very slow, but seemingly getting a bit better each year.

As far as the metropolitan areas, their boundaries were changed last week as new definitions for what constitutes a metro area were introduced. This produced some rather drastic changes to metro areas and their populations.

Old and New Metro Boundaries and their Old and New Populations
Akron: Did not change boundaries and still consists of Summit and Portage counties.
2011: 702,854
2012: 702,262

Canton: Did not change and is still Stark and Carroll counties.
2011: 403,164
2012: 403,455

Cincinnati: Added Union County, Indiana, but dropped Franklin County, Indiana.
2011: 2,122,330
2012: 2,128,603

Cleveland: Did not change and is still Cuyahoga, Lake, Lorain, Geauga and Medina counties.
2011: 2,068,397
2012: 2,063,535

Columbus: Added Perry and Hocking Counties.
2011: 1,925,137
2012: 1,944,002

Dayton: Dropped Preble County.
2011: 801,040
2012: 800,972

Toledo: Dropped Ottawa County.
2011: 609,320
2012: 608,711

Youngstown: Did not change, still Mahoning, Trumbull and Mercer County, PA.
2011: 561,697
2012: 558,206

As you can see, 5 of the 8 are losing population, though most had slower losses in 2012 than they did in 2011. This may also be a sign of population moving toward the urban centers, or again, could just be a blip.

One of the interesting pieces of data about the metro areas is the section on components of population change, meaning where did the growth or loss come from.

Total Metro Births July 1, 2011 to July 1, 2012 and Rank
1. Cincinnati: +27,374
2. Columbus: +25,910
3. Cleveland: +22,484
4. Dayton: +9,414
5. Akron: +7,418
6. Toledo: +7,285
7. Youngstown: +5,446

Total Metro Deaths July 1, 2011 to July 1, 2012 and Rank
1. Cleveland: -20,290
2. Cincinnati: -18,204
3. Columbus: -14,457
4. Dayton: -7,930
5. Youngstown: -6,811
6. Akron: -6,756
7. Toledo: -5,678

Natural Change (Births vs Deaths) July 1,2011 to July 1, 2012 and Rank
1. Columbus: +11,453
2. Cincinnati: +9,170
3. Cleveland: +2,194
4. Toledo: +1,607
5. Dayton: +1,484
6. Akron: +662
7. Youngstown: -1,365

Domestic Migration July 1, 2011 to July 1, 2012 and Rank
1. Columbus: +2,688
2. Akron: -2,248
3. Youngstown: -2,341
4. Dayton: -2,717
5. Toledo: -2,931
6. Cincinnati: -6,036
7. Cleveland: -10,579

Columbus is the only metro seeing positive domestic migration in Ohio.

International Migration July 1, 2011 to July 1, 2012 and Rank
1. Columbus: +4,729
2. Cleveland: +3,555
3. Cincinnati: +3,217
4. Dayton: +1,175
5. Akron: +1,009
6. Youngstown: +778
7. Toledo: +676

Total In-Migration July 1, 2011 to July 1, 2012 and Rank
1. Columbus: +7,417
2. Youngstown: -974
3. Akron: -1,239
4. Dayton: -1,542
5. Toledo: -2,255
6. Cincinnati: -2,819
7. Cleveland: -7,024

Canton is the only other Ohio metro that saw a net postive in-migration for the time period besides Columbus.

For more information on county and metro areas, follow the below links:
Metro Area Demographics/
Franklin County Demographics