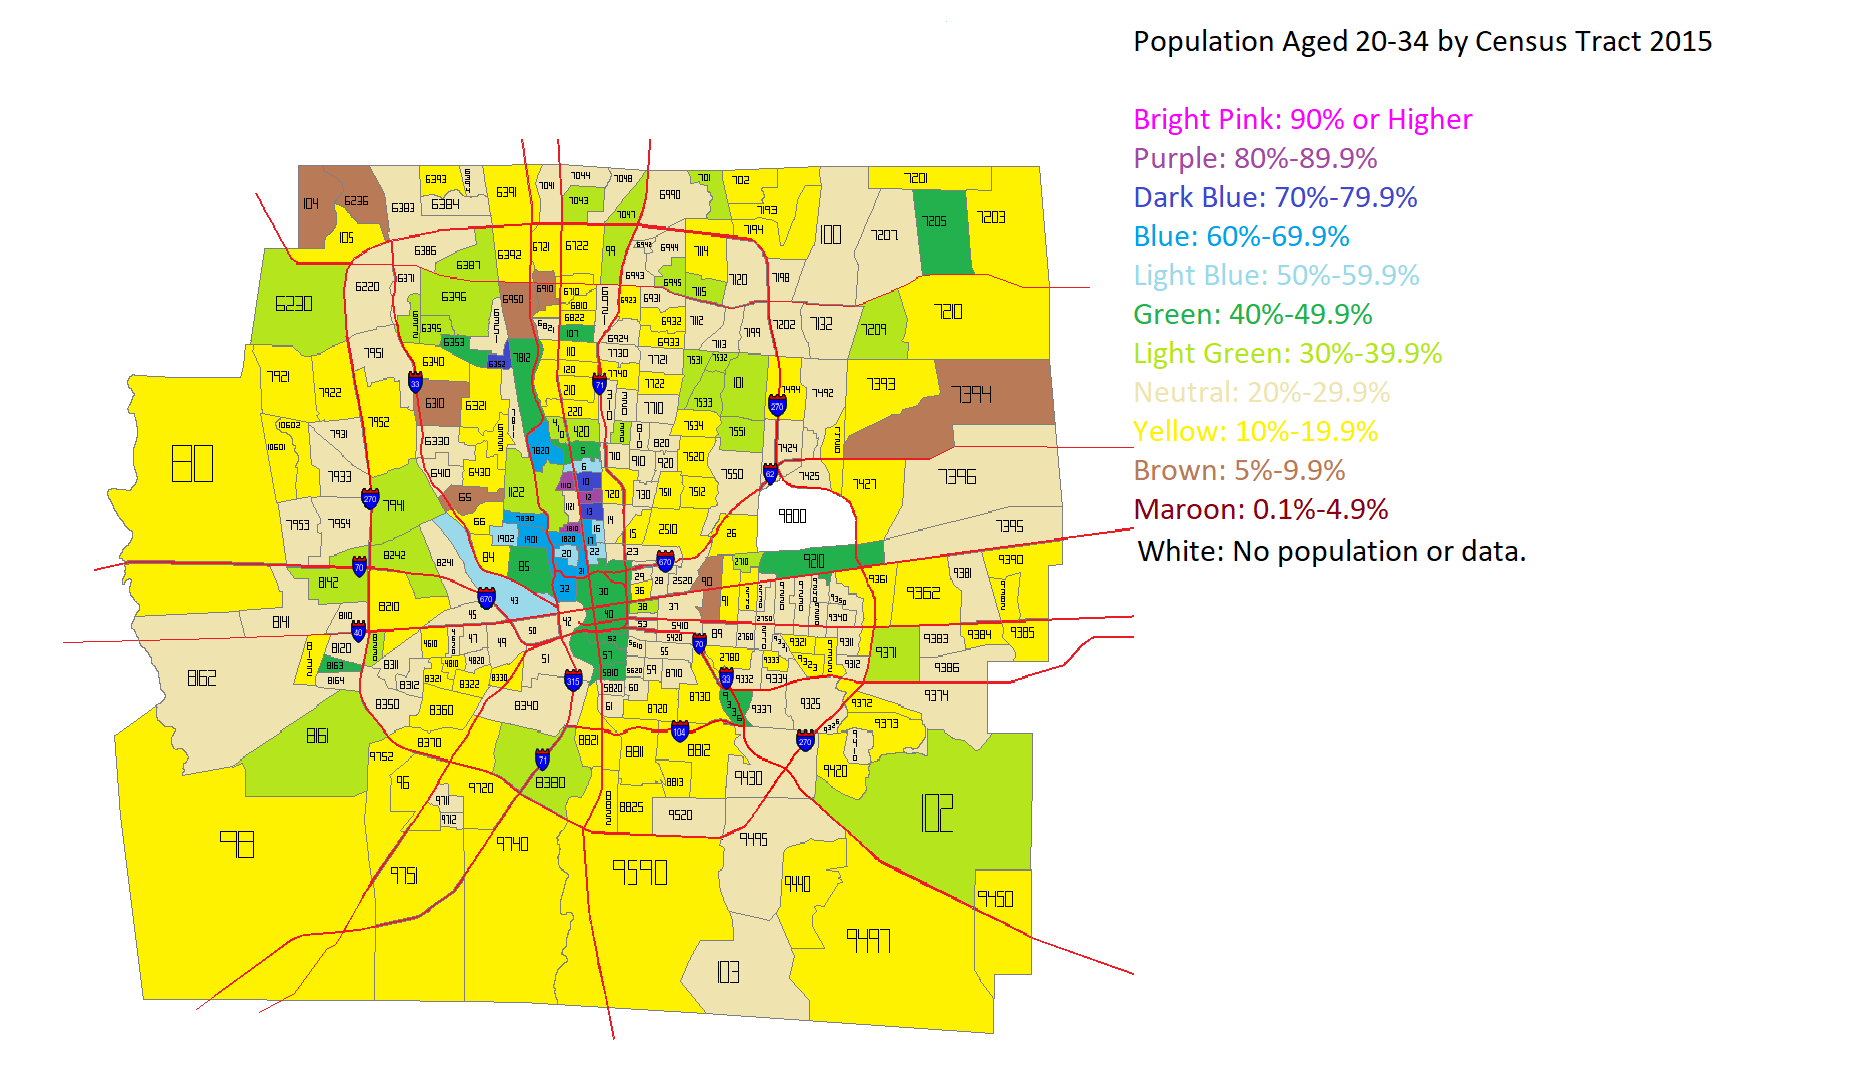
I’ve seen several articles across the internet lately questioning the idea that Millennials and young adults prefer density and urban areas. I decided to see how this played out in Franklin County overall. I first looked at the total population aged 20-34 in the year 2000 and the year 2015 by Census Tract. Here were the maps for those years.
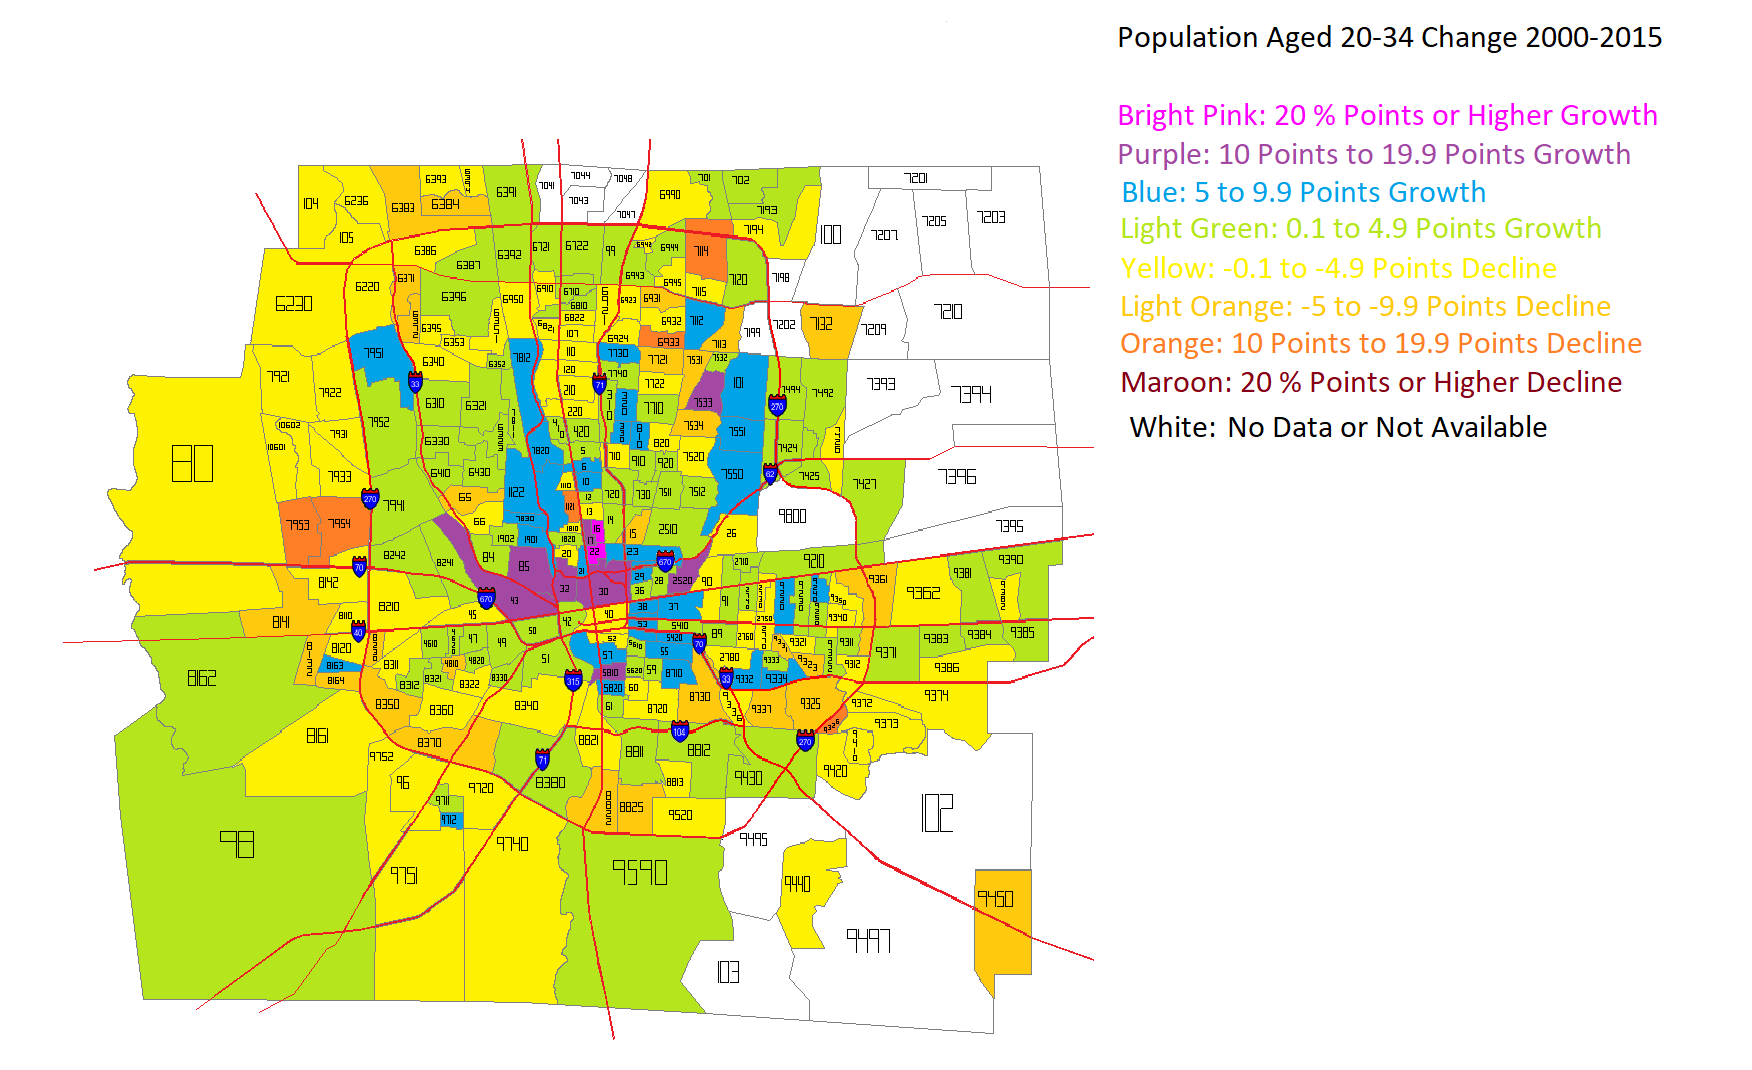
After looking at the numbers for both years, I came up with this map for how that age group had changed in the 2000-2015 period.
Unfortunately, some tracts, particularly in the eastern suburban areas, did not exist in 2000, and so I was not able to figure out the change for them during the period. The rest of the map, however, shows that the strongest growth in this age group was not only inside 270, but closest to Downtown and central corridors along Broad and High Streets. These maps don’t tell us about the relationship between those changes and the population density of the census tracts. So I went further and broke the tracts into increments of density to see where the strongest growth was occurring.
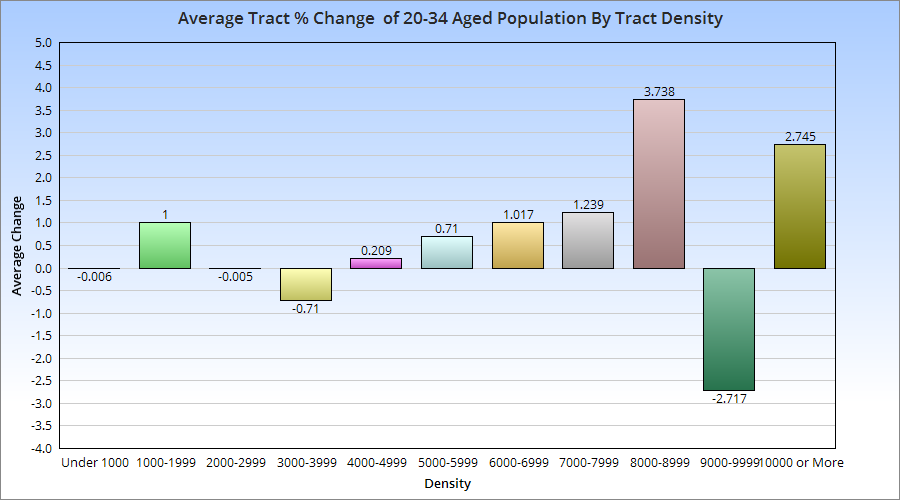
With a few exceptions, there appears to be a correlation between average 20-34 aged population growth and the density of the census tracts it occurs in. This suggests that this age group, at least in Franklin County, prefers areas with moderate to high density, which typically translates to urban living.
In Part 1 of this comparison, I looked at overall metro area densities.
For tracts, I looked over the maps of all cities within metros that had populations between 1.5 and 2.5 million (based on 2010 census). I then found every tract that had a population density of 5,000 people per square mile or higher, but I tried to stay within the core city and its immediate surroundings. In most cases, this was just within the central metro county, but some cities are split between county borders and even state borders, so I tried to use an equal approximation.
First, the total number of tracts with 5,000+ densities by city and rank. 1. Las Vegas: 290 2. San Jose: 285 3. Cleveland: 211 4. Milwaukee: 198 5. Portland: 174 6. Sacramento: 168 7. Pittsburgh: 147 8. San Antonio: 118 9. Columbus: 98 10. Virginia Beach: 92 11. Cincinnati: 84 12. Providence: 84 13. Austin: 61 14. Orlando: 47 15. Indianapolis: 46 16. Kansas City: 44 17. Nashville: 21 18. Charlotte: 16
Average Density for all Tracts that have 5,000+ Densities by Rank 1. Milwaukee: 10,394.2 2. Providence: 10,163.5 3. San Jose: 10,114.8 4. Pittsburgh: 8,753.8 5. Las Vegas: 8,604.4 6. Austin: 7,981.4 7. Cleveland: 7,882.1 8. Columbus: 7,821.8 9. Portland: 7,679.8 10. Cincinnati: 7,586.7 11. Sacramento: 7,397.3 12. Virginia Beach: 7,304.1 13. San Antonio: 6,736.5 14. Kansas City: 6,703.7 15. Orlando: 6,689.5 16. Charlotte: 6,678.2 17. Nashville: 6,558.7 18. Indianapolis: 6,170.7
Average Density of Top 15 Most Dense Tracts by Rank Milwaukee: 23,786.4 San Jose: 22,225.5 Pittsburgh: 18,581.4 Las Vegas: 18,227.8 Providence: 16,701.2 Portland: 15,401.5 Columbus: 14,733.6 Austin: 13,660.0 Cleveland: 13,458.6 Cincinnati: 12,443.9 Virginia Beach: 12,396.5 Sacramento: 12,261.4 San Antonio: 9,497.6 Orlando: 8,955.3 Kansas City: 8,476.5 Indianapolis: 7,294.0 Nashville: 7,113.9 Charlotte: 6,787.5
Columbus doesn’t do too badly with these numbers and certainly better than I was really expecting. In general, it’s more dense in parts than it gets credit for being. Las Vegas stands out as the most surprising to me, but I guess the built environment there is pretty dense when you think about it, at least in the urban core that these numbers measured. Charlotte, Indianapolis and Nashville have incredibly low densities for being major, moderate-fast growing metros/cities. Columbus and Indianapolis are often called twin cities and compared regularly, but this is one area where there’s a pretty stark difference. I plan to do a formal comparison of the two metros at some point in the future.
In regards to the 5,000+ density tracts, here’s a further breakdown.
All Tracts with a Density of 25,000 or More and % of Total 5,000+ Tracts by Rank 1. Austin: 2 3.3% 2. Milwaukee: 4 2.0% 3. San Jose: 4 1.4% 4. Virginia Beach: 1 1.1% 5. Columbus: 1 1.0% 6. Pittsburgh: 1 0.7% 7. Portland: 1 0.6% 8. Charlotte: 0 0.0% 9. Cincinnati: 0 0.0% 10. Cleveland: 0 0.0% 11. Indianapolis: 0 0.0% 12. Kansas City: 0 0.0% 13. Las Vegas: 0 0.0% 14. Nashville: 0 0.0% 15. Orlando: 0 0.0% 16. Providence: 0 0.0% 17. Sacramento: 0 0.0% 18. San Antonio: 0 0.0%
All Tracts with a Density of 20,000 or More and % of Total 5,000+ Tracts by Rank 1. Milwaukee: 13 6.6% 2. Austin: 3 4.9% 3. Columbus: 3 3.1% 4. Pittsburgh: 4 2.7% 5. San Jose: 6 2.1% 6. Las Vegas: 4 1.4% 7. Providence: 1 1.2% 8. Portland: 2 1.1% 9. Virginia Beach: 1.1% 10. Cleveland: 1 0.5% 11. Charlotte: 0 0.0% 12. Cincinnati: 0 0.0% 13. Indianapolis: 0 0.0% 14. Kansas City: 0 0.0% 15. Nashville: 0 0.0% 16. Orlando: 0 0.0% 17. Sacramento: 0 0.0% 18. San Antonio: 0 0.0%
All Tracts with a Density of 15,000 or More and % of Total 5,000+ Tracts by Rank 1. Milwaukee: 32 16.2% 2. Providence: 12 14.3% 3. San Jose: 31 10.9% 4. Austin: 5 8.2% 5. Pittsburgh: 12 8.2% 6. Columbus: 6 6.1% 7. Las Vegas: 13 4.5% 8. Portland: 6 3.4% 9. Sacramento: 3 1.8% 10. Cincinnati: 1 1.2% 11. Virginia Beach: 1 1.1% 12. Cleveland: 2 0.9% 13. Charlotte: 0 0.0% 14. Indianapolis: 0 0.0% 15. Kansas City: 0 0.0% 16. Nashville: 0 0.0% 17. Orlando: 0 0.0% 18. San Antonio: 0 0.0%
All Tracts with a Density of 10,000 or More and % of Total 5,000+ Tracts by Rank 1. Providence: 37 44.0% 2. San Jose: 112 39.3% 3. Milwaukee: 52 26.3% 4. Pittsburgh: 36 24.5% 5. Las Vegas: 67 23.1% 6. Cleveland: 37 17.5% 7. Cincinnati: 14 16.7% 8. Austin: 9 14.8% 9. Nashville: 3 14.3% 10. Portland: 21 12.1% 11. Virginia Beach: 8 8.7% 12. Orlando: 4 8.5% 13. Columbus: 8 8.2% 14. Sacramento: 13 7.7% 15. Charlotte: 1 6.3% 16. San Antonio: 3 2.5% 17. Kansas City: 1 2.3% 18. Indianapolis: 0 0.0%
All Tracts with a Density of 9,000 or More and % of Total 5,000+ Tracts by Rank 1. Providence: 47 56.0% 2. San Jose: 132 46.3% 3. Las Vegas: 101 34.8% 4. Milwaukee: 65 32.8% 5. Pittsburgh: 47 32.0% 6. Cleveland: 52 24.6% 7. Cincinnati: 19 22.6% 8. Austin: 13 21.3% 9. Portland: 29 16.7% 10. Columbus: 16 16.3% 11. Nashville: 3 14.3% 12. Sacramento: 24 14.3% 13. Kansas City: 6 13.6% 14. Charlotte: 2 12.5% 15. Virginia Beach: 10 10.7% 16. Orlando: 5 10.6% 17. San Antonio: 9 7.6% 18. Indianapolis: 0 0.0%
All Tracts with a Density of 8,000 or More and % of Total 5,000+ Tracts by Rank 1. San Jose: 183 64.2% 2. Providence: 52 61.9% 3. Las Vegas: 136 46.9% 4. Pittsburgh: 63 42.9% 5. Milwaukee: 82 41.4% 6. Cleveland: 87 41.2% 7. Sacramento: 49 29.2% 8. Austin: 17 27.9% 9. Cincinnati: 23 27.4% 10. Columbus: 26 26.5% 11. Portland: 41 23.6% 12. Kansas City: 10 22.7% 13. Orlando: 10 21.3% 14. Virginia Beach: 19 20.7% 15. San Antonio: 17 14.4% 16. Nashville: 3 14.3% 17. Charlotte: 2 12.5% 18. Indianapolis: 2 4.3%
All Tracts with a Density of 7,000 or More and % of Total 5,000+ Tracts by Rank 1. San Jose: 222 77.9% 2. Providence: 58 69.0% 3. Las Vegas: 185 63.8% 4. Cleveland: 119 56.4% 5. Milwaukee: 111 56.1% 6. Pittsburgh: 80 54.4% 7. Sacramento: 83 49.4% 8. Cincinnati: 38 45.2% 9. Columbus: 42 42.9% 10. Virginia Beach: 39 42.4% 11. Portland: 71 40.8% 12. Austin: 23 37.7% 13. Charlotte: 5 31.3% 14. Kansas City: 13 29.5% 15. San Antonio: 32 27.1% 16. Orlando: 12 25.5% 17. Nashville: 4 19.0% 18. Indianapolis: 8 17.4%
All Tracts with a Density of 6,000 or More and % of Total 5,000+ Tracts by Rank 1. San Jose: 260 91.2% 2. Las Vegas: 235 81.0% 3. Providence: 68 81.0% 4. Pittsburgh: 113 76.9% 5. Sacramento: 122 72.6% 6. Cleveland: 153 72.5% 7. Milwaukee: 142 71.7% 8. Columbus: 66 67.3% 9. Portland: 113 64.9% 10. Cincinnati: 54 64.3% 11. Orlando: 29 61.7% 12. San Antonio: 71 60.2% 13. Virginia Beach: 55 59.8% 14. Austin: 35 57.4% 15. Kansas City: 25 56.8% 16. Nashville: 10 47.6% 17. Charlotte: 7 43.8% 18. Indianapolis: 20 43.5%
Top 20 Most Dense Tracts from all 18 Metros 1. 48,971.9: Virginia Beach #38 2. 48,602.1: San Jose #500902 3. 32,306.4: Pittsburgh #404 4. 31,919.9: Milwaukee #11 5. 31,627.6: Milwaukee #147 6. 29,072: Columbus #181 7. 28,922.9: San Jose #509107 8. 27,544.8: Milwaukee #164 9. 26,825.8: Portland #56 10. 25,543.1: Austin #603 11. 25,271.2: Milwaukee #146 12. 25,229.7: Austin #604 13. 25,195.3: San Jose #509403 14. 25,053.2: San Jose #503118 15. 24,925.7: Columbus #13 16. 24,882.3: Las Vegas #2996 17. 24,666.9: Pittsburgh #9822 18. 24,481.1: Pittsburgh #406 19. 24,043.4: Portland #48 20. 24,025.6: Las Vegas #2207