In Franklin County, the immigrant- or foreign-born- population has been growing rapidly for the last few decades. Latin American immigration was dominant for many years, but has recently taken secondary position to even faster Asian growth. But where does the immigrant population live, exactly? Where they end up in the county is perhaps not where common belief would always suggest. The interactive map below breaks down not only the main continent of origin for immigrants by census tract, but also gives the top 5 specific origin nations. While at first glance, the continents seem heavily grouped together, a deeper look at nations of origin indicate that immigrant populations are much more diverse and spread out much more evenly than it appears.
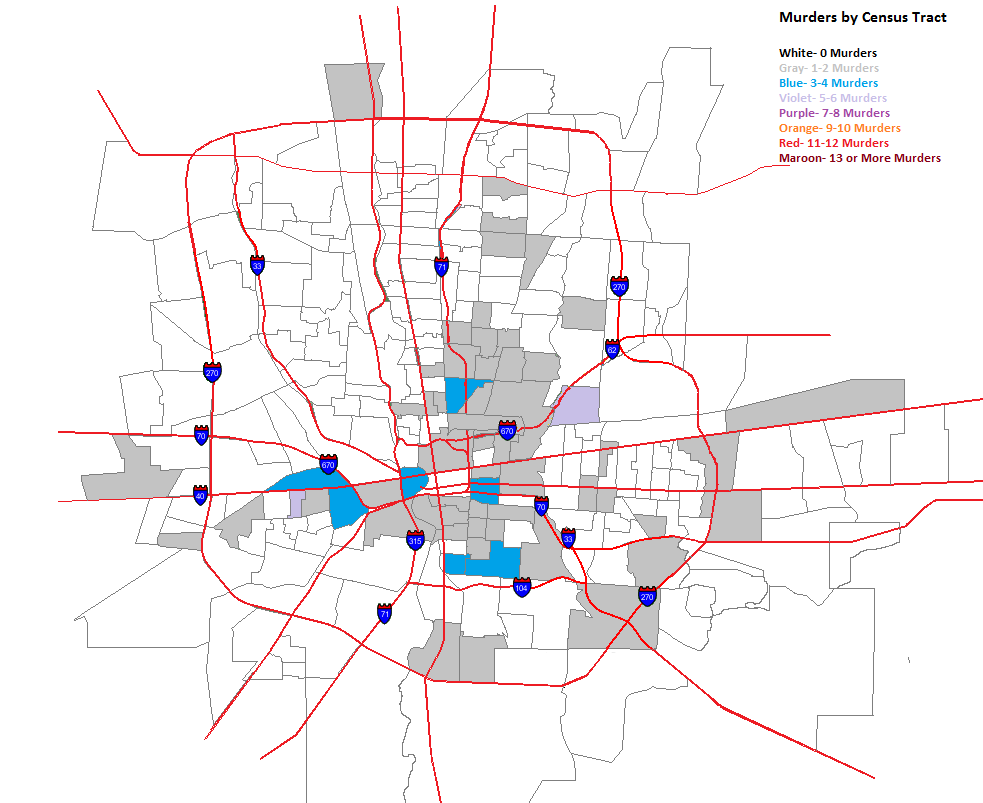
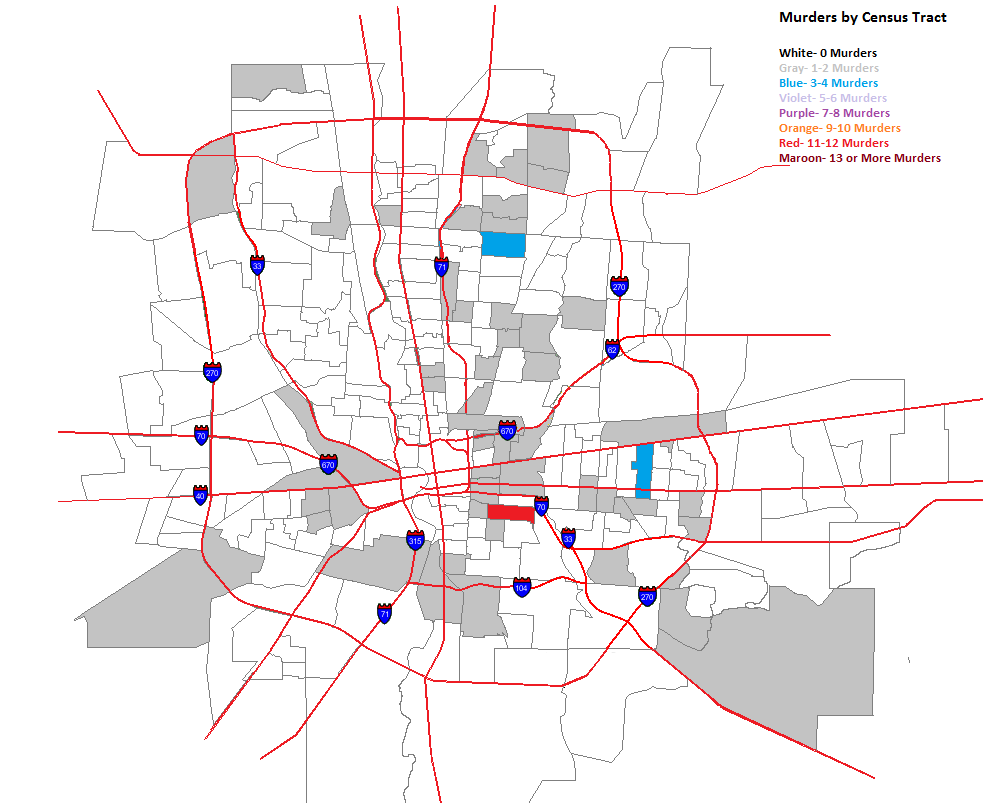
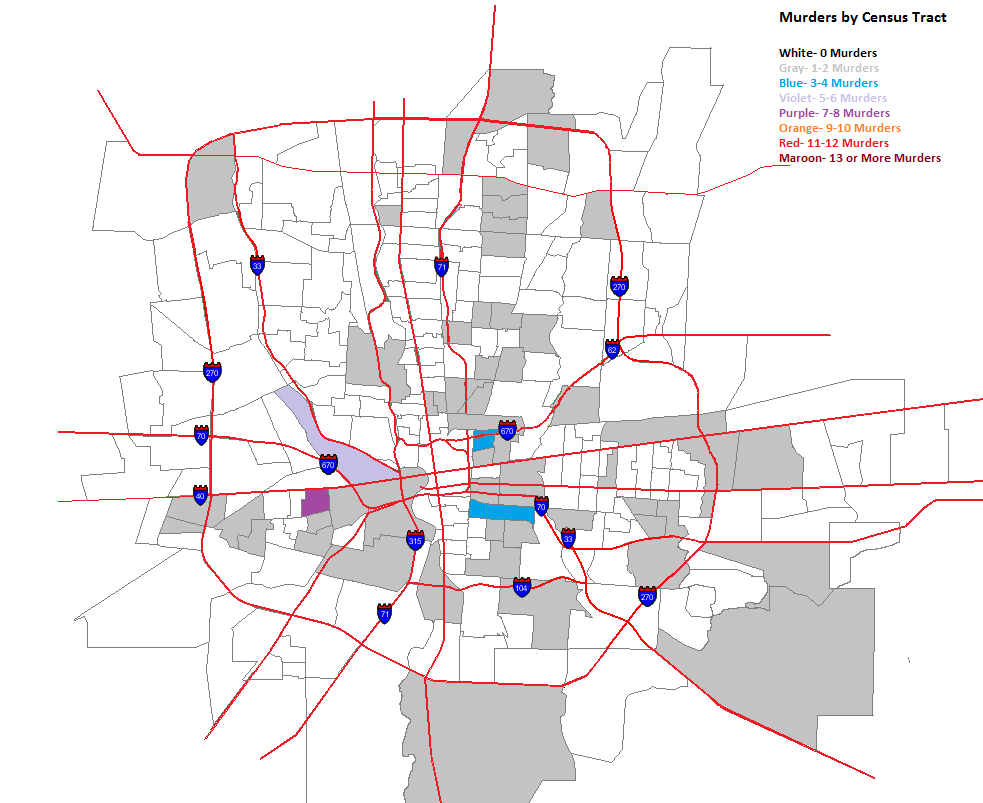
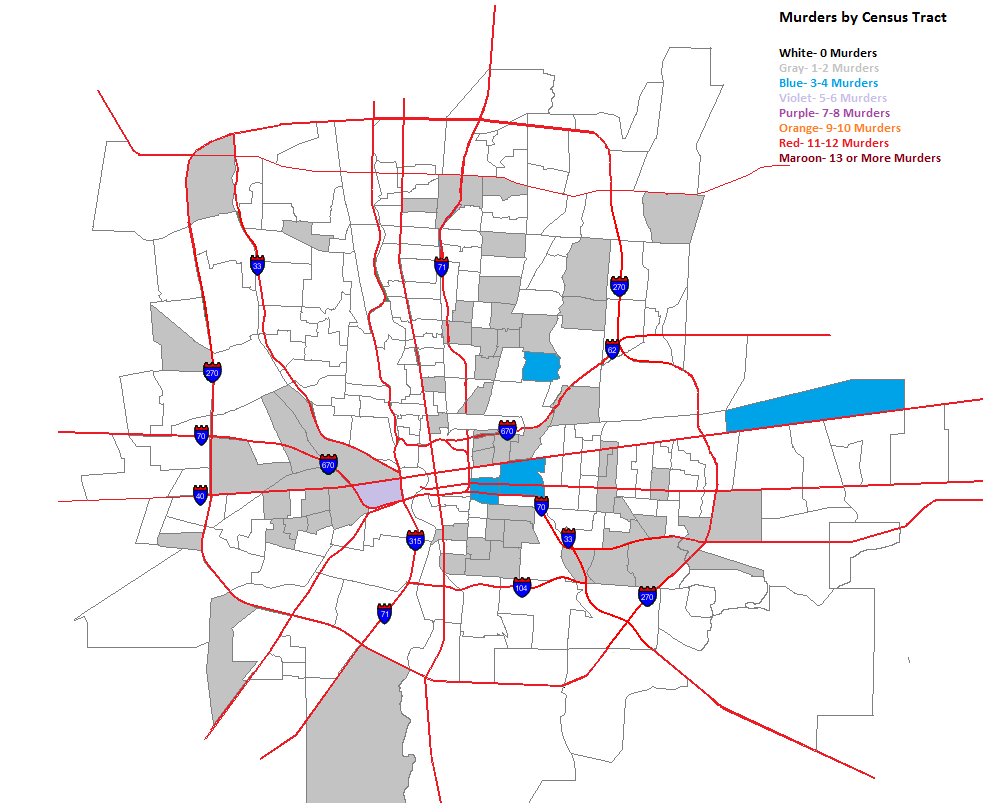
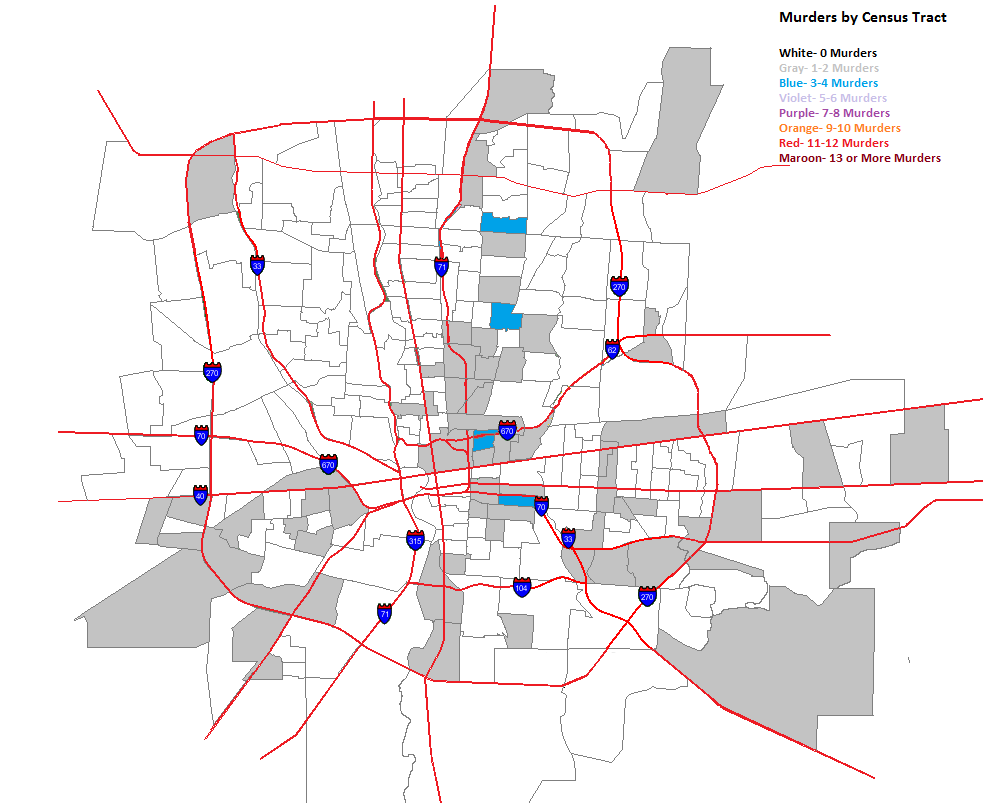
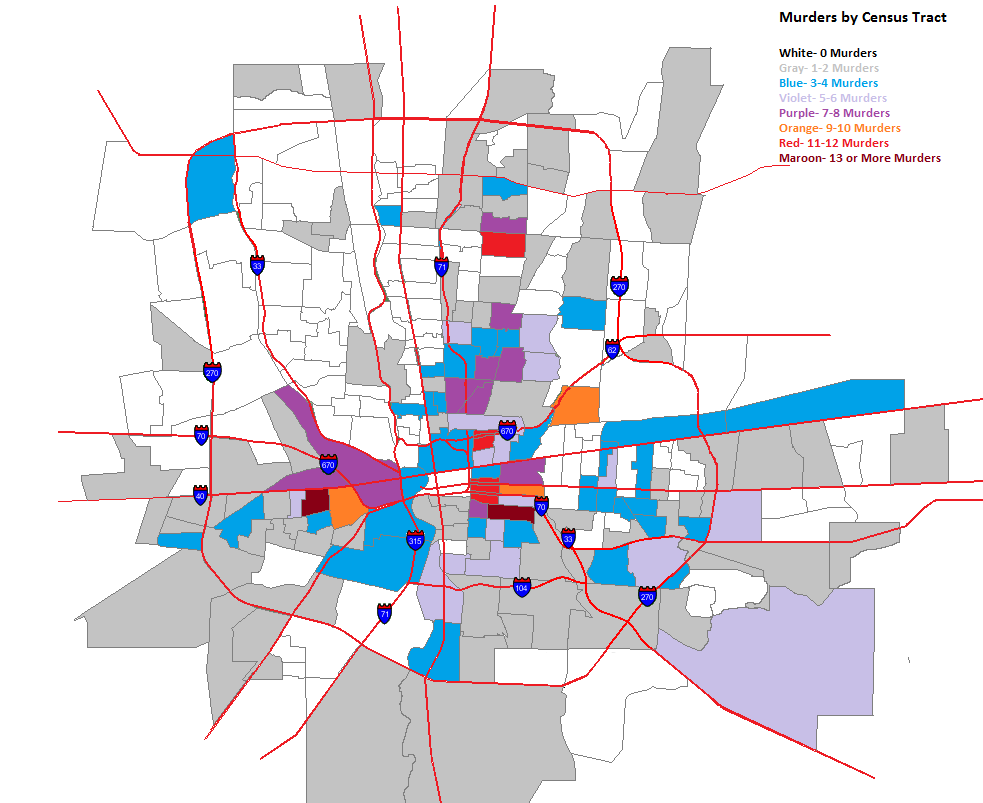
A few days ago, I posted maps for murders by zip code. Because zip codes encompass such large areas, they aren’t as accurate in showing where murders are taking place within them. To help show this more, I broke the maps down into Columbus murders by census tract. While the tracts can include large areas also, they are much smaller than zip codes and allow us to see more at the neighborhood level.
So here they are.
The same forces spreading murder further out into the suburbs in the zip codes seems to be at play in tracts as well. Here are the totals for the entire period.
The High Street corridor from Merion Village up through Worthington has very low or non-existent murder rates. This is also true for most of Whitehall, surprisingly, Bexley, most of the Northwest Side and much of the North Side, apart from the Tamarack Circle area.
In Part 1 of this comparison, I looked at overall metro area densities.
For tracts, I looked over the maps of all cities within metros that had populations between 1.5 and 2.5 million (based on 2010 census). I then found every tract that had a population density of 5,000 people per square mile or higher, but I tried to stay within the core city and its immediate surroundings. In most cases, this was just within the central metro county, but some cities are split between county borders and even state borders, so I tried to use an equal approximation.
First, the total number of tracts with 5,000+ densities by city and rank. 1. Las Vegas: 290 2. San Jose: 285 3. Cleveland: 211 4. Milwaukee: 198 5. Portland: 174 6. Sacramento: 168 7. Pittsburgh: 147 8. San Antonio: 118 9. Columbus: 98 10. Virginia Beach: 92 11. Cincinnati: 84 12. Providence: 84 13. Austin: 61 14. Orlando: 47 15. Indianapolis: 46 16. Kansas City: 44 17. Nashville: 21 18. Charlotte: 16
Average Density for all Tracts that have 5,000+ Densities by Rank 1. Milwaukee: 10,394.2 2. Providence: 10,163.5 3. San Jose: 10,114.8 4. Pittsburgh: 8,753.8 5. Las Vegas: 8,604.4 6. Austin: 7,981.4 7. Cleveland: 7,882.1 8. Columbus: 7,821.8 9. Portland: 7,679.8 10. Cincinnati: 7,586.7 11. Sacramento: 7,397.3 12. Virginia Beach: 7,304.1 13. San Antonio: 6,736.5 14. Kansas City: 6,703.7 15. Orlando: 6,689.5 16. Charlotte: 6,678.2 17. Nashville: 6,558.7 18. Indianapolis: 6,170.7
Average Density of Top 15 Most Dense Tracts by Rank Milwaukee: 23,786.4 San Jose: 22,225.5 Pittsburgh: 18,581.4 Las Vegas: 18,227.8 Providence: 16,701.2 Portland: 15,401.5 Columbus: 14,733.6 Austin: 13,660.0 Cleveland: 13,458.6 Cincinnati: 12,443.9 Virginia Beach: 12,396.5 Sacramento: 12,261.4 San Antonio: 9,497.6 Orlando: 8,955.3 Kansas City: 8,476.5 Indianapolis: 7,294.0 Nashville: 7,113.9 Charlotte: 6,787.5
Columbus doesn’t do too badly with these numbers and certainly better than I was really expecting. In general, it’s more dense in parts than it gets credit for being. Las Vegas stands out as the most surprising to me, but I guess the built environment there is pretty dense when you think about it, at least in the urban core that these numbers measured. Charlotte, Indianapolis and Nashville have incredibly low densities for being major, moderate-fast growing metros/cities. Columbus and Indianapolis are often called twin cities and compared regularly, but this is one area where there’s a pretty stark difference. I plan to do a formal comparison of the two metros at some point in the future.
In regards to the 5,000+ density tracts, here’s a further breakdown.
All Tracts with a Density of 25,000 or More and % of Total 5,000+ Tracts by Rank 1. Austin: 2 3.3% 2. Milwaukee: 4 2.0% 3. San Jose: 4 1.4% 4. Virginia Beach: 1 1.1% 5. Columbus: 1 1.0% 6. Pittsburgh: 1 0.7% 7. Portland: 1 0.6% 8. Charlotte: 0 0.0% 9. Cincinnati: 0 0.0% 10. Cleveland: 0 0.0% 11. Indianapolis: 0 0.0% 12. Kansas City: 0 0.0% 13. Las Vegas: 0 0.0% 14. Nashville: 0 0.0% 15. Orlando: 0 0.0% 16. Providence: 0 0.0% 17. Sacramento: 0 0.0% 18. San Antonio: 0 0.0%
All Tracts with a Density of 20,000 or More and % of Total 5,000+ Tracts by Rank 1. Milwaukee: 13 6.6% 2. Austin: 3 4.9% 3. Columbus: 3 3.1% 4. Pittsburgh: 4 2.7% 5. San Jose: 6 2.1% 6. Las Vegas: 4 1.4% 7. Providence: 1 1.2% 8. Portland: 2 1.1% 9. Virginia Beach: 1.1% 10. Cleveland: 1 0.5% 11. Charlotte: 0 0.0% 12. Cincinnati: 0 0.0% 13. Indianapolis: 0 0.0% 14. Kansas City: 0 0.0% 15. Nashville: 0 0.0% 16. Orlando: 0 0.0% 17. Sacramento: 0 0.0% 18. San Antonio: 0 0.0%
All Tracts with a Density of 15,000 or More and % of Total 5,000+ Tracts by Rank 1. Milwaukee: 32 16.2% 2. Providence: 12 14.3% 3. San Jose: 31 10.9% 4. Austin: 5 8.2% 5. Pittsburgh: 12 8.2% 6. Columbus: 6 6.1% 7. Las Vegas: 13 4.5% 8. Portland: 6 3.4% 9. Sacramento: 3 1.8% 10. Cincinnati: 1 1.2% 11. Virginia Beach: 1 1.1% 12. Cleveland: 2 0.9% 13. Charlotte: 0 0.0% 14. Indianapolis: 0 0.0% 15. Kansas City: 0 0.0% 16. Nashville: 0 0.0% 17. Orlando: 0 0.0% 18. San Antonio: 0 0.0%
All Tracts with a Density of 10,000 or More and % of Total 5,000+ Tracts by Rank 1. Providence: 37 44.0% 2. San Jose: 112 39.3% 3. Milwaukee: 52 26.3% 4. Pittsburgh: 36 24.5% 5. Las Vegas: 67 23.1% 6. Cleveland: 37 17.5% 7. Cincinnati: 14 16.7% 8. Austin: 9 14.8% 9. Nashville: 3 14.3% 10. Portland: 21 12.1% 11. Virginia Beach: 8 8.7% 12. Orlando: 4 8.5% 13. Columbus: 8 8.2% 14. Sacramento: 13 7.7% 15. Charlotte: 1 6.3% 16. San Antonio: 3 2.5% 17. Kansas City: 1 2.3% 18. Indianapolis: 0 0.0%
All Tracts with a Density of 9,000 or More and % of Total 5,000+ Tracts by Rank 1. Providence: 47 56.0% 2. San Jose: 132 46.3% 3. Las Vegas: 101 34.8% 4. Milwaukee: 65 32.8% 5. Pittsburgh: 47 32.0% 6. Cleveland: 52 24.6% 7. Cincinnati: 19 22.6% 8. Austin: 13 21.3% 9. Portland: 29 16.7% 10. Columbus: 16 16.3% 11. Nashville: 3 14.3% 12. Sacramento: 24 14.3% 13. Kansas City: 6 13.6% 14. Charlotte: 2 12.5% 15. Virginia Beach: 10 10.7% 16. Orlando: 5 10.6% 17. San Antonio: 9 7.6% 18. Indianapolis: 0 0.0%
All Tracts with a Density of 8,000 or More and % of Total 5,000+ Tracts by Rank 1. San Jose: 183 64.2% 2. Providence: 52 61.9% 3. Las Vegas: 136 46.9% 4. Pittsburgh: 63 42.9% 5. Milwaukee: 82 41.4% 6. Cleveland: 87 41.2% 7. Sacramento: 49 29.2% 8. Austin: 17 27.9% 9. Cincinnati: 23 27.4% 10. Columbus: 26 26.5% 11. Portland: 41 23.6% 12. Kansas City: 10 22.7% 13. Orlando: 10 21.3% 14. Virginia Beach: 19 20.7% 15. San Antonio: 17 14.4% 16. Nashville: 3 14.3% 17. Charlotte: 2 12.5% 18. Indianapolis: 2 4.3%
All Tracts with a Density of 7,000 or More and % of Total 5,000+ Tracts by Rank 1. San Jose: 222 77.9% 2. Providence: 58 69.0% 3. Las Vegas: 185 63.8% 4. Cleveland: 119 56.4% 5. Milwaukee: 111 56.1% 6. Pittsburgh: 80 54.4% 7. Sacramento: 83 49.4% 8. Cincinnati: 38 45.2% 9. Columbus: 42 42.9% 10. Virginia Beach: 39 42.4% 11. Portland: 71 40.8% 12. Austin: 23 37.7% 13. Charlotte: 5 31.3% 14. Kansas City: 13 29.5% 15. San Antonio: 32 27.1% 16. Orlando: 12 25.5% 17. Nashville: 4 19.0% 18. Indianapolis: 8 17.4%
All Tracts with a Density of 6,000 or More and % of Total 5,000+ Tracts by Rank 1. San Jose: 260 91.2% 2. Las Vegas: 235 81.0% 3. Providence: 68 81.0% 4. Pittsburgh: 113 76.9% 5. Sacramento: 122 72.6% 6. Cleveland: 153 72.5% 7. Milwaukee: 142 71.7% 8. Columbus: 66 67.3% 9. Portland: 113 64.9% 10. Cincinnati: 54 64.3% 11. Orlando: 29 61.7% 12. San Antonio: 71 60.2% 13. Virginia Beach: 55 59.8% 14. Austin: 35 57.4% 15. Kansas City: 25 56.8% 16. Nashville: 10 47.6% 17. Charlotte: 7 43.8% 18. Indianapolis: 20 43.5%
Top 20 Most Dense Tracts from all 18 Metros 1. 48,971.9: Virginia Beach #38 2. 48,602.1: San Jose #500902 3. 32,306.4: Pittsburgh #404 4. 31,919.9: Milwaukee #11 5. 31,627.6: Milwaukee #147 6. 29,072: Columbus #181 7. 28,922.9: San Jose #509107 8. 27,544.8: Milwaukee #164 9. 26,825.8: Portland #56 10. 25,543.1: Austin #603 11. 25,271.2: Milwaukee #146 12. 25,229.7: Austin #604 13. 25,195.3: San Jose #509403 14. 25,053.2: San Jose #503118 15. 24,925.7: Columbus #13 16. 24,882.3: Las Vegas #2996 17. 24,666.9: Pittsburgh #9822 18. 24,481.1: Pittsburgh #406 19. 24,043.4: Portland #48 20. 24,025.6: Las Vegas #2207