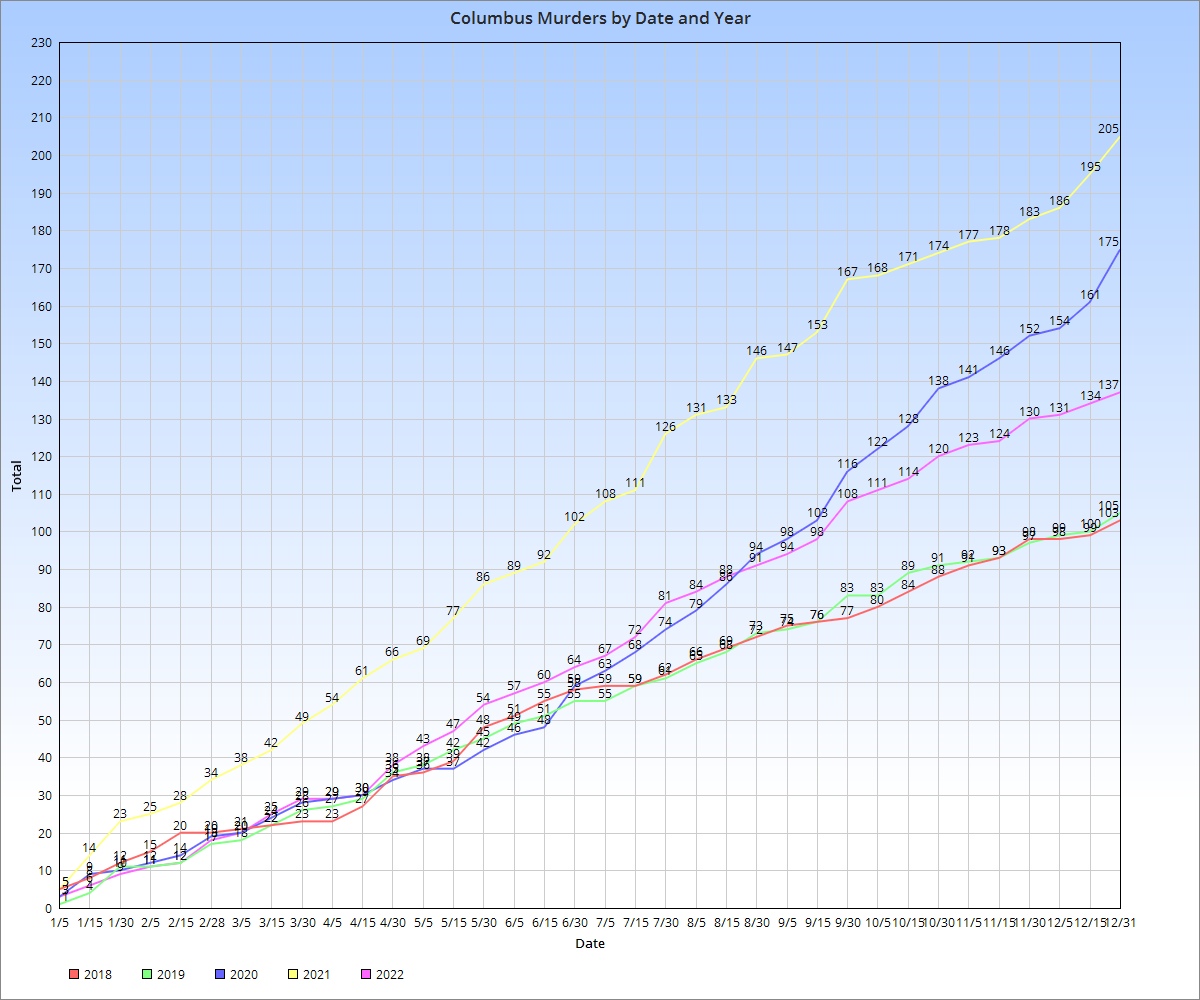
I decided to create this Columbus murder tracker for a few reasons. First, 2020 and 2021 produced consecutive records for total murders in the city, with 2021 coming in far above all other years on record. Additionally, 2021 managed to have the highest murder rate overall, narrowly beating out the early 1990s crack epidemic years. This is significant given that in 2021, the city had a much larger population than it did 30 years ago. I wanted to see if this trend would continue in 2022 or if 2021 was just a very bad fluke.
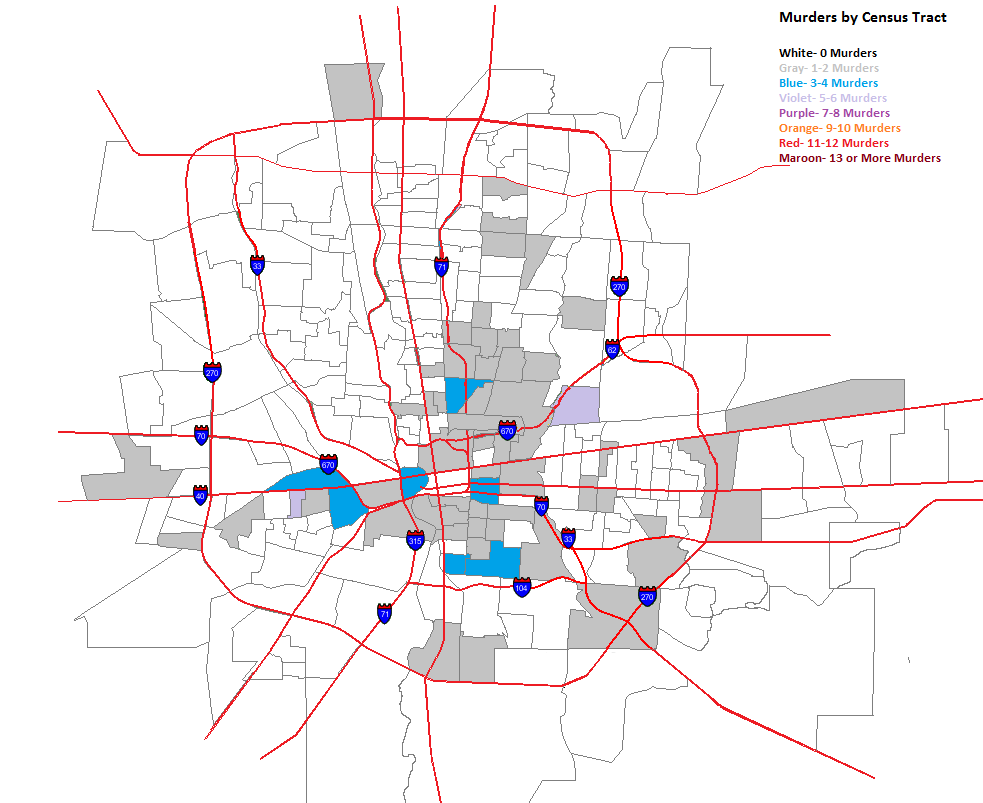
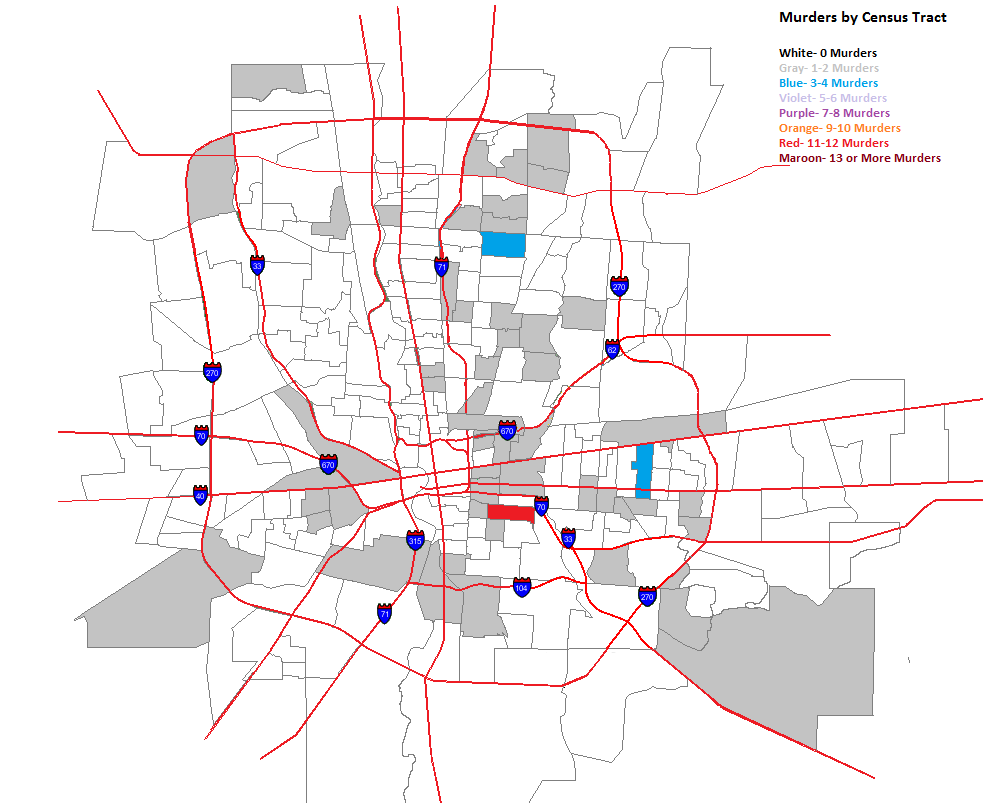
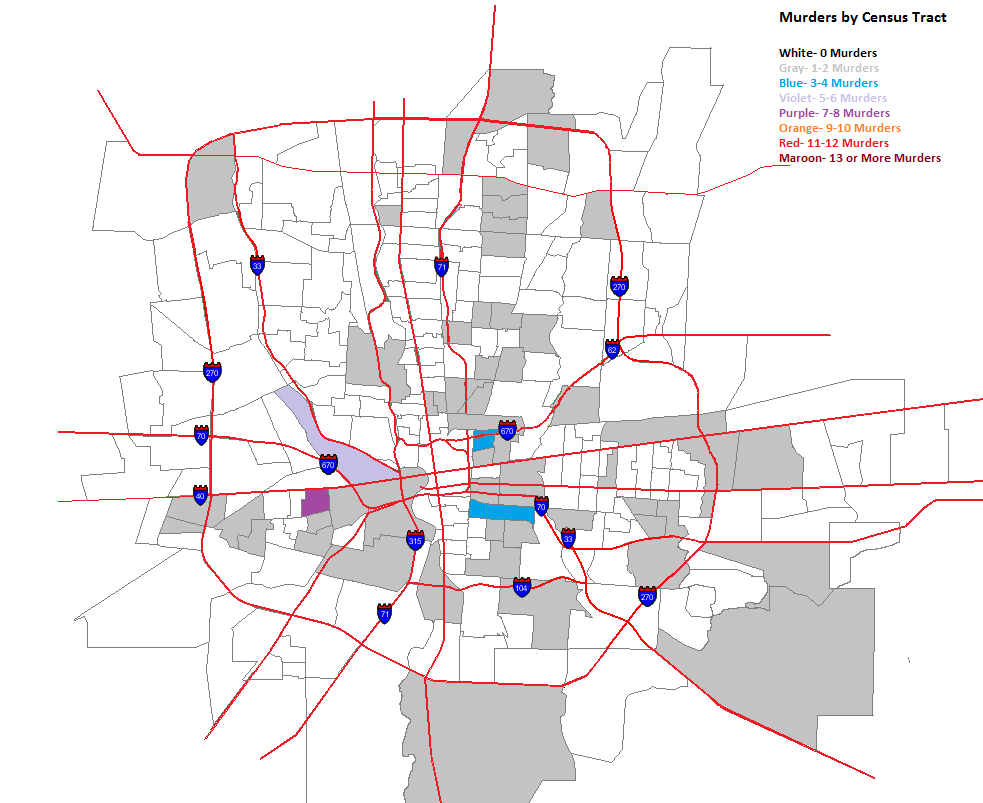
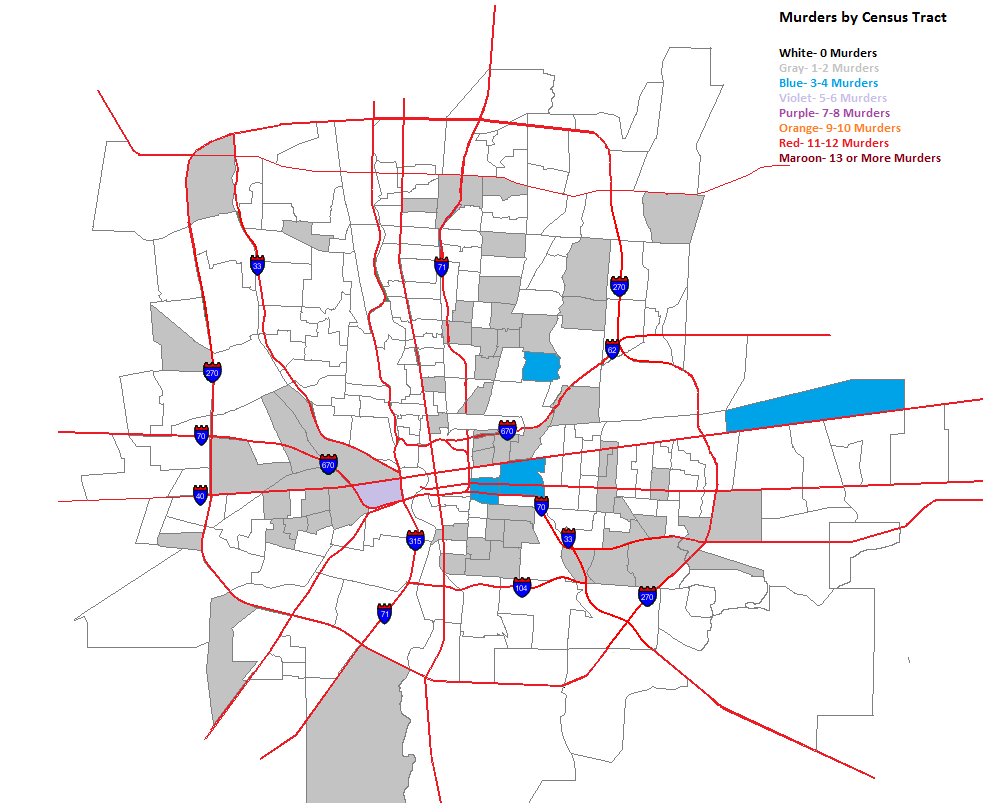
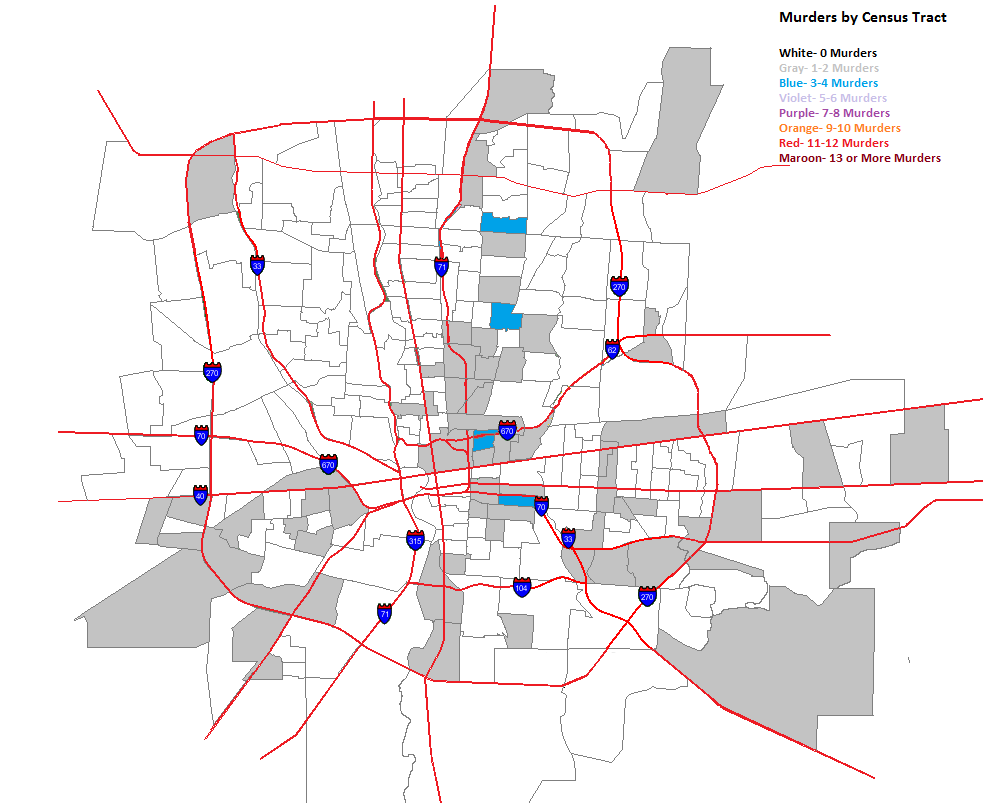
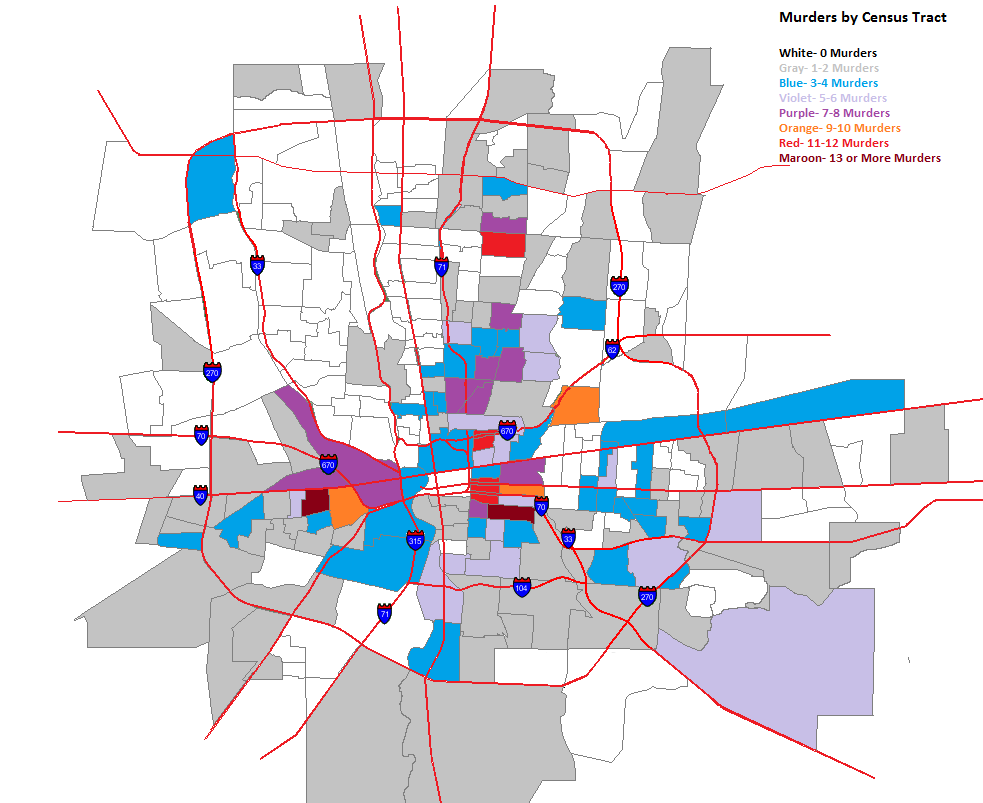
Second, I wanted to monitor just where murders were taking place in the city. Columbus is going through rapid changes, so I wanted to see if neighborhoods that have been seeing revitalization are still having violent crime issues.
To find out the answers to these questions, this murder tracker monitored homicides through the year and compared the results with previous years. A graph below counts total murders by specific dates of every year since 2018 vs. 2022. Additionally, an interactive map is provided to give further details on specific locations and report information. Homicide data is mostly provided by the Columbus Division of Police
2022 Murders by Month
January: 9
February: 9
March: 11
April: 9
May: 17
June: 9
July: 17
August: 11
September: 16
October: 13
November: 9
December: 7
The 2022 final numbers are in! 137 murders took place across the year. While not exactly good, this represents a significant decline from both 2020 and 2021. There were 68 fewer than 2021 and 38 fewer than 2020. With luck, this trend of decline will continue into 2023.
It is possible that additional murders will be added to the 2022 over the next few days/weeks/months, so this total will probably change a bit in time. Regardless, 2022 will still end up a vast improvement from last year’s record.
Starting in 2023, the Murder Tracker will be located on the main Columbus Crime Statistics page.