In the second part of this series, we will look at homicide rates by city and state. Out of all violent crimes, it is arguably what gets the most media and public attention, and causes the most general fear. See overall violent crime rates in part 1.
Homicide Rate Per 100K People By Year
2000————————————2010———————————-2020
1. New Orleans: 42.1———–1. New Orleans: 50.9———–1. St. Louis: 87.2
2. Washington DC: 41.8——-2. St. Louis: 45.1—————–2. New Orleans: 52.3
3. Detroit: 41.6——————-3. Detroit: 43.4——————–3. Detroit: 51.3
4. Baltimore: 40.1—————4. Baltimore: 35.9—————–4. Baltimore: 51.0
5. St. Louis: 35.6—————-5. Newark: 32.5——————-5. Memphis: 45.6
6. Atlanta: 32.2——————-6. Oakland: 23.0—————–6. Cleveland: 42.9
7. Kansas City: 25.6————7. Cincinnati: 22.9—————7. Kansas City: 34.6
8. Memphis: 22.6—————-8. Kansas City: 22.2————8. Milwaukee: 33.1
9. Chicago: 21.8—————–9. Atlanta: 22.1——————9. Cincinnati: 29.7
10. Newark, NJ: 21.2———-10. Washington DC: 21.9—–10. Washington DC: 28.7
11. Philadelphia: 21.0———-11. Buffalo: 21.0—————-11. Indianapolis: 24.3
12. Milwaukee: 20.4————12. Cleveland: 20.4————12. Louisville: 23.7
13. Oakland: 20.0—————13. Philadelphia: 20.1———13. Oakland: 23.1
14. Dallas: 19.4——————14. Las Vegas: 18.3———–14. Buffalo: 21.9
15. Las Vegas: 18.8————-15. Pittsburgh: 18.0————15. Greensboro: 19.7
16. Miami: 18.2——————-16. Miami: 17.0—————–16. Toledo: 19.6
17. Durham, NC: 15.0———-17. Stockton: 16.8————–17. Columbus: 19.2
18. Los Angeles: 14.9———–18. Chicago: 16.0————–18. Minneapolis: 18.4
19. Cleveland: 14.8————–19. Milwaukee: 16.0———–19. Chicago: 18.1
20. Charlotte: 13.9—————20. Memphis: 13.8————-20. Dallas: 18.1
21. Buffalo: 13.3——————21. Tulsa: 13.8——————21. Newark: 18.0
22. Nashville: 13.2—————22. Houston: 12.8————–22. Stockton: 17.5
23. Minneapolis: 13.1———–23. Dallas: 12.4—————–23. Houston: 17.4
24. Tampa: 12.5——————24. Columbus: 12.1————24. Tulsa: 17.4
25. Indianapolis: 12.3———–25. Boston: 11.8—————-25. Nashville: 16.4
26. Stockton, CA: 12.3———26. Indianapolis: 11.2———-26. Las Vegas: 15.0
27. Tucson: 12.3—————–27. Jersey City: 10.5———-27. Fort Wayne: 14.8
28. Houston: 11.8—————28. Durham: 10.1—————28. Jacksonville: 14.7
29. Phoenix: 11.5—————29. Tucson: 9.8—————–29. Albuquerque: 14.2
30. Fort Worth: 11.4————30. Jacksonville: 9.7———-30. Fresno: 14.2
31. Orlando: 11.3—————31. Minneapolis: 9.7———–31. Miami: 13.8
32. Pittsburgh: 11.1————-32. Bakersfield: 9.5———–32. Charlotte: 13.6
33. Jacksonville, FL: 10.7—–33. Oklahoma City: 9.3——33. Denver: 13.6
34. Long Beach, CA: 10.6—-34. Fort Wayne: 9.1———–34. Durham: 12.7
35. Fort Wayne, IN: 9.7——–35. Fresno: 9.1—————-35. Philadelphia: 12.5
36. Sacramento: 9.6———–36. Nashville: 9.1————–36. Fort Worth: 12.0
37. Omaha: 9.5——————37. Louisville: 8.7————-37. Atlanta: 11.8
38. Columbus: 9.4————–38. Santa Ana: 8.6———–38. Phoenix: 11.6
39. Greensboro, NC: 9.4——39. Fort Worth: 8.5———-39. Wichita: 11.3
40. Raleigh: 9.4——————40. Charlotte: 8.3———–40. Tucson: 11.2
41. Bakersfield, CA: 9.3——-41. Omaha: 8.3————–41. Bakersfield: 10.9
42. Wichita: 9.0——————42. Phoenix: 8.0————-42. Lubbock: 10.9
43. N. Las Vegas: 8.7———-43. Tampa: 8.0————–43. Corpus Christi: 10.7
44. New York: 8.4—————44. Toledo: 8.0————–44. Tampa: 10.7
45. Tulsa: 8.4———————45. Albuquerque: 7.7——45. Aurora: 10.1
46. Aurora, CO: 8.0————-46. Los Angeles: 7.7——46. Orlando: 10.1
47. San Francisco: 7.6———47. Orlando: 7.6————47. St. Paul: 9.6
48. Oklahoma City: 7.5———48. Aurora: 7.4————-48. Oklahoma City: 9.3
49. Albuquerque: 7.4————49. Greensboro: 7.4——49. San Antonio: 9.1
50. San Antonio: 7.4————50. Sacramento: 7.1——50. Los Angeles: 9.0
51. Jersey City: 7.1————-51. Long Beach: 6.9——-51. Lexington: 8.7
52. St. Paul: 7.0—————–52. N. Las Vegas: 6.9——52. Boston: 8.6
53. Riverside, CA: 6.7———53. New York: 6.6———–53. Pittsburgh: 8.6
54. Boston: 6.6——————54. Lexington: 6.1———–54. Portland: 8.1
55. Cincinnati: 6.6————–55. San Antonio: 6.0——–55. Sacramento: 8.0
56. Seattle: 6.4——————56. San Francisco: 6.0—–56. Long Beach: 7.7
57. Corpus Christi: 6.1——–57. St. Paul: 5.6————–57. Omaha: 7.6
58. Lubbock, TX: 6.0———-58. Honolulu: 5.6————-58. Colorado Springs: 7.5
59. Denver: 5.8—————–59. St. Petersburg: 5.3——59. Seattle: 7.1
60. Laredo, TX: 5.7————60. Corpus Christi: 5.2——60. N. Las Vegas: 6.9
61. Fresno, CA: 5.6————61. Austin: 4.8—————–61. Reno: 6.4
62. St. Petersburg: 5.6——–62. Colorado Springs: 4.8–62. Honolulu: 6.3
63. Honolulu: 5.4—————63. Denver: 4.7—————63. Riverside: 6.3
64. Irving, TX: 5.2————–64. Anchorage: 4.5———-64. Anchorage: 6.2
65. Santa Ana, CA: 5.0——-65. Arlington: 4.4————65. Arlington: 5.8
66. Austin: 4.9——————-66. Lubbock: 4.4————66. Jersey City: 5.8
67. Henderson, NV: 4.6——67. Wichita: 4.2————–67. St. Petersburg: 5.8
68. Reno: 4.6——————-68. Laredo: 3.8————–68. San Francisco: 5.5
69. San Diego: 4.4————69. Portland: 3.8————69. New York: 5.3
70. Arlington, TX: 4.2———70. Reno: 3.8—————-70. Santa Ana: 4.8
71. Colorado Springs: 4.2—71. Raleigh: 3.5————-71. Anaheim: 4.6
72. Lexington, KY: 4.2——-72. Mesa: 3.4—————-72. Austin: 4.6
73. Anchorage: 3.8———–73. Virginia Beach: 3.2—-73. Laredo: 4.6
74. Mesa, AZ: 3.8————-74. Henderson: 3.1——–74. Raleigh: 4.5
75. Toledo: 3.8—————-75. Seattle: 3.1————–75. El Paso: 4.1
76. Portland: 3.6————–76. Riverside: 3.0———-76. Henderson: 4.1
77. El Paso: 3.5—————77. Irving: 2.8—————77. San Diego: 4.0
78. Anaheim: 3.4————–78. Chandler: 2.5———-78. San Jose: 3.9
79. Virginia Beach: 2.6——79. Gilbert: 2.4————–79. Mesa: 3.8
80. Chandler, AZ: 2.3——–80. San Diego: 2.2———80. Madison: 3.7
81. Plano, TX: 2.3————-81. Anaheim: 2.1———–81. Virginia Beach: 3.7
82. San Jose: 2.1————–82. San Jose: 2.1———-82. Chula Vista: 3.6
83. Chula Vista, CA: 1.7—–83. Plano: 1.5—————-83. Irving: 3.5
84. Madison: 1.4—————84. Madison: 0.9————84. Chandler:3.3
85. Lincoln: 1.3—————–85. Chula Vista: 0.8——–85. Lincoln: 1.7
86. Irvine, CA: 0.7————-86. El Paso: 0.8————-86. Gilbert: 1.5
87. Gilbert, AZ: 0.0————-87. Lincoln: 0.8————-87. Plano: 1.1
88. Louisville: N/A————–88. Irvine: 0.0—————88. Irvine: 0.3
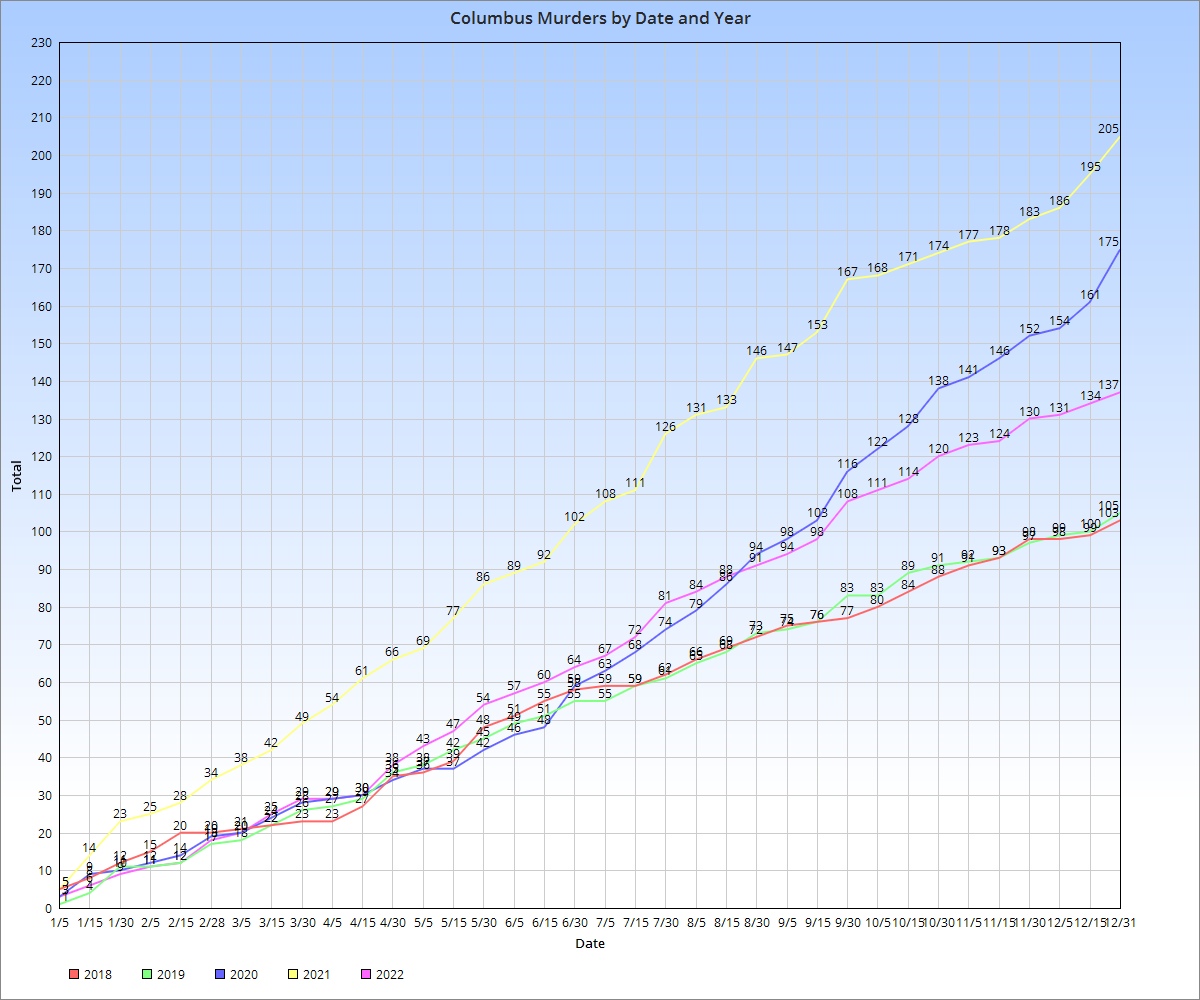
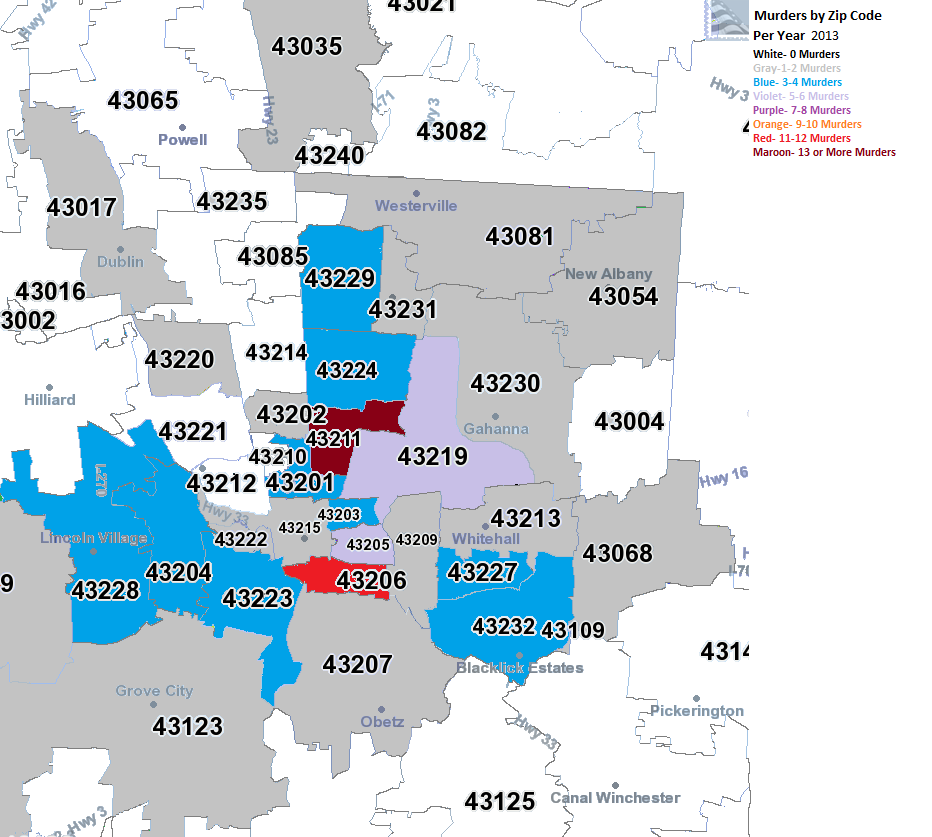
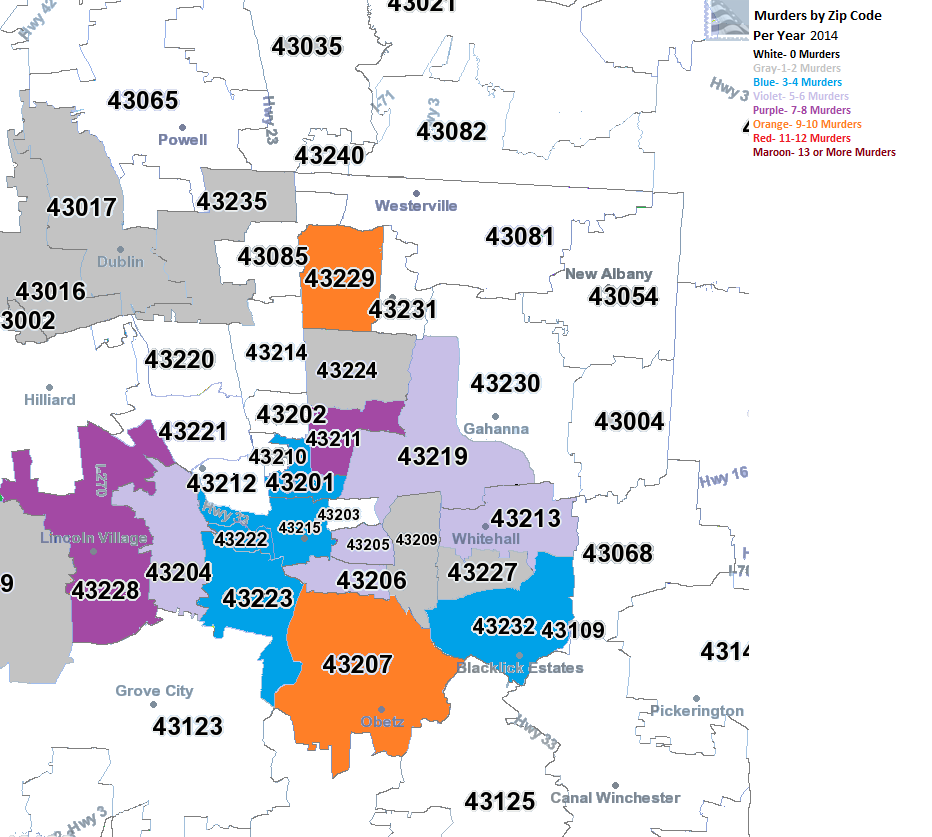
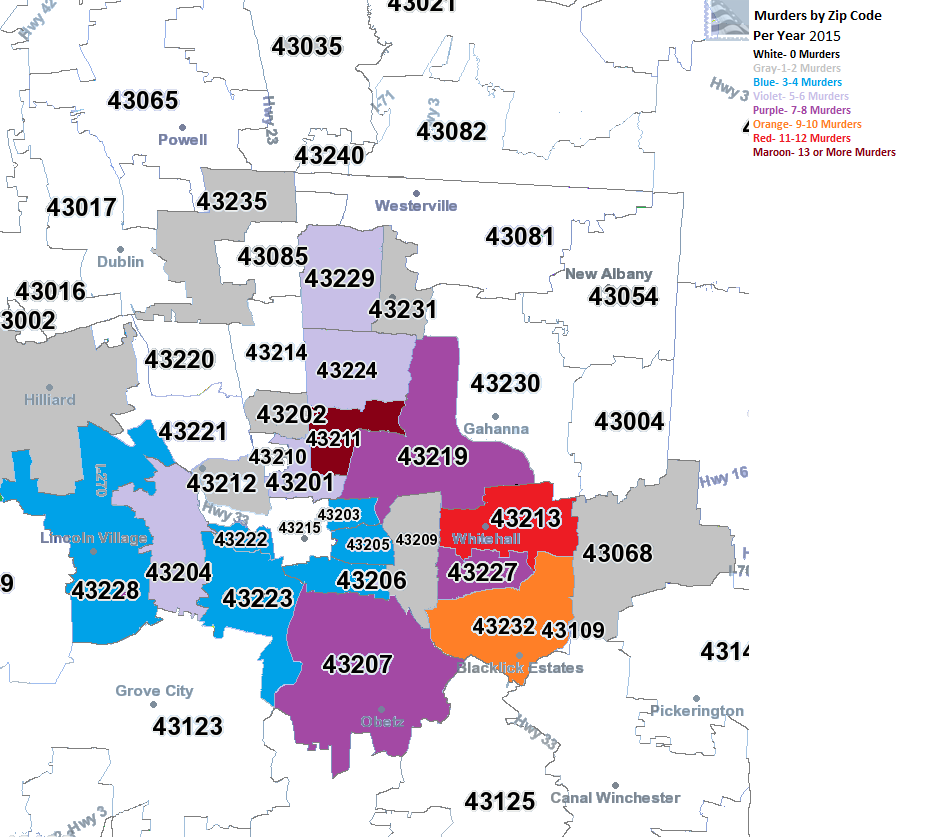
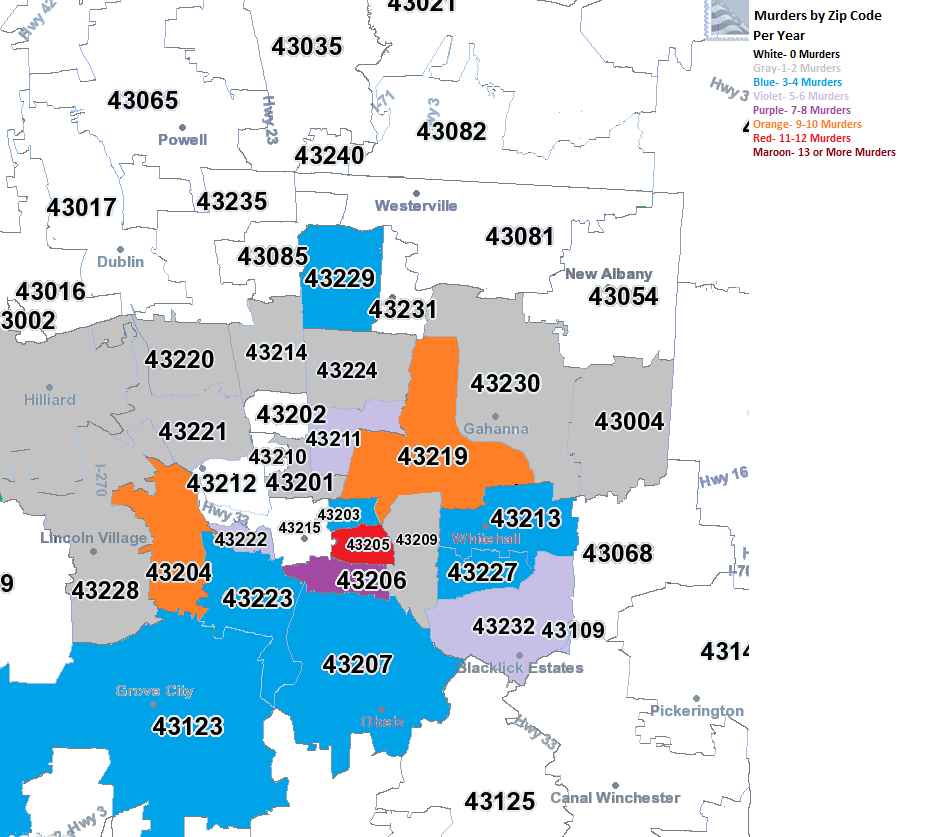
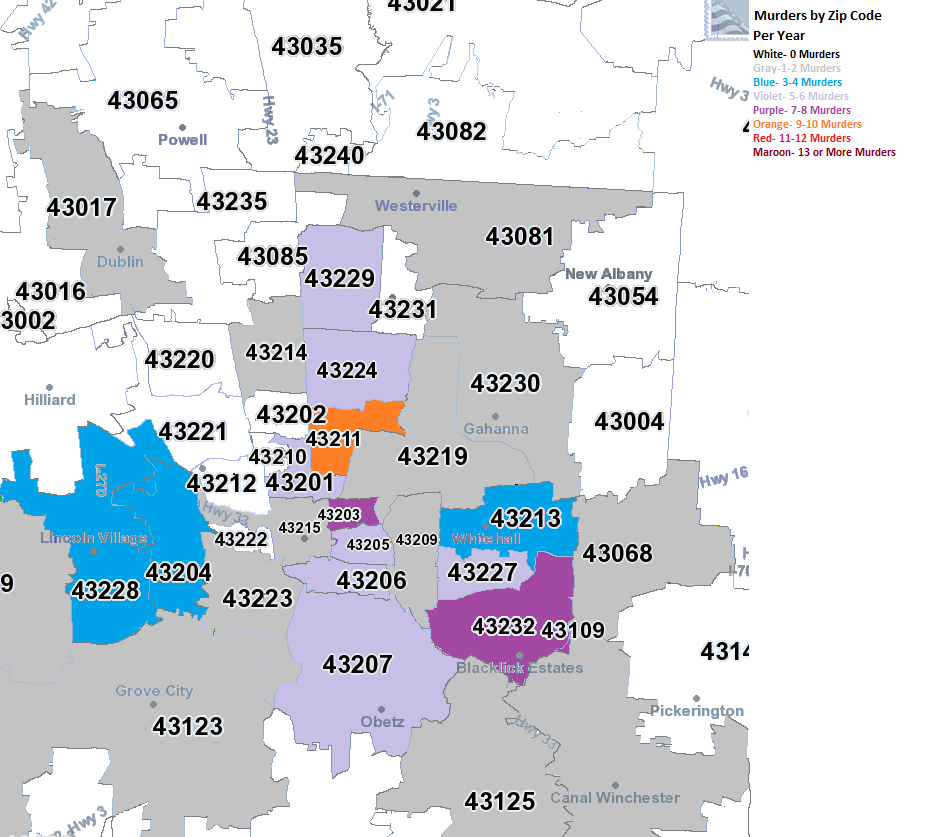
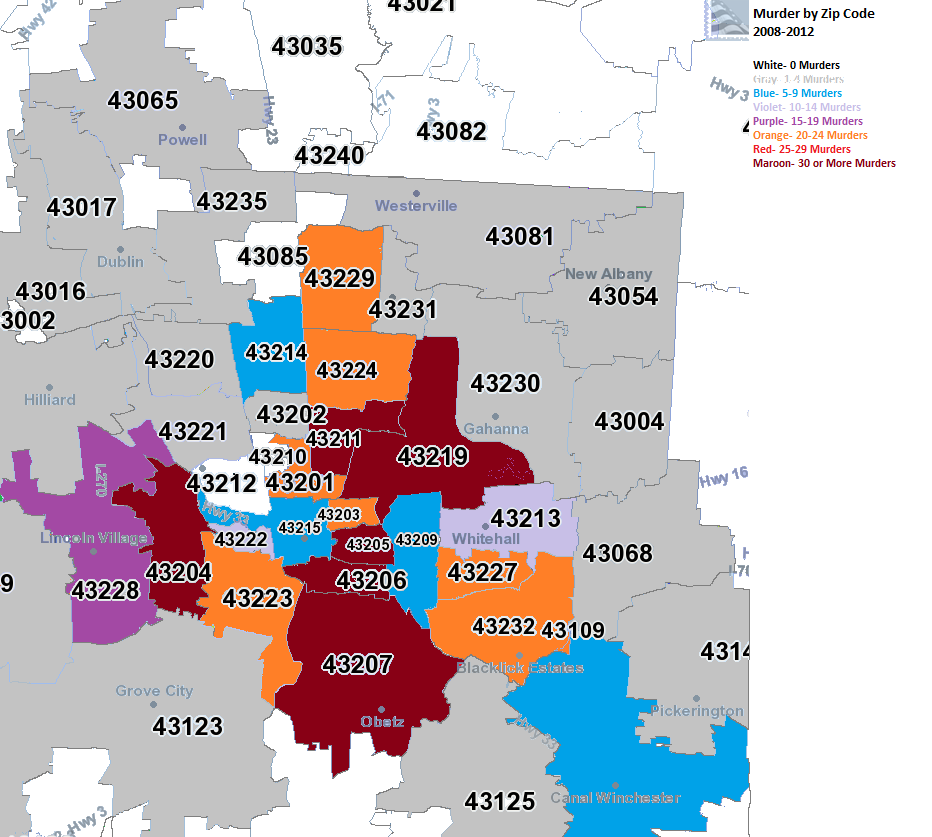
Most cities saw their numbers and rates increase by 2020, which is curious given that overall violent crimes decreased in many cities. In Columbus, homicides rose to near record levels in 2020, but overall violent crimes steadily dropped 2000-2020. Across the nation, the causes of this could be varied, but it seems the most common factor may be gun proliferation via the relaxation of regulations. For example, mass shooting incidents across the US have exploded since the mid-2000s, which coincides with the allowed expiration of the Federal Assault Weapons Ban, which existed from 1994 to September, 2004.
State Homicide Rate Per 100K People By Year
2000———————————2010—————————2020
1. Louisiana: 12.5————-1. Louisiana: 11.0————1. Louisiana: 15.8
2. Mississippi: 9.0————-2. Maryland: 7.4————–2. Missouri: 11.8
3. Maryland: 8.1—————3. Missouri: 7.0—————3. Arkansas: 10.6
4. Georgia: 8.0—————–4. Mississippi: 6.9————4. Mississippi: 10.6
5. Alabama: 7.4—————-5. New Mexico: 6.8———-5. South Carolina: 10.5
6. New Mexico: 7.4———–6. Arizona: 6.4—————–6. Alabama: 9.6
7. South Carolina: 7.3——-7. Michigan: 5.9—————7. Tennessee: 9.6
8. Illinois: 7.2——————-8. Nevada: 5.8—————-8. Illinois: 9.1
9. Tennessee: 7.2————-9. Alabama: 5.7————–9. Maryland: 9.1
10. Arizona: 7.0————–10. Delaware: 5.7————10. Georgia: 8.8
11. North Carolina: 7.0—–11. Georgia: 5.7—————11. North Carolina: 8.0
12. Michigan: 6.7————12. South Carolina: 5.7——12. Pennsylvania: 7.9
13. Nevada: 6.5————–13. Tennessee: 5.6———–13. New Mexico: 7.8
14. Arkansas: 6.3————14. Illinois: 5.5—————–14. Michigan: 7.6
15. Kansas: 6.3————–15. Florida: 5.2—————–15. Indiana: 7.5
16. Missouri: 6.2————-16. Oklahoma: 5.2————-16. Delaware: 7.4
17. California: 6.1————17. Pennsylvania: 5.1———17. Oklahoma: 7.4
18. Texas: 5.9—————–18. North Carolina: 5.0——-18. Kentucky: 7.2
19. Indiana: 5.8—————19. Texas: 4.9——————19. Ohio: 7.0
20. Virginia: 5.7—————20. California: 4.8————-20. Arizona: 6.9
21. Florida: 5.6—————-21. Virginia: 4.7—————-21. Alaska: 6.7
22. Oklahoma: 5.3————22. Arkansas: 4.6————-22. Texas: 6.6
23. New York: 5.0————-23. New York: 4.5————23. West Virginia: 6.6
24. Pennsylvania: 4.9——–24. Alaska: 4.3—————-24. Virginia: 6.1
25. Kentucky: 4.8————-25. Kentucky: 4.3————-25. Florida: 5.9
26. Alaska: 4.3—————-26. New Jersey: 4.2———-26. Nevada: 5.7
27. Rhode Island: 4.3——-27. Ohio: 4.2——————-27. California: 5.6
28. Nebraska: 3.7————28. Indiana: 4.1—————-28. Wisconsin: 5.3
29. Ohio: 3.7——————29. Connecticut: 3.7———-29. Colorado: 5.1
30. New Jersey: 3.4———30. Kansas: 3.4—————-30. Montana: 5.0
31. Washington: 3.3———31. Massachusetts: 3.3——31. South Dakota: 4.5
32. Delaware: 3.2————32. West Virginia: 3.1——–32. New York: 4.2
33. Wisconsin: 3.2———–33. Nebraska: 3.0————-33. North Dakota: 4.2
34. Colorado: 3.1————34. Rhode Island: 2.8———34. Connecticut: 3.9
35. Minnesota: 3.1———–35. South Dakota: 2.8——–35. Washington: 3.9
36. Connecticut: 2.9———36. Wisconsin: 2.7————-36. New Jersey: 3.7
37. Hawaii: 2.9—————37. Colorado: 2.6—————37. Nebraska: 3.6
38. West Virginia: 2.5——-38. Montana: 2.5—————38. Iowa: 3.5
39. Wyoming: 2.4————39. Oregon: 2.5—————–39. Kansas: 3.4
40. Montana: 2.2————-40. Washington: 2.3————40. Minnesota: 3.4
41. Massachusetts: 2.0—–41. Utah: 1.9———————41. Utah: 3.1
42. Oregon: 2.0—————42. Hawaii: 1.8——————42. Wyoming: 3.1
43. Utah: 1.9——————-43. Maine: 1.8——————-43. Rhode Island: 3.0
44. New Hampshire: 1.8—–44. Minnesota: 1.8————44. Hawaii: 2.9
45. Iowa: 1.6——————–45. North Dakota: 1.5——–45. Oregon: 2.9
46. Vermont: 1.5—————46. Idaho: 1.4——————-46. Massachusetts: 2.3
47. Idaho: 1.2——————-47. Wyoming: 1.4————-47. Idaho: 2.2
48. Maine: 1.2——————48. Iowa: 1.2——————–48. Vermont: 2.2
49. South Dakota: 0.9——–49. Vermont: 1.1—————49. Maine: 1.6
50. North Dakota: 0.6———50. New Hampshire: 1.0—-50. New Hampshire: 0.9
The Southeast states all appear in the top 25 worst, including 8 of the top 10. Most states saw declines 2000-2010, followed by increases 2010-2020.