
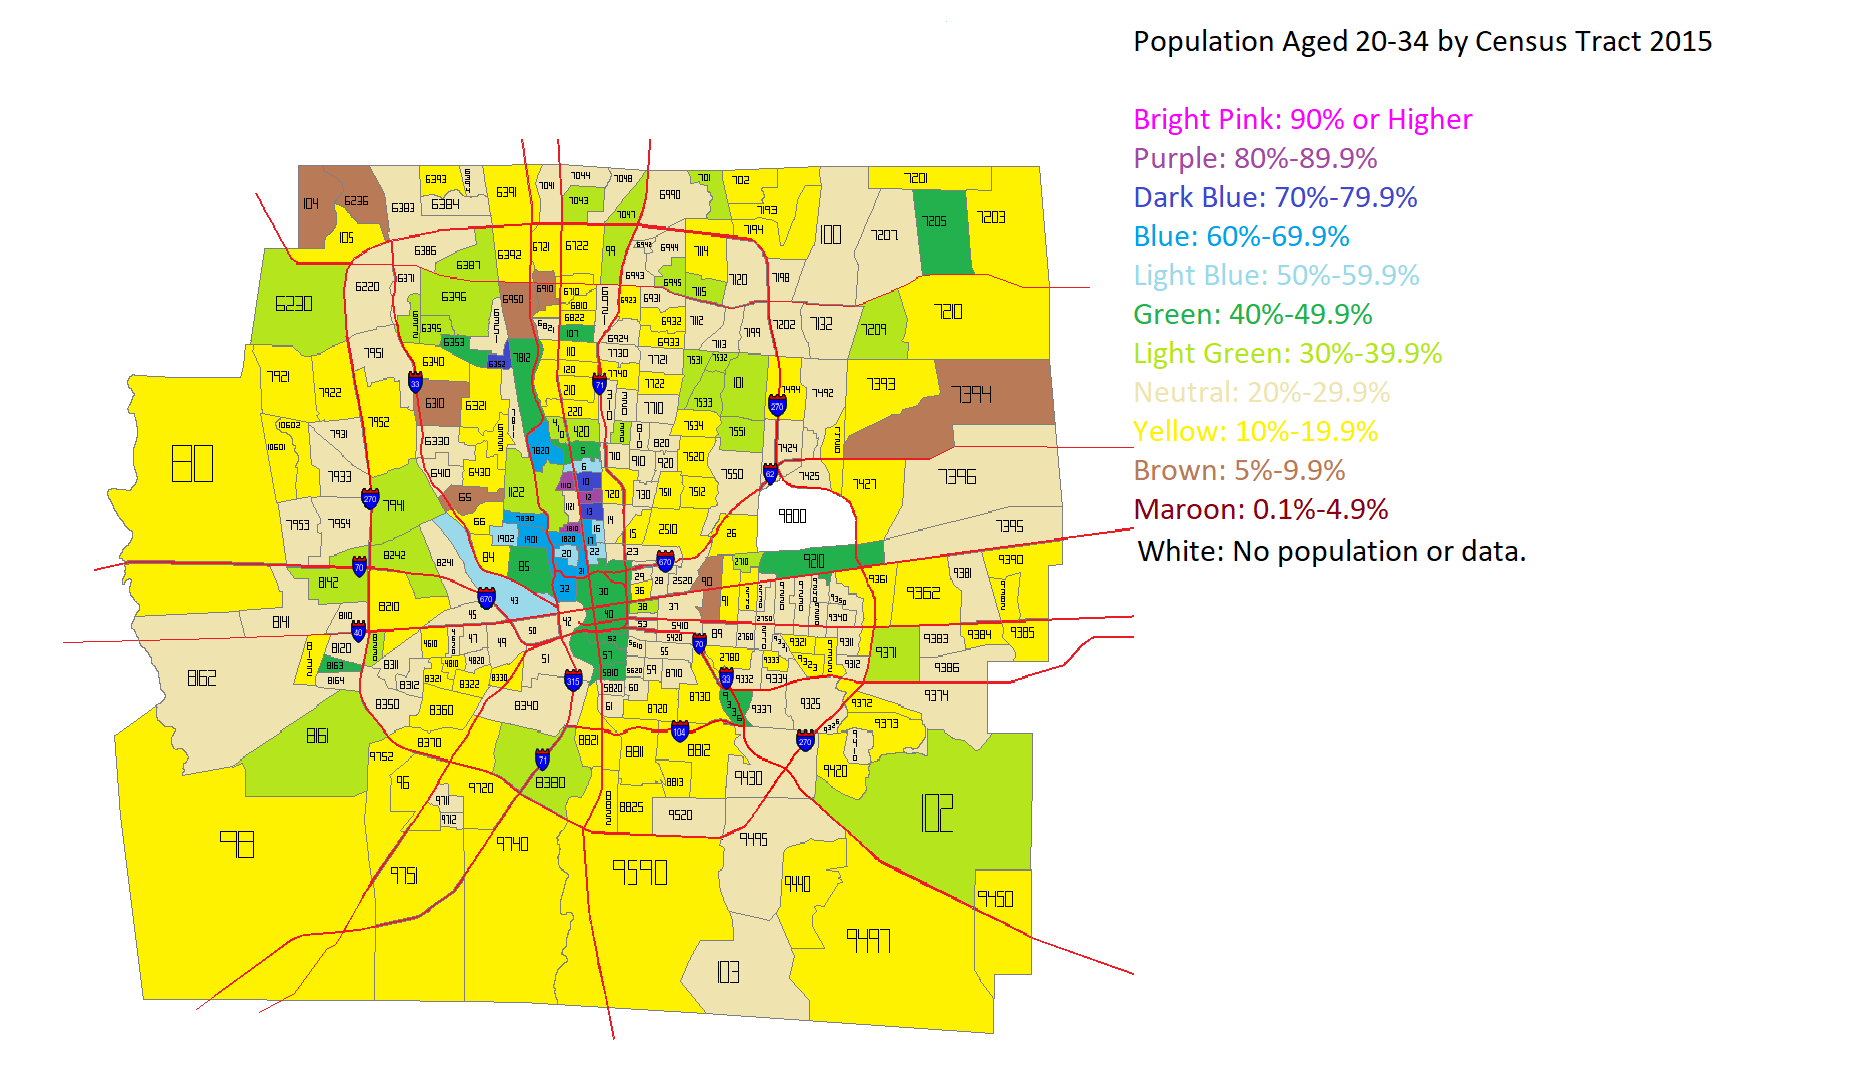
I’ve seen several articles across the internet lately questioning the idea that Millennials and young adults prefer density and urban areas. I decided to see how this played out in Franklin County overall. I first looked at the total population aged 20-34 in the year 2000 and the year 2015 by Census Tract.
Here were the maps for those years.

After looking at the numbers for both years, I came up with this map for how that age group had changed in the 2000-2015 period.
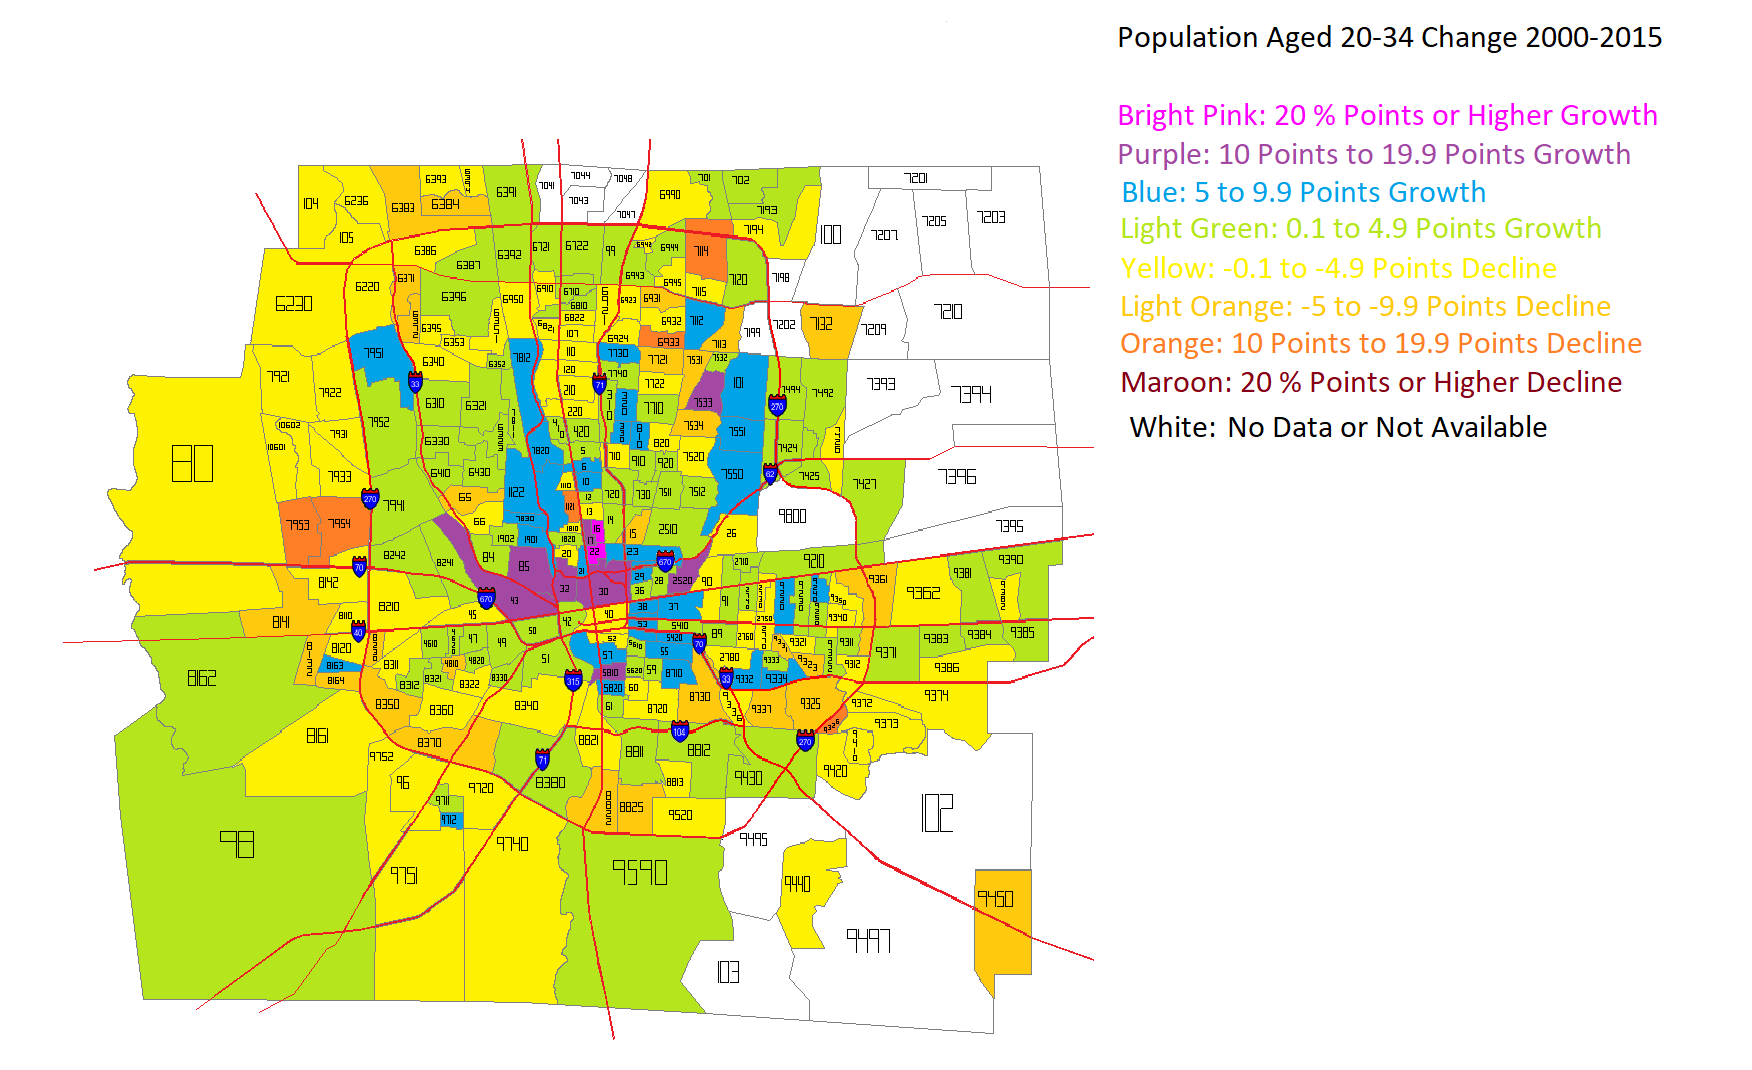
Unfortunately, some tracts, particularly in the eastern suburban areas, did not exist in 2000, and so I was not able to figure out the change for them during the period. The rest of the map, however, shows that the strongest growth in this age group was not only inside 270, but closest to Downtown and central corridors along Broad and High Streets.
These maps don’t tell us about the relationship between those changes and the population density of the census tracts. So I went further and broke the tracts into increments of density to see where the strongest growth was occurring.
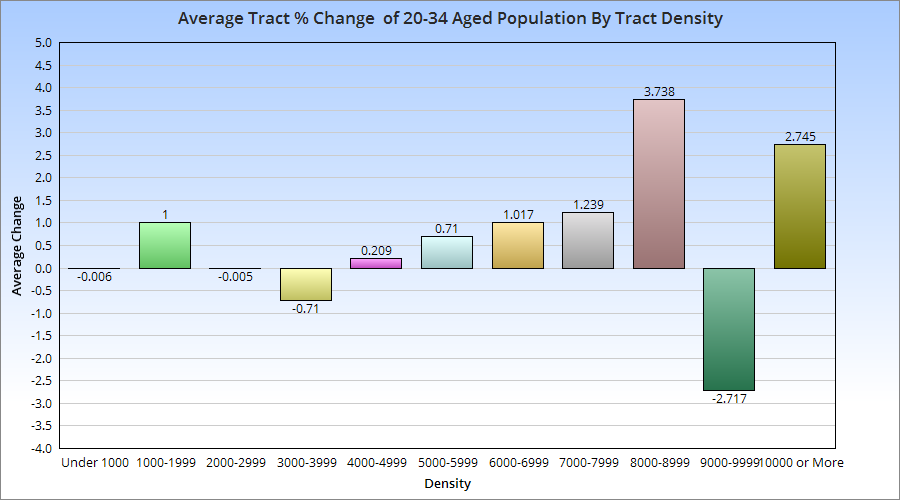
With a few exceptions, there appears to be a correlation between average 20-34 aged population growth and the density of the census tracts it occurs in. This suggests that this age group, at least in Franklin County, prefers areas with moderate to high density, which typically translates to urban living.