Although Ohio is technically still counting some votes, there shouldn’t be any significant movement in the overall numbers, so we can now take a look at how the local area voted down to the precinct level. In this post, though, the focus is on 2020 election results for Columbus metro counties, as well as past elections going back to 2000.
First, here are the voting total breakdowns by every metro county since 2000.
Delaware County Total Votes By Election 2020: 126,374 2016: 105,639 2012: 98,899 2008: 92,581 2004: 80,456 2000: 55,403 Fairfield County 2020: 81,598 2016: 73,554 2012: 72,220 2008: 72,147 2004: 67,882 2000: 54,094 Franklin County 2020: 632,532 2016: 587,524 2012: 572,188 2008: 561,763 2004: 525,827 2000: 414,074 Hocking County 2020: 13,860 2016: 12,929 2012: 12,768 2008: 13,016 2004: 13,199 2000: 10,756 Licking County 2020: 94,396 2016: 83,624 2012: 81,550 2008: 82,570 2004: 79,420 2000: 62,466 Madison County 2020: 19,887 2016: 17,421 2012: 17,557 2008: 17,510 2004: 17,398 2000: 14,667 Morrow County 2020: 18,468 2016: 16,688 2012: 16,217 2008: 16,679 2004: 16,328 2000: 12,839 Perry County 2020: 16,676 2016: 15,101 2012: 15,020 2008: 15,437 2004: 15,189 2000: 12,828 Pickaway County 2020: 28,326 2016: 24,912 2012: 24,154 2008: 23,787 2004: 22,852 2000: 17,740 Union County 2020: 33,535 2016: 27,695 2012: 25,623 2008: 24,984 2004: 22,631 2000: 17,024
Total Metro Area 2020: 1,065,652 2016: 965,087 2012: 936,196 2008: 920,474 2004: 861,182 2000: 671,891
All of Columbus’ metro counties saw at or near record turnout levels, but also just high general vote totals. The metro added almost 400,000 total voters since 2000, partly explained by the area’s population growth.
Now let’s look at a breakdown of partisanship by total votes. With the margins, positive numbers are Republican, negative numbers are Democratic, again since 2000.
Only 3 metro counties- Delaware, Fairfield and Franklin- moved further blue since 2016. Franklin and Delaware moved strongly left, Fairfield only slightly. Delaware and Franklin also moved more blue from 2012 to 2016. Union stayed very similar to 2016. Delaware and Franklin are the 2 most urbanized counties in the metro, so it makes sense they moved bluer. The most rural counties tended to have the strongest movement to the right.
2020 was the first election in which either party surpassed half a million votes.
Metro Area Margin Between Democratic and Republican Votes (Negative is Democrat, Positive is Republican) 2020: -87,648 2016: -45,097 2012: -65,040 2008: -52,119 2004: +40,202 2000: +63,063
2020 provided the largest margin for either party since 2000, and the metro has generally become more blue over time.
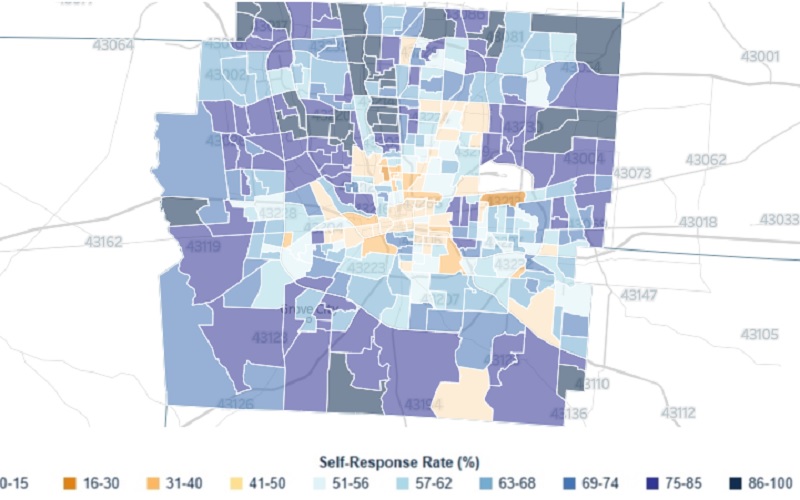
The 2020 US Census is currently winding down, perhaps somewhat earlier than planned, but wrapping up nonetheless. The accuracy of the Census relies heavily on enough people responding to the surveys. Because of the pandemic this year, the internet has played a bigger role in the response rates than normal, but there were still plenty of door to door workers doing surveys. How did Columbus, Central Ohio and other parts of the state do? Here are the Ohio census 2020 response rates.
First, let’s look at Ohio counties. These numbers are through September 2nd.
Top 10 counties for Census Response 1. Medina County: 81.9% 2. Delaware County: 79.7% 3. Geauga County, Warren County: 78.7% 4. Union County: 78.0% 5. Lake County: 77.4% 6. Auglaize County: 76.9% 7. Wayne County: 76.8% 8. Greene County: 76.0% 9. Miami County: 75.9% 10. Fulton County: 75.2%
Bottom 10 Counties for Census Response 1. Harrison County: 55.5% 2. Morgan County: 57.7% 3. Vinton County: 57.9% 4. Pike County: 58.5% 5. Monroe County: 58.8% 6. Lawrence County: 59.3% 7. Scioto County: 59.4% 8. Meigs County: 59.6% 9. Adams County: 59.9% 10. Ashtabula County, Athens County: 60.8%
Most of the high-reporting counties were large metro counties, while most of the low ones were Appalachia. This may be related to access to the internet, which again, played a crucial role this year.
Here are the counties that anchor Ohio’s largest metros Lucas County: 64.6% Cuyahoga County: 65.5% Franklin County: 66.7% Hamilton County: 66.7% Mahoning County: 67.4% Montgomery County: 68.0% Stark County: 74.3%
Columbus’ Franklin County was tied for 3rd worst.
Now let’s look at Central Ohio cities and towns. Minerva Park: 88.6% Worthington: 86.8% Upper Arlington: 85.7% Westerville: 83.2% Dublin: 82.7% Canal Winchester: 81.8% Grandview Heights: 81.8% Gahanna: 81.1% New Albany: 81.1% Bexley: 79.5% Grove City: 78.9% Groveport: 78.9% Pataskala: 77.4% Hilliard: 77.0% Valleyview: 76.5% Reynoldsburg: 75.3% Obetz: 72.7% Pickerington: 71.6% Columbus: 62.1% Whitehall: 58.5%
Generally, the more urban commmunities tended to do worse than the outer suburbs. This has implications on urban areas possibly being undercounted, though the response rates are generally similar to what they were in 2010, so that concern is probably overblown to some extent.
If your’e interested in taking a further look at Ohio’s and other states numbers, visit the following link, in which response rates are tracked all the way down to the Census Tract level: https://2020census.gov/en/response-rates/self-response.html
The Census has released 2019 metro population estimates. This comparison uses those figures to rank the Columbus metro with other metros under the following categories: Ohio metros with at least 250,000 people. Midwest metros with at least 500,000 people. National metros with 1.5-2.599 million people.
Total Metro Area Population Census 2010, July 1, 2018 and July 1, 2019 Census 2010——————————-July 1, 2018————————July 1, 2019 1. Chicago, IL: 9,461,105————-1. Chicago: 9,484,158———–1. Chicago: 9,458,539 2. Detroit, MI: 4,296,250—————2. Detroit: 4,322,084————-2. Detroit: 4,319,629 3. Minneapolis, MN: 3,348,8459—-3. Minneapolis: 3,610,061–3. Minneapolis: 3,640,043 4. St. Louis, MO: 2,787,701———-4. St. Louis: 2,803,958———4. St. Louis: 2,803,228 5. Pittsburgh, PA: 2,356,285——5. San Antonio: 2,512,379—5. San Antonio: 2,550,960 6. San Juan, PR: 2,350,126———-6. Portland: 2,473,350———6. Portland: 2,492,412 7. Portland, OR: 2,226,009——-7. Sacramento: 2,341,940—–7. Sacramento: 2,363,730 8. Sacramento, CA: 2,149,127—–8. Pittsburgh: 2,322,653——–8. Pittsburgh: 2,317,600 9. San Antonio, TX: 2,142,516—–9. Las Vegas: 2,226,115——-9. Las Vegas: 2,266,715 10. Cincinnati: 2,114,580———–10. Cincinnati: 2,211,936——-10. Austin: 2,227,083 11. Cleveland: 2,077,240———–11. Austin: 2,165,497———–11. Cincinnati: 2,221,208 12. Kansas City, MO: 2,009,342-12. Kansas City: 2,144,427–12. Kanas City: 2,157,990 13. Las Vegas, NV: 1,951,269—–13. Columbus: 2,104,194—–13. Columbus: 2,122,271 14. Columbus: 1,901,974——-14. Cleveland: 2,053,795—–14. Indianapolis: 2,074,537 15. Indianapolis, IN: 1,887,877—15. Indianapolis: 2,052,368—15. Cleveland: 2,048,449 16. San Jose, CA: 1,836,911—16. San Juan: 2,022,139———16. San Juan: 2,023,227 17. Austin, TX: 1,716,289————17. San Jose: 1,993,804—–17. San Jose: 1,990,660 18. Virginia Beach, VA: 1,676,822—18. Nashville: 1,904,726—18. Nashville: 1,934,317 19. Nashville: 1,670,890—19. Virginia Beach: 1,763,713–19. Virginia Beach: 1,768,901 20. Providence, RI: 1,600,852—-20. Providence: 1,622,379—20. Providence: 1,624,578 21. Milwaukee, WI: 1,555,908—–21. Milwaukee: 1,573,995—21. Milwaukee: 1,575,179 22. Jacksonville, FL: 1,345,596-22. Jacksonville: 1,532,663–22. Jacksonville: 1,559,514 23. Grand Rapids: 988,938–23. Grand Rapids: 1,071,370-23. Grand Rapids: 1,077,370 24. Omaha, NE: 865,350————–24. Omaha: 940,970—-24. Omaha: 949,442 25. Dayton: 799,232——————–25. Dayton: 805,088—–25. Dayton: 807,611 26. Akron: 703,200———————26. Akron: 703,855——–26. Akron: 703,479 27. Wichita, KS: 630,919————27. Des Moines: 690,915—27. Des Moines: 699,292 28. Toledo: 610,001——————28.Madison: 659,927——–28. Madison: 664,865 29. Madison, WI: 605,435———–29. Toledo: 643,089——–29. Toledo: 641,816 30. Des Moines, IA: 569,633——-30. Wichita: 637,519——30. Wichita: 640,218 31. Youngstown: 565,773———–31. Lansing: 548,674—–31. Lansing: 550,391 32. Lansing, MI: 534,684————32. Youngstown: 538,226—32. Youngstown: 536,081 33. Canton: 404,422——————33. Canton: 401,165—-33. Canton: 399,927
Charlotte and Orlando metros, previous national peers, have grown past the population standard limit of 2.599 million and are no longer used. Lansing and San Juan have been added.
Metro Area Total Growth Census 2010-July 1, 2019 and July 1, 2018-July 1, 2019 Census 2010-July 1, 2019—————————–July 1, 2018-July 1, 2019 1. Austin: +510,794————————————–1. Austin: +61,586 2. San Antonio: +408,452——————————2. Las Vegas: +40,600 3. Las Vegas: +315,446——————————–3. San Antonio: +38,581 4. Minneapolis: +306,410——————————4. Minneapolis: +29,982 5. Nashville: +288,117———————————-5. Nashville: +29,591 6. Portland: +266,403———————————–6. Jacksonville: +26,851 7. Columbus: +220,297——————————–7. Indianapolis: +22,169 8. Sacramento: +214,603——————————8. Sacramento: +21,790 9. Jacksonville: +213,918——————————9. Portland: +19,062 10. Indianapolis: +186,660—————————-10. Columbus: +18,077 11. San Jose: +153,749——————————–11. Kansas City: +13,563 12. Kansas City: +148,648—————————–12. Cincinnati: +9,272 13. Des Moines: +92,817——————————-13. Omaha: +8,472 14. Omaha: +84,092————————————-14. Des Moines: +8,377 15. Grand Rapids: +83,700—————————–15. Grand Rapids: +6,000 16. Cincinnati: +83,541———————————-16. Virginia Beach: +5,188 17. Madison: +59,430————————————17. Madison: +4,938 18. Virginia Beach: +54,947—————————-18. Wichita: +2,699 19. Providence: +23,726——————————–19. Dayton: +2,523 20. Detroit: +23,379—————————————20. Providence: +2,199 21. Milwaukee: +19,271———————————21. Lansing: +1,717 22. Wichita: +17,157————————————-22. Milwaukee: +1,184 23. Lansing: +15,707————————————23. San Juan: +1,088 24. St. Louis: +15,527———————————–24. Akron: -376 25. Dayton: +8,379—————————————25. St. Louis: -730 26. Akron: +279——————————————-26. Canton: -810 27. Chicago: -2,566————————————–27. Toledo: -1,273 28. Canton: -6,902—————————————28. Youngstown: -2,45 29. Toledo: -9,613—————————————-29. Detroit: -2,455 30. Cleveland: -28,791———————————-30. San Jose: -3,144 31. Youngstown: -29,692——————————-31. Pittsburgh: -5,053 32. Pittsburgh: -36,685———————————32. Cleveland: -5,346 33. San Juan: -326,899——————————–33. Chicago: -25,619
Now let’s look at the components of population change for metro areas.
Total Births By Metro Census 2010-July 1, 2019 and July 1, 2018-July 1, 2019 Census 2010-July 1, 2019———————–July 1, 2018-July 1, 2019 1. Chicago: 1,085,985——————————-1. Chicago: 108,425 2. Detroit: 462,696————————————2. Detroit: 48,879 3. Minneapolis: 419,634—————————–3. Minneapolis: 44,602 4. St. Louis: 310,273———————————4. San Antonio: 32,592 5. San Antonio: 300,032—————————-5. St. Louis: 31,686 6. Kansas City: 253,384—————————-6. Columbus: 27,096 7. Cincinnati: 253,180——————————-7. Las Vegas: 27,048 8. Portland: 253,110———————————8. Cincinnati: 26,892 9. Sacramento: 252,144—————————9. Sacramento: 26,752 10. Columbus: 251,291—————————10. Kanas City: 26,497 11. Las Vegas: 247,787—————————11. Indianapolis: 26,300 12. Indianapolis: 246,099————————-12. Portland: 26,204 13. Austin: 239,673———————————13. Austin: 26,115 14. San Jose: 220,891—————————–14. Nashville: 24,308 15. Pittsburgh: 218,159—————————-15. Pittsburgh: 22,570 16. Nashville: 216,969—————————–16. San Jose: 22,487 17. Cleveland: 212,523—————————-17. Cleveland: 22,003 18. Virginia Beach: 209,617———————-18. Virginia Beach: 21,589 19. Milwaukee: 182,815—————————19. Milwaukee: 18,927 20. Jacksonville: 167,526————————-20. Jacksonville: 18,592 21. Providence: 152,794————————–21. Providence: 16,182 22. Grand Rapids: 125,556———————-22. Grand Rapids: 13,339 23. Omaha: 122,306——————————23. Omaha: 12,848 24. Dayton: 88,783——————————–24. Dayton: 9,391 25. Des Moines: 85,530————————–25. Des Moines: 9,311 26. Wichita: 81,503——————————–26. Wichita: 8,057 27. Toledo: 71,848———————————27. Toledo: 7,428 28. Akron: 69,159———————————-28. Akron: 7,196 29. Madison: 67,559——————————29. Madison: 6,988 30. Lansing: 54,679——————————-30. Lansing: 5,702 31. Youngstown: 51,745————————-31. Youngstown: 5,450 32. Canton: 40,730——————————–32. Canton: 4,254
Components of change stats are not available for San Juan.
Total Deaths By Metro Census 2010-July 1, 2019 and July 1, 2018-July 1, 2019 Census 2010-July 1, 2019———————————July 1, 2018-July 1, 2019 1. Chicago: -647,739——————————————-1. Chicago: -74,501 2. Detroit: -377,943———————————————2. Detroit: -42,151 3. Pittsburgh: -253,686—————————————-3. St. Louis: -27,669 4. St. Louis: -241,884——————————————4. Pittsburgh: -27,387 5. Minneapolis: -210,510————————————-5. Minneapolis: -24,290 6. Cleveland: -198,044—————————————-6. Cleveland: -21,464 7. Cincinnati: -179,563—————————————-7. Cincinnati: -20,279 8. Sacramento: -157,234————————————-8. Sacramento: -18,933 9. Portland: -156,592——————————————9. San Antonio: -18,551 10. Kansas City: -155,166———————————–10. Portland: -18,458 11. San Antonio: -153,339———————————–11. Las Vegas: -17,919 12. Indianapolis: -148,608———————————–12. Kansas City: -17,692 13. Columbus: -142,665————————————–13. Columbus: -16,704 14. Las Vegas: -142,415————————————-14. Indianapolis: -16,678 15. Providence: -139,006————————————15. Virginia Beach: -15,280 16. Virginia Beach: -131,065——————————–16. Providence: -15,189 17. Nashville: -128,228—————————————17. Nashville: -15,122 18. Milwaukee: -123,806————————————-18. Jacksonville: -14,089 19. Jacksonville: -114,660———————————–19. Milwaukee: -13,810 20. San Jose: -94,587—————————————-20. San Jose: -11,582 21. Austin: -89,867——————————————–21. Austin: -11,445 22. Dayton: -77,893——————————————-22. Dayton: -8,506 23. Grand Rapids: -69,869———————————-23. Grand Rapids: -7,947 24. Akron: -65,852——————————————–24. Akron: -7,196 25. Youngstown: -64,558————————————25. Omaha: -6,931 26. Omaha: -62,030——————————————26. Youngstown: -6,842 27. Toledo: -59,436——————————————-27. Toledo: -6,624 28. Wichita: -51,734——————————————28. Wichita: 5,732 29. Des Moines: -44,857————————————29. Des Moines: 5,175 30. Canton: -41,233——————————————30. Lansing: -4,577 31. Lansing: -40,586—————————————–31. Madison: -4,453 32. Madison: -39,499—————————————-32. Canton: -4,395
Total Net Natural Change (Births vs. Deaths) By Metro Census 2010-July 1, 2019 and July 1, 2018-July 1, 2019 Census 2010-July 1, 2019———————————July 1, 2018-July 1, 2019 1. Chicago: 438,246———————————————1. Chicago: 33,924 2. Minneapolis: 209,124—————————————-2. Minneapolis: 20,312 3. Austin: 149,806———————————————–3. Austin: 14,670 4. San Antonio: 146,693—————————————4. San Antonio: 14,041 5. San Jose: 126,304——————————————-5. San Jose: 10,905 6. Columbus: 108,626——————————————6. Columbus: 10,392 7. Las Vegas: 105,372—————————————–7. Indianapolis: 9,622 8. Kansas City: 98,218—————————————–8. Nashville: 9,186 9. Indianapolis: 97,491—————————————–9. Las Vegas: 9,129 10. Portland: 96,518——————————————-10. Kansas City: 8,805 11. Sacramento: 94,910————————————–11. Sacramento: 7,819 12. Nashville: 88,741——————————————12. Portland: 7,746 13. Detroit: 84,753———————————————-13. Detroit: 6,728 14. Virginia Beach: 78,552———————————–14. Cincinnati: 6,613 15. Cincinnati: 73,617—————————————–15. Virginia Beach: 6,309 16. St. Louis: 68,389——————————————-16. Omaha: 5,917 17. Omaha: 60,276———————————————17. Grand Rapids: 5,392 18. Milwaukee: 59,009—————————————–18. Milwaukee: 5,117 19. Grand Rapids: 55,687————————————19. Jacksonville: 4,503 20. Jacksonville: 52,866————————————–20. Des Moines: 4,136 21. Des Moines: 40,673————————————–21. St. Louis: 4,017 22. Wichita: 29,769——————————————–22. Madison: 2,535 23. Madison: 28,060——————————————23. Wichita: 2,325 24. Cleveland: 14,479—————————————-24. Lansing: 1,125 25. Lansing: 14,093——————————————25. Providence: 993 26. Providence: 13,788————————————–26. Dayton: 885 27. Toledo: 12,412——————————————–27. Toledo: 804 28. Dayton: 10,890——————————————-28. Cleveland: 539 29. Akron: 3,307———————————————-29. Akron: 0 30. Canton: -503———————————————-30. Canton: -141 31. Youngstown: -12,813———————————–31. Youngstown: -1,392 32. Pittsburgh: -35,527————————————–32. Pittsburgh: -4,817
Total Domestic Migration By Metro Census 2010-July 1, 2019 and July 1, 2018-July 1, 2019 Census 2010-July 1, 2019———————————July 1, 2018-July 1, 2019 1. Austin: 293,162———————————————–1. Austin: 41,334 2. San Antonio; 214,509—————————————2. Las Vegas: 31,643 3. Las Vegas: 185,570—————————————–3. San Antonio: 21,987 4. Nashville: 158,336——————————————-4. Jacksonville: 20,051 5. Jacksonville: 126,483—————————————5. Nashville: 15,482 6. Portland: 121,473——————————————–6. Sacramento: 9,941 7. Sacramento: 69,723—————————————-7. Portland: 8,374 8. Columbus: 53,301——————————————-8. Indianapolis: 6,196 9. Indianapolis: 46,076—————————————-9. Columbus: 3,746 10. Des Moines: 40,183————————————–10. Des Moines: 3,718 11. Kansas City: 24,457————————————–11. Minneapolis: 3,202 12. Madison: 15,880——————————————12. Kansas City: 2,437 13. Minneapolis: 11,638————————————–13. Madison: 1,418 14. Grand Rapids: 10,903———————————–14. Cincinnati: 1,193 15. Omaha: 7,537———————————————-15. Omaha: 1,068 16. Canton: -7,124———————————————16. Dayton: 896 17. Dayton: -15,586——————————————–17. Wichita: -291 18. Akron: -15,683———————————————-18. Grand Rapids: -669 19. Lansing: -18,240——————————————-19. Canton: -677 20. Youngstown: -19,317————————————-20. Youngstown: -751 21. Cincinnati: -19,944—————————————-21. Lansing: -840 22. Wichita: -21,454——————————————-22. Akron: -1,190 23. Toledo: -27,740——————————————–23. Virginia Beach: -2,197 24. Pittsburgh: -31,804—————————————24. Toledo: -2,339 25. Providence: -38,503————————————-25. Pittsburgh: -2,658 26. Virginia Beach: -59,729———————————26. Providence: -3,185 27. Milwaukee: -64,395————————————–27. Milwaukee: -5,140 28. Cleveland: -78,763————————————–28. Cleveland: -7,250 29. St. Louis: -85,003—————————————-29. St. Louis: -7,685 30. San Jose: -124,105————————————-30. Detroit: -16,655 31. Detroit: -172,225—————————————–31. San Jose: -27,495 32. Chicago: -638,599—————————————32. Chicago: -74,950
Total International Migration By Metro Census 2010-July 1, 2019 and July 1, 2018-July 1, 2019 Census 2010-July 1, 2019———————————July 1, 2018-July 1, 2019 1. Chicago: 197,093——————————————-1. Chicago: 15,257 2. San Jose: 152,520—————————————–2. San Jose: 13,371 3. Detroit: 110,907———————————————3. Detroit: 7,516 4. Minneapolis: 87,847—————————————4. Minneapolis: 6,645 5. Austin: 62,740———————————————–5. Indianapolis: 6,394 6. Columbus: 58,853——————————————6. Austin: 5,280 7. Sacramento: 51,225—————————————7. Nashville: 4,937 8. Providence: 49,015—————————————-8. Providence: 4,455 9. Portland: 47,983——————————————–9. Sacramento: 4,053 10. San Antonio: 45,348————————————10. Columbus: 4,032 11. Indianapolis: 43,502————————————-11. St. Louis: 2,991 12. Nashville: 39,422—————————————–12. Portland: 2,960 13. Virginia Beach: 36,319———————————-13. Pittsburgh: 2,555 14. Cleveland: 36,318—————————————-14. San Antonio: 2,504 15. Jacksonville: 34,089————————————-15. Kansas City: 2,377 16. St. Louis: 32,872—————————————–16. Jacksonville: 2,251 17. Cincinnati: 31,157—————————————-17. Cincinnati: 1,547 18. Pittsburgh: 30,654—————————————-18. Omaha: 1,517 19. Kansas City: 27,259————————————-19. Lansing: 1,452 20. Milwaukee: 25,298—————————————20. Cleveland: 1,433 21. Las Vegas: 23,319—————————————21. Grand Rapids: 1,316 22. Lansing: 19,865——————————————22. Milwaukee: 1,277 23. Grand Rapids: 17,629———————————-23. Virginia Beach: 1,165 24. Omaha: 16,785——————————————24. Madison: 988 25. Madison: 15,600—————————————–25. Akron: 836 26. Dayton: 13,473——————————————26. Dayton: 785 27. Akron: 13,086——————————————–27. Wichta: 688 28. Des Moines: 11,716————————————28. Des Moines: 519 29. Wichita: 9,096——————————————-29. Toledo: 270 30. Toledo: 5,646——————————————–30. Canton: 25 31. Youngstown: 2,675————————————-31. Youngstown: 25 32. Canton: 1,073——————————————–32. Las Vegas: -360
Total Net Migration By Metro Census 2010-July 1, 2019 and July 1, 2018-July 1, 2019 Census 2010-July 1, 2019———————————July 1, 2018-July 1, 2019 1. Austin: 355,902———————————————1. Austin: 46,614 2. San Antonio: 259,857————————————-2. Las Vegas: 31,283 3. Las Vegas: 208,889—————————————3. San Antonio: 24,491 4. Nasvhille: 197,758—————————————–4. Jacksonville: 22,302 5. Portland: 169,456——————————————5. Nashville: 20,419 6. Jacksonville: 160,572————————————-6. Sacramento: 13,994 7. Sacramento: 120,948————————————-7. Indianapolis: 12,590 8. Columbus: 112,154—————————————-8. Portland: 11,334 9. Minneapolis: 99,458—————————————9. Minneapolis: 9,847 10. Indianapolis: 89,578————————————10. Columbus: 7,778 11. Des Moines: 51,899————————————-11. Kansas City: 4,814 12. Kansas City: 51,716————————————-12. Des Moines: 4,237 13. Madison: 31,480——————————————13. Cincinnati: 2,740 14. Grand Rapids: 28,352———————————–14. Omaha: 2,585 15. San Jose: 28,415—————————————-15. Madison: 2,406 16. Omaha: 24,322——————————————-16. Dayton: 1,681 17. Cincinnati: 11,213—————————————-17. Providence: 1,270 18. Providence: 10,512————————————–18. Grand Rapids: 647 19. Lansing: 1,625——————————————–19. Lansing: 612 20. Pittsburgh: -1,150—————————————-20. Wichita: 397 21. Dayton: -2,113——————————————–21. Pittsburgh: -103 22. Akron: -2,597———————————————-22. Akron: -354 23. Canton: -6,051——————————————–23. Canton: -652 24. Wichita: -12,358——————————————24. Youngstown: -726 25. Youngstown: -16,642————————————25. Virginia Beach: -1,032 26. Toledo: -22,094——————————————-26. Toledo: -2,069 27. Virginia Beach: -23,410——————————–27. Milwaukee: -3,863 28. Milwaukee: -39,097————————————-28. St. Louis: -4,694 29. Cleveland: -42,445————————————–29. Cleveland: -5,817 30. St. Louis: -52,131—————————————-30. Detroit: -9,139 31. Detroit: -61,318——————————————31. San Jose: -14,124 32. Chicago: -441,506————————————–32. Chicago: -59,693
The 2019 metro population estimates show Columbus largely holding its own against state, regional and national peers.
Now that we have the full set of 2017 population estimates, I wanted to examine a popular claim a little more closely. The claim is that suburban growth far exceeds that of core cities/counties, and it’s often repeated in media throughout the country. One of the things that always bothered me about this was the constant use of basing this claim largely on % change. This has a major flaw, one that I will go into more below.
For this little study on suburban vs urban growth, I will look at the top 50 largest metro areas.
First, let’s look at the total change in the whole metro area, the core county and the core city between the 2010 Census and July 1, 2017. They will be ranked here by total metro change. 1. Dallas, TX: +973,431 2. Houston, TX: +971,941 3. New York, NY: +754,396 4. Atlanta, GA: +597,993 5. Miami, FL: +592,525 6. Washington, DC: +580,228 7. Phoenix, AZ: +544,141 8. Los Angeles, CA: +524,946 9. Seattle, WA: +427,240 10. Austin, TX: +399,507 11. San Francisco, Ca: +391,784 12. Orlando, FL: +375,432 13. Riverside, CA: +355,705 14. Denver, CO: +344,635 15. San Antonio, TX: +331,458 16. Charlotte, NC: +308,313 17. Tampa, FL: +307,930 18. Boston, MA: +283,935 19. Las Vegas, NV: +252,810 20. Minneapolis, MN: +251,760 21. San Diego, CA: +242,343 22. Nashville, TN: +232,162 23. Portland, OR: +227,167 24. Raleigh, NC: +204,590 25. Columbus: +176,724 26. Sacramento, CA: +175,740 27. San Jose, CA: +161,523 28. Jacksonville, FL: +159,382 29. Indianapolis, IN: +140,524 30. Oklahoma City, OK: +130,746 31. Philadelphia, PA: +130,427 32. Kansas City, MO: +119,574 33. Salt Lake City, UT: +115,297 34. Baltimore, MD: +97,572 35. Richmond, VA: +86,117 36. New Orleans, LA: +85,903 37. Chicago: +71,499 38. Cincinnati: +64,396 39. Louisville, KY: +58,247 40. Virginia Beach, VA: +48,429 41. Memphis, TN: +23,433 42. Birmingham, AL: +21,751 43. Milwaukee, WI: +20,282 44. Providence, RI: +19,912 45. St. Louis, MO: +19,575 46. Detroit: +16,685 47. Buffalo, NY: +1,239 48. Hartford, CT: -2,139 49. Cleveland: -18,427 50. Pittsburgh, PA: -22,924
Now that we have the total growth, let’s break it down a bit more.
How much of the total metro change occurred in the core county of each metro? This will be ranked by the highest to lowest % occurring in the core county.
*New York includes all 5 main boroughs, so it is different than core county, but still represents the urban center of the metro area. **Core County and City are consolidated, or city exists as separate entity.
Going down even further, let’s compare the core city to the total metro, again ranked by %.
*Again, I used the 5 boroughs of New York here, so the numbers don’t change. **See above.
Finally, because core counties and cities can be absolutely huge, like in Phoenix, I wanted to take see the ratio of people moving vs. the area size. To do this, I divided the growth by the land area of each core county and city.
So basically, how many people moved there per each square mile.
So what’s all this mean? Columbus performs particularly well here. Franklin County attracts a high percentage of the total metro population, and Columbus itself is one of only 5 cities with more than 50% of the metro growth entering the city limits. Even accounting for area size, Columbus does fairly well. This suggests that urban growth there is stronger than in most cities.
Early this morning, the Census released the most recent population figures for counties, Metropolitan Statistical Areas and Consolidated Statistical Areas. The 2017 county population estimates, among others, cover the year from July 1, 2016 to July 1, 2017.