The popular monthly series continues with the local housing market update March 2021 report. Let’s drill down into the results.
Note: LSD= Local School District, CSD= City School District. In both cases, school district boundaries differ from city boundaries.
Top 15 Most Expensive Locations By Median Sales Price in March 2021
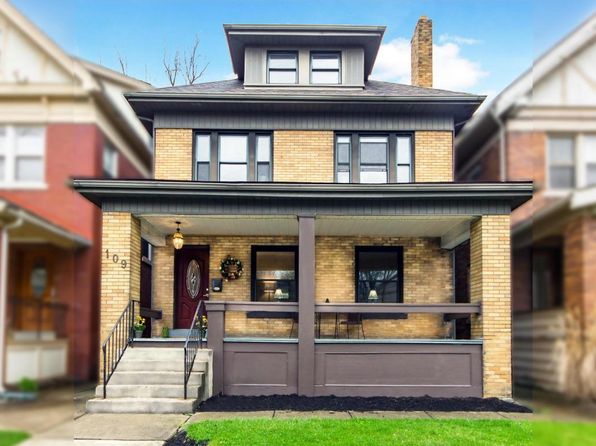
1. New Albany: $652,000
2. New Albany Plain LSD: $523,500
3. Powell: $519,000
4. Upper Arlington CSD: $476,600
5. German Village: $475,550
6. Grandview Heights: $474,000
7. Dublin: $462,000
8. Olentangy LSD: $443,685
9. Buckeye Valley LSD: $420,000
10. Dublin CSD: $419,000
11. Bexley: $413,000
12. Short North: $399,900
13. Granville LSD: $388,500
14. Big Walnut LSD: $384,900
15. Worthington: $358,000
New Albany continued to dominate the top of the market in terms of median sales price, and it wasn’t even close.
Top 15 Least Expensive Locations by Median Sales Price in March 2021
1. Whitehall: $140,100
2. Newark CSD: $146,000
3. Lancaster CSD: $160,500
4. Hamilton LSD: $166,000
5. Groveport Madison LSD: $185,000
6. Jefferson LSD: $185,000
7. Reynoldsburg CSD: $205,250
8. Columbus CSD: $209,718
9. Circleville CSD: $210,000
10. Columbus: $217,000
11. Obetz: $227,420
12. South-Western CSD: $230,000
13. Johnstown-Monroe LSD: $230,000
14. London CSD: $251,000
15. Teays Valley LSD: $253,092
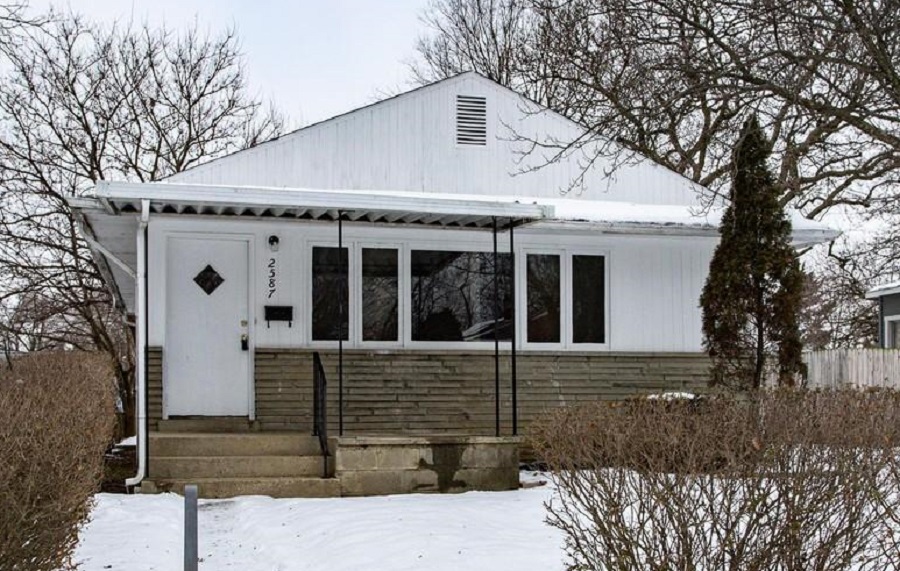
Whitehall remains the area’s biggest bargain. This inner suburb hasn’t always had the best reputation, but the city has been making efforts to improve both its commercial corridors and residential options. Columbus is relatively cheap compared to most of the metro, yet has by far the largest variety of options and neighborhood types to choose from.
Overall Market Median Sales Price in March 2021: $242,550
The overall market is defined by Columbus Metro Area counties.
Top 15 Locations with the Highest Median Sales Price % Growth Between March 2020 and March 2021
1. London CSD: +52.2%
2. Circleville CSD: +44.3%
3. New Albany Plain LSD: +32.5%
4. German Village: +29.4%
5. Obetz: +26.4%
6. Gahanna Jefferson CSD: +26.0%
7. Grandview Heights: +25.4%
8. Powell: +23.9%
9. Upper Arlington CSD: +23.8%
10. Lancaster CSD: +23.7%
11. Jonathan Alder LSD: +23.6%
12. Grove City: +22.0%
13. Gahanna: +21.9%
14. Teays Valley: +21.5%
15. Pickerington LSD: +20.8%
16. Pickerington: +20.8%
Top 15 Locations with the Lowest Median Sales Price % Growth Between March 2020 and March 2021
1. Johnstown Monroe LSD: -25.0%
2. Downtown Columbus: -14.5%
3. Granville LSD: -13.2%
4. Big Walnut LSD: -10.5%
5. Short North: -10.0%
6. Bexley: -6.1%
7. Minerva Park: -5.4%
8. Worthington: -5.0%
9. Hamilton LSD: -3.8%
10. Hilliard: +0.8%
11. New Albany: +1.7%
12. Newark CSD: +4.3%
13. Dublin CSD: +4.6%
14. Hilliard CSD: +5.5%
15. Dublin: +7.5%
Urban areas and some inner suburbs had either the biggest price declines or smallest increases in March vs. March 2020 as the fallout continued from Covid and protest-related activities. These declines may be seen by potential buyers as a positive from the high prices that otherwise continue, however.
Overall Market Median Sales Price % Change March 2021 vs. March 2020: +16.3%
Top 10 Locations with the Most New Listings in March 2021
1. Columbus: 1,156
2. Columbus CSD: 811
3. South-Western CSD: 187
4. Olentangy LSD: 161
5. Hilliard CSD: 138
6. Westerville CSD: 125
7. Dublin CSD: 125
8. Gahanna Jefferson CSD: 78
9. Dublin: 77
10. Upper Arlington CSD: 76
To no surprise, Columbus remains strongly at the top. There were about 300 more new listings in Columbus in March than in February as warmer weather prompted more sellers to put their homes on the market.
Top 10 Locations with the Fewest New Listings in March 2021
1. Valleyview: 0
2. Lithopolis: 2
3. Minerva Park: 2
4. Jefferson LSD: 8
5. Jonathan Alder: LSD: 11
6. Sunbury: 12
7. Grandview Heights: 12
8. Obetz: 12
9. Whitehall: 12
10. German Village: 13
Total New Listings in the Columbus Metro in March 2021: 2,797
Overall Metro New Listings % Change March 2021 vs March 2020: +3.3%
The small increase overall was pushed by big increases smaller counties like Perry, Pickaway and Union.
Top 10 Fastest-Selling Locations by # of Days Homes Remain on the Market Before Sale in March 2021
1. Canal Winchester CSD: 3
2. Johnstown-Monroe LSD: 4
3. Minerva Park: 6
4. Hilliard: 7
5. Jefferson LSD: 7
6. Gahanna: 8
7. Groveport Madison LSD: 8
8. Whitehall: 9
9. London CSD: 10
10. Jonathan Alder LSD: 11
11. Marysville CSD: 11
12. South-Western CSD: 11
Top 10 Slowest-Selling Locations by # of Days Homes Remain on the Market Before Sale in March 2021
1. Lithopolis: 59
2. Powell: 55
3. Downtown Columbus: 54
4. Short North: 52
5. Big Walnut LSD: 49
6. Lancaster CSD: 39
7. Olentangy LSD: 38
8. Dublin: 37
9. Grandview Heights: 36
10. Buckeye Valley LSD: 34
Top 10 Locations with the Greatest % Decline of # of Days on the Market Before Sale March 2021 vs March 2020
1. Johnstown-Monroe LSD: -92.7%
2. Canal Winchester CSD: -92.5%
3. Minerva Park: -90.2%
4. Jefferson LSD: -89.9%
5. Sunbury: -85.0%
6. Jonathan Alder LSD: -83.8%
7. New Albany: -81.9%
8. New Albany Plain LSD: -75.5%
9. Marysville CSD: -71.8%
10. Whitehall: -71.0%
Top 10 Locations with the Lowest % Decline of # of Days on the Market Before Sale March 2021 vs March 2020
1. Worthington CSD: +50.0%
2. Worthington: +38.5%
3. Powell: +12.2%
4. Lancaster CSD: +2.6%
5. Hilliard CSD: -4.3%
6. Obetz: -5.3%
7. Short North: -10.3%
8. Newark CSD: -14.3%
9. Downtown Columbus: -23.9%
10. Pataskala: -26.1%
% Change for the # of Days Homes Remain on the Market Before Sale Across the Metro Overall:
-24.5%
The market remained hot in March, with faster sales and higher prices than in the previous. Inventory did inch up some as spring arrived, but not nearly enough to counter overall demand. Urban areas are still a bit off their peaks from pre-Covid and protests, but seem to have recovered slightly from some previous months.
The previous housing market report and the Columbus Realtors site offers additional information on the Columbus market.