Part 2 is now available for more great before and after comparisons.
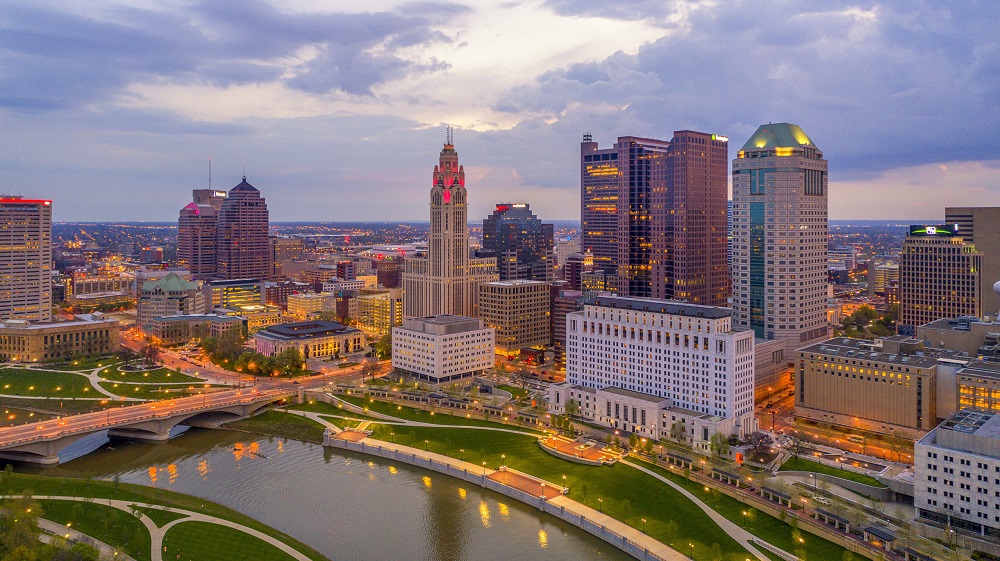
How Columbus has changed in 10 years is not always easily quantifiable. Columbus added more people in the past decade than during any previous similar period in its history. I’ve posted a lot about the 2020 Census data and updated many pages worth of information to the site. However, examining only population change through numbers is just one part of the story. How has that population growth manifested in terms of how the city appears in its built environment? This before and after look shows how the city has been transformed on a visual scale, and shows how some of the hottest neighborhoods have been radically altered in a short time.
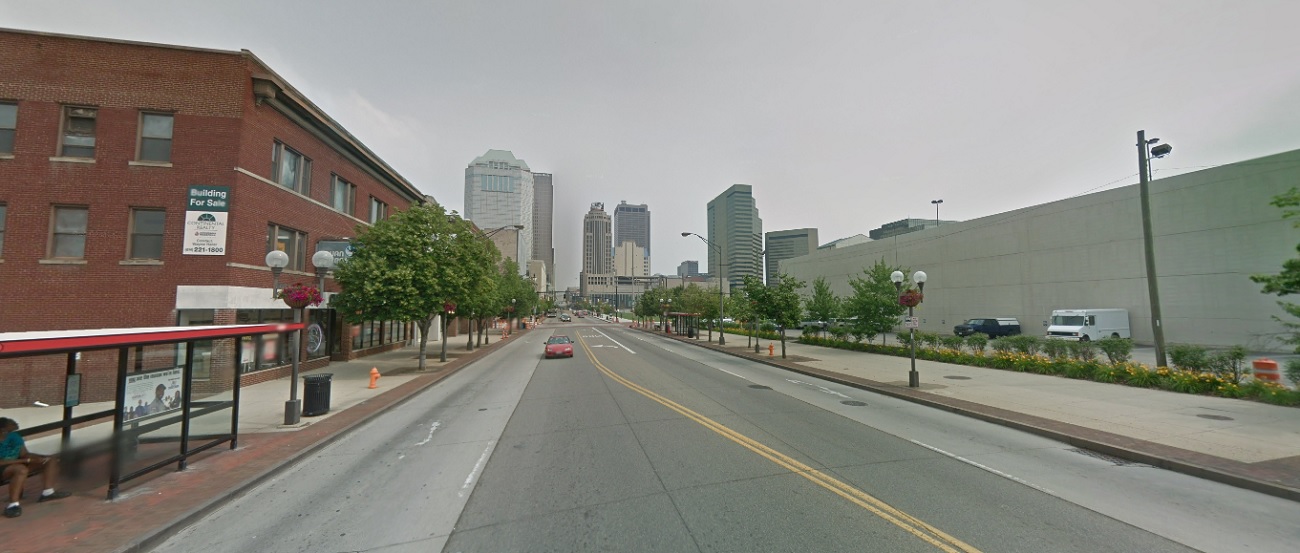
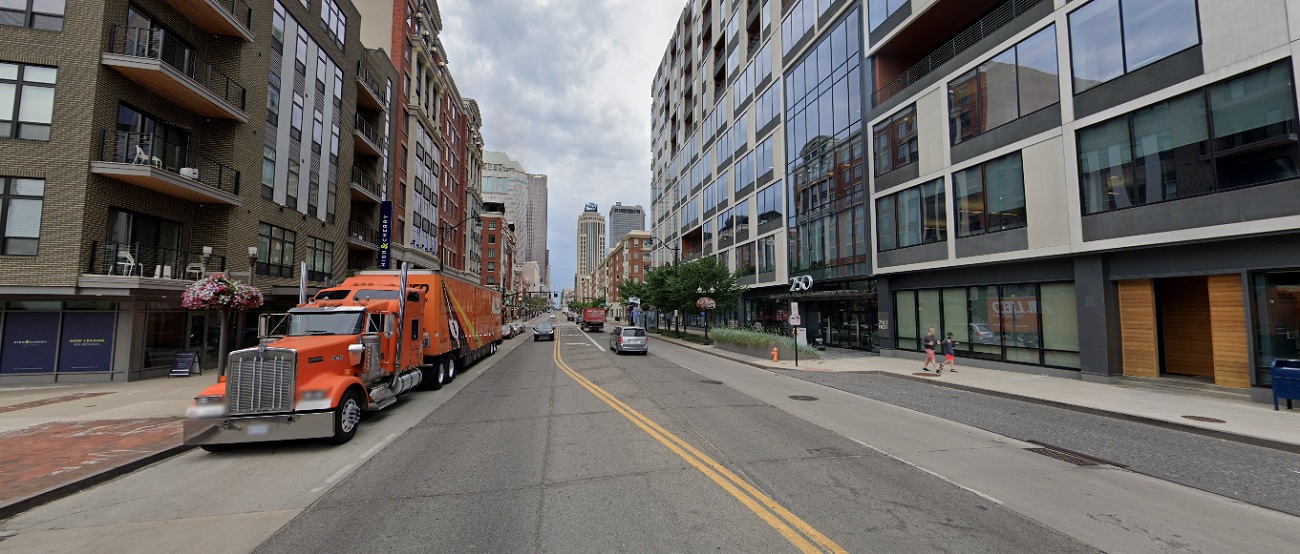
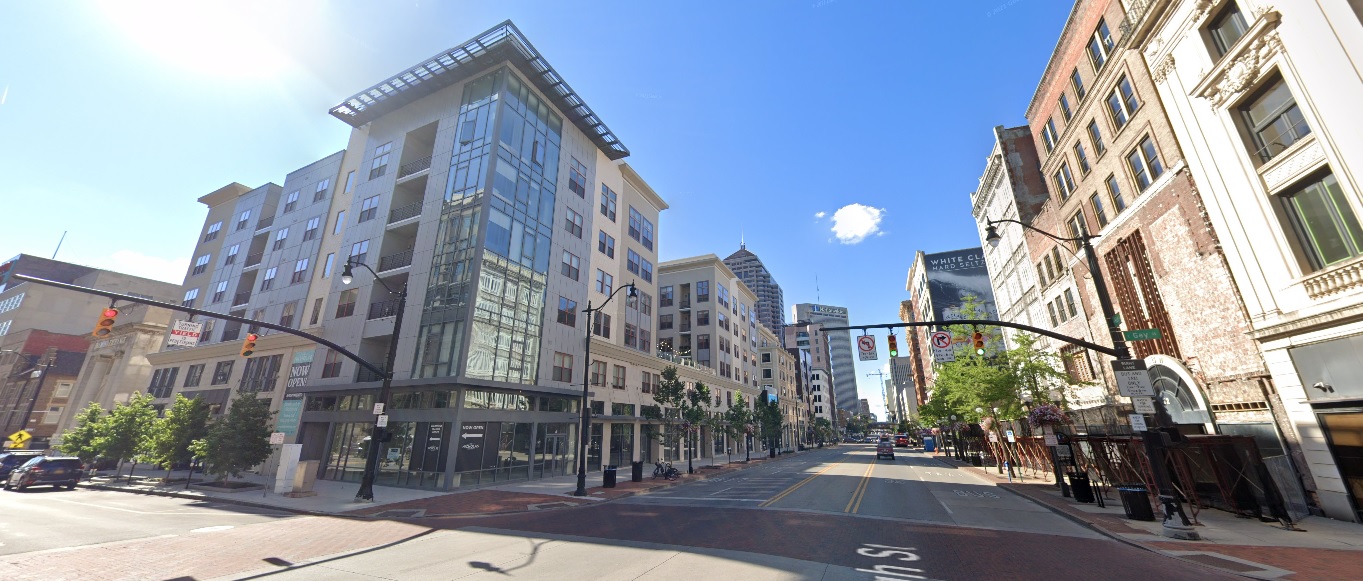
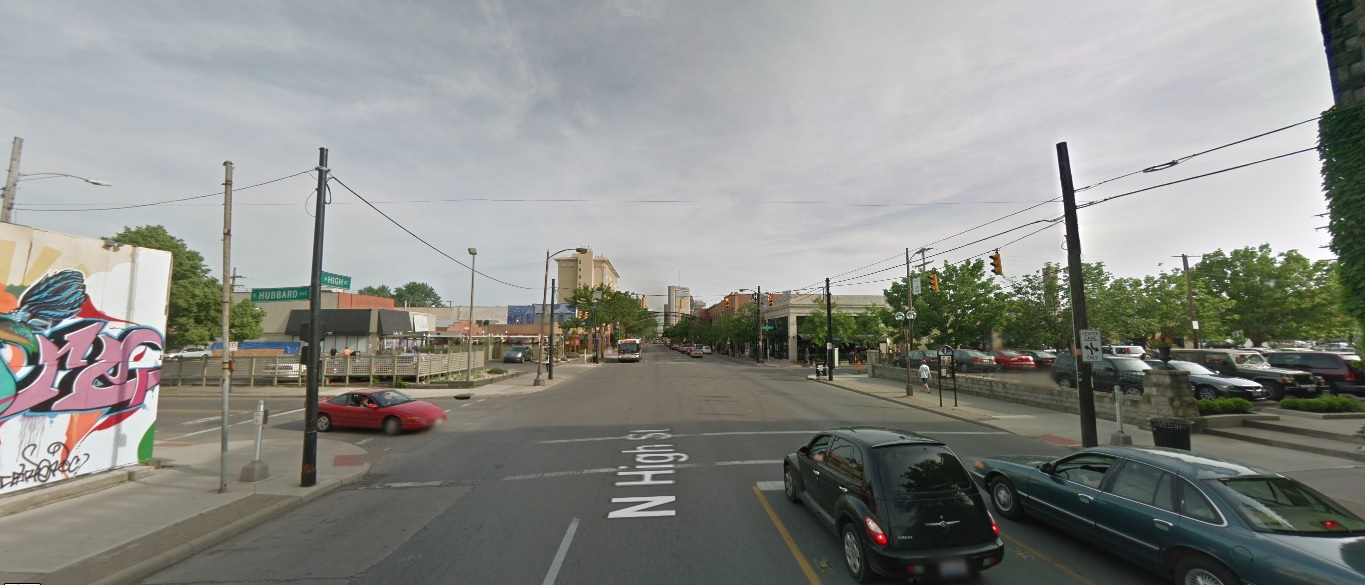
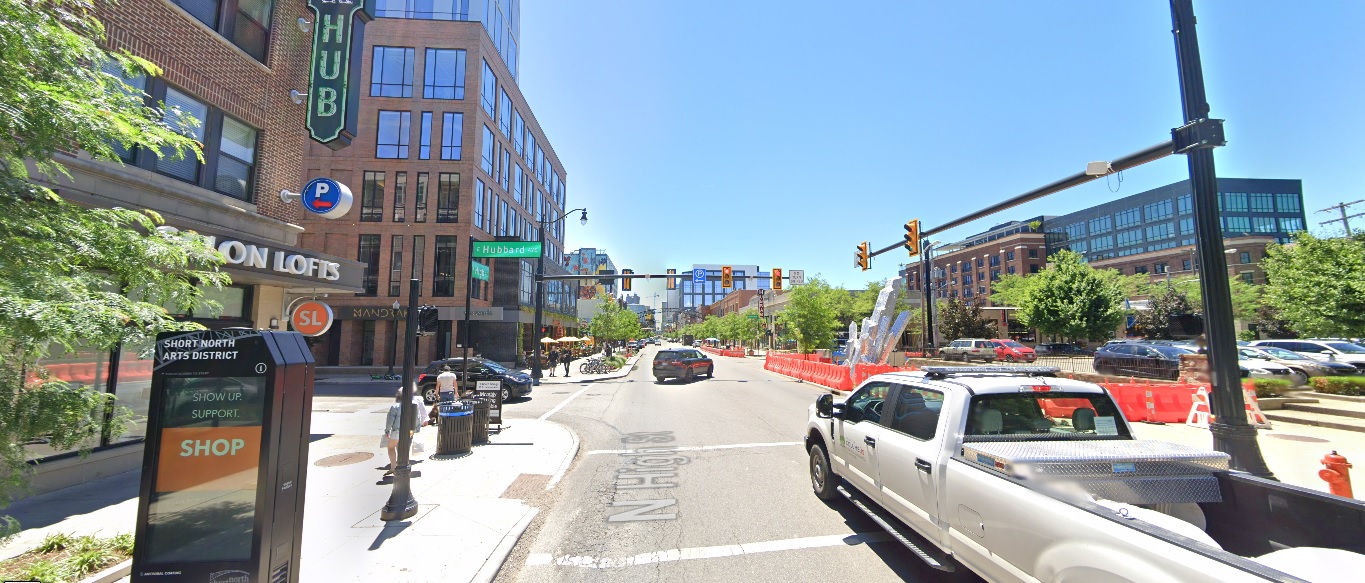
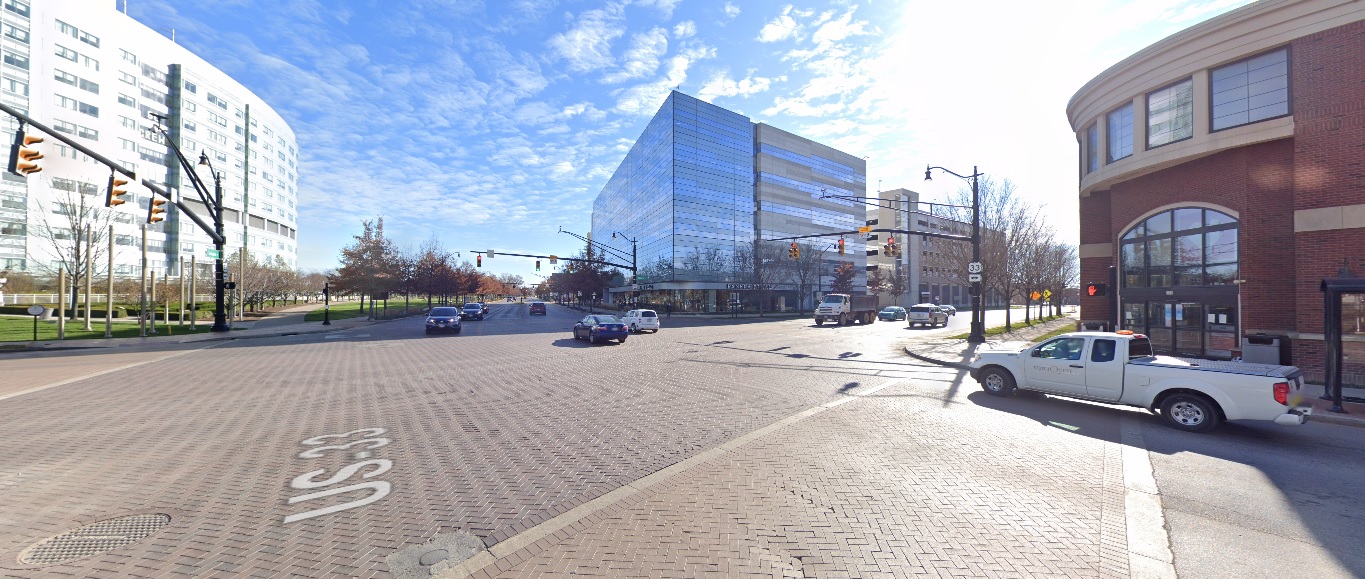
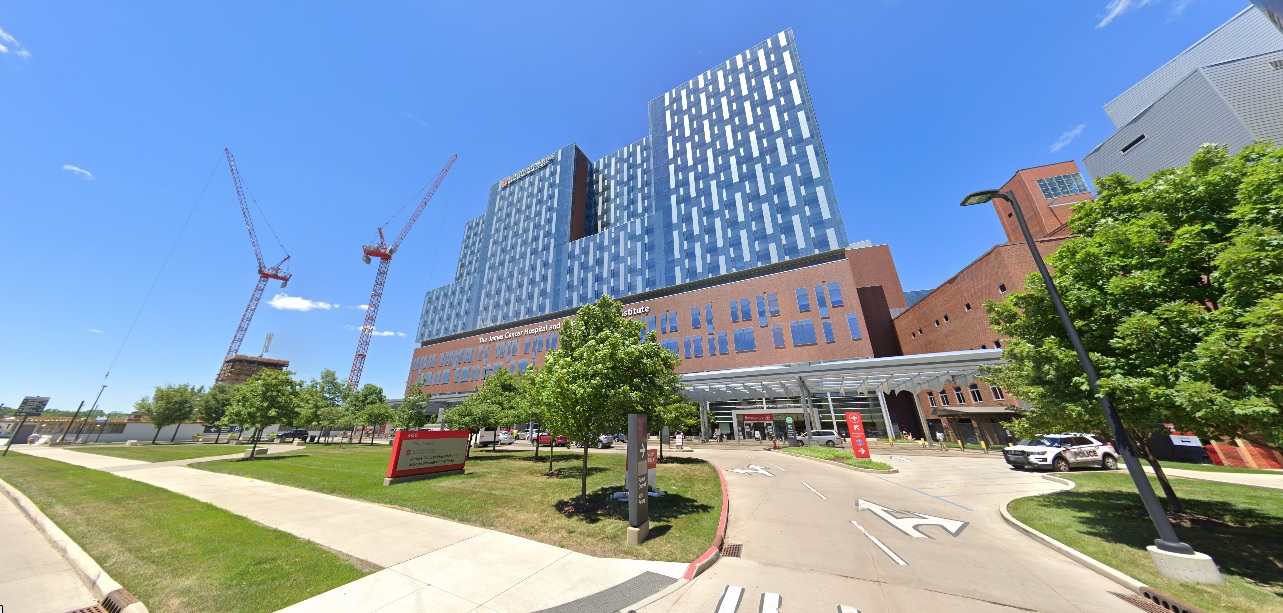
Downtown High Street, looking north from Rich Street Before: 2011 After: 2021 High Street, looking north from Gay Street Before: 2011 After: 2021
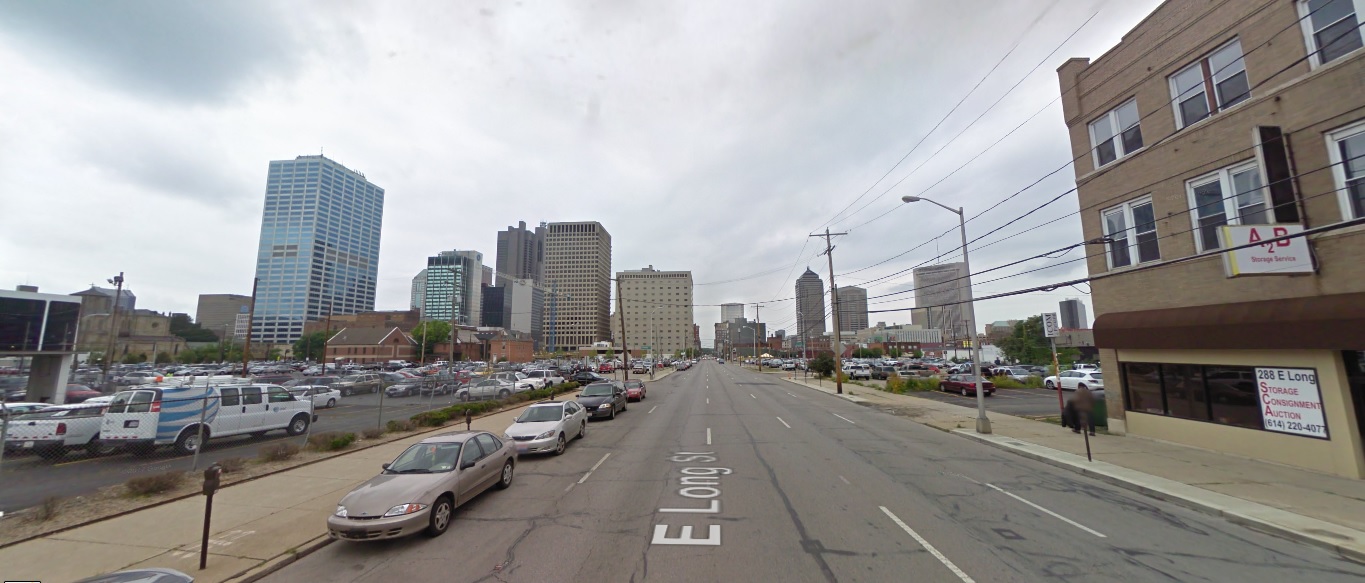
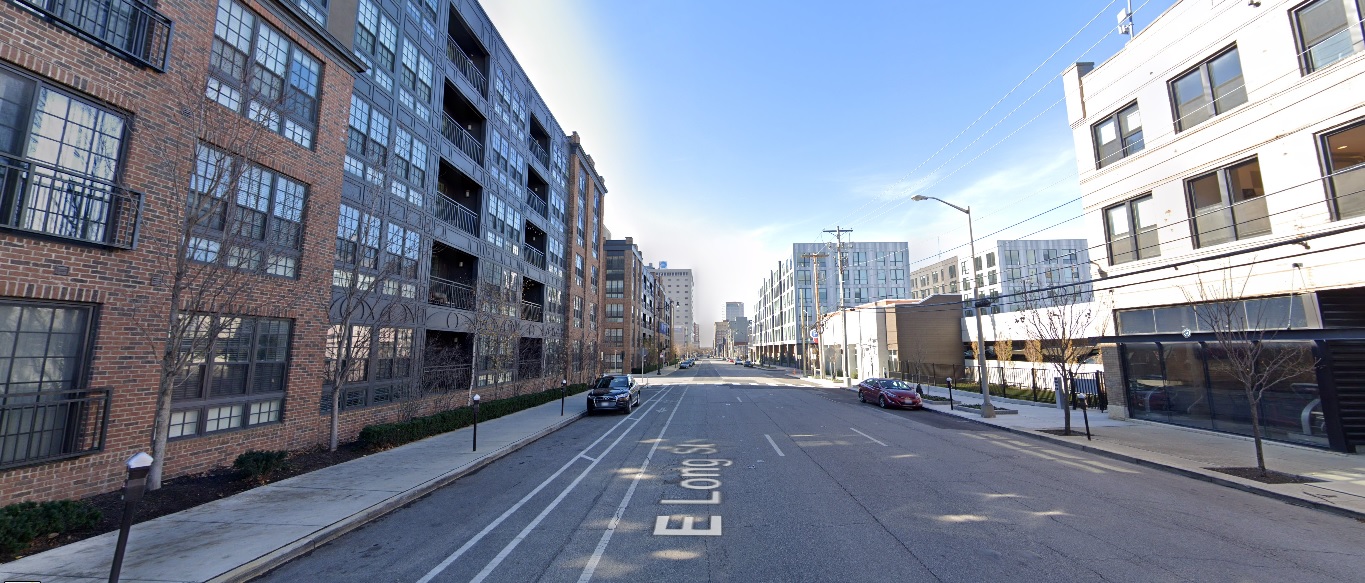
Long Street, looking east from 6th Street Before: 2011 After: 2020
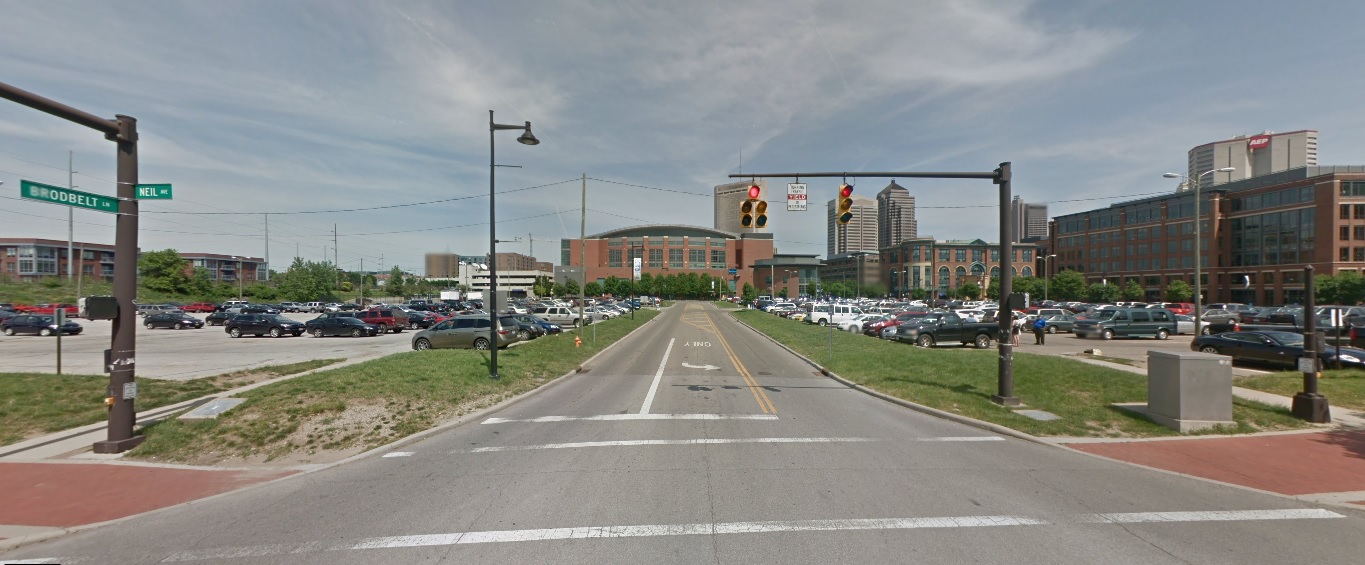
Neil Avenue, looking east at Broadbelt Lane Before: 2011 After: 2021
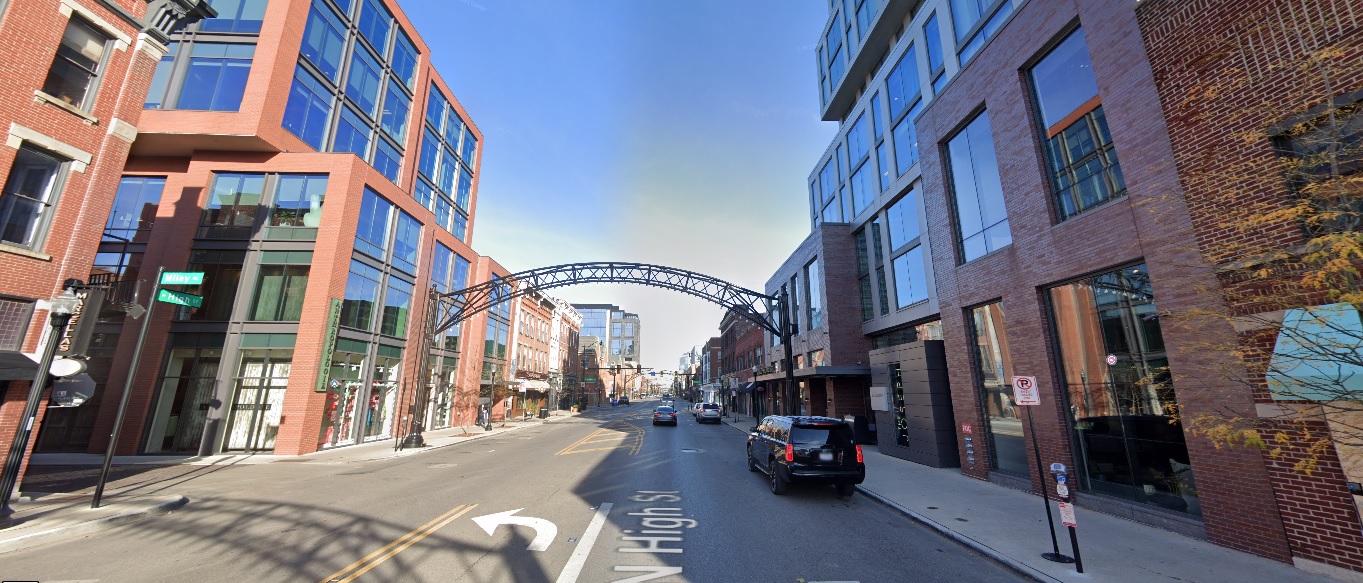
The Short North High Street, looking north from Milay Alley Before: 2011 After: 2020
High Street, looking south from Buttles Avenue Before: 2011 After: 2021
Fourth Street, looking east at Auden Avenue Before: 2011 Before: 2021
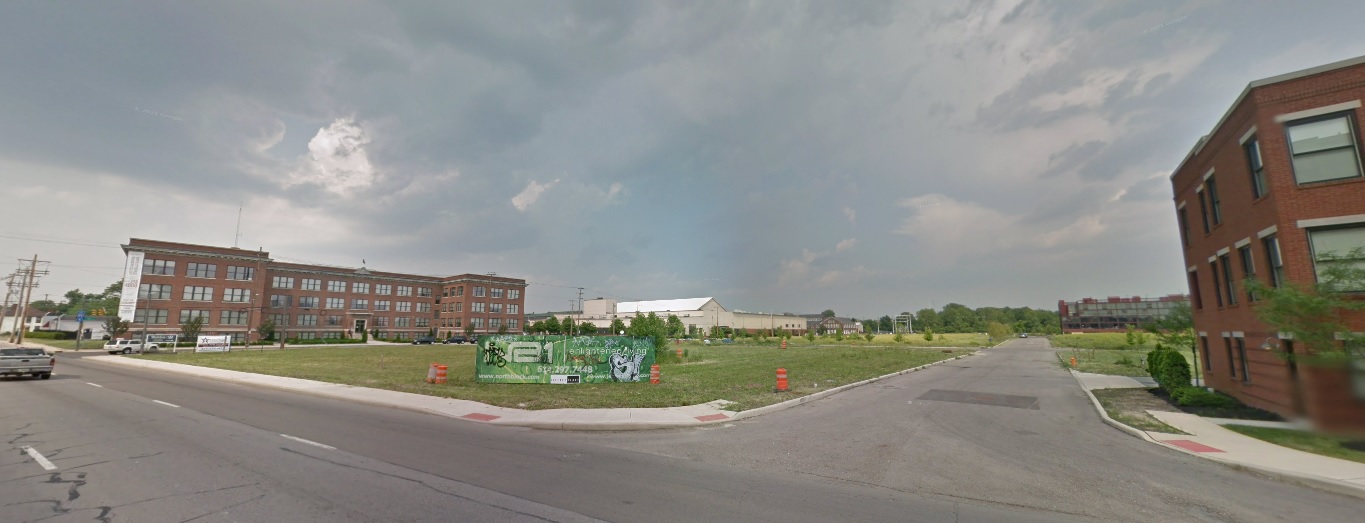
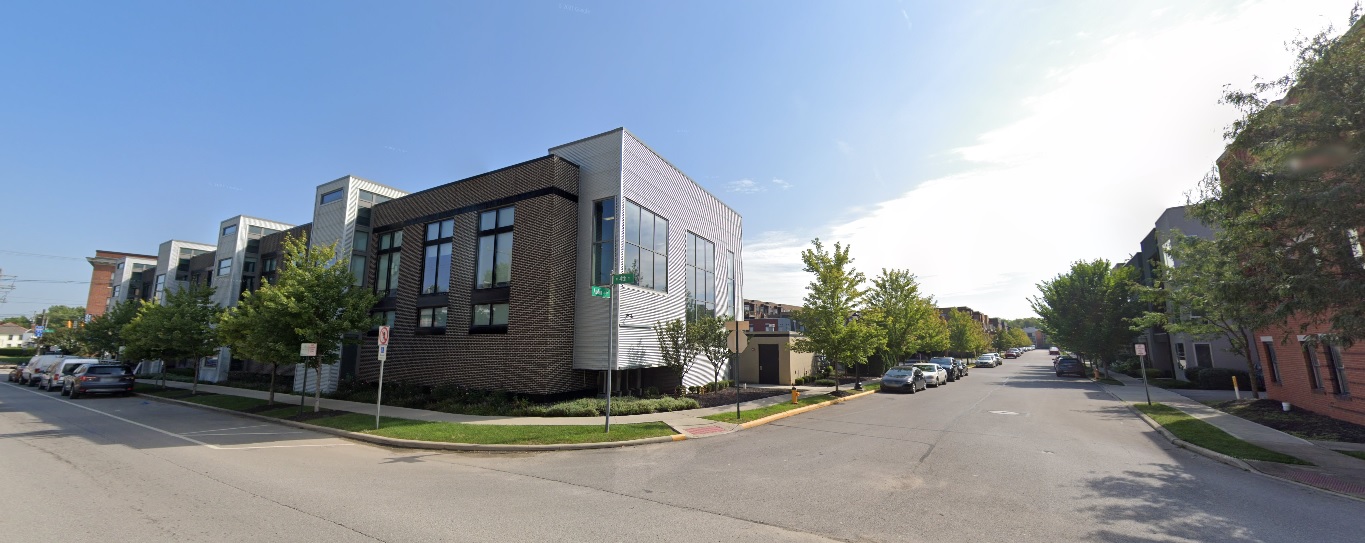
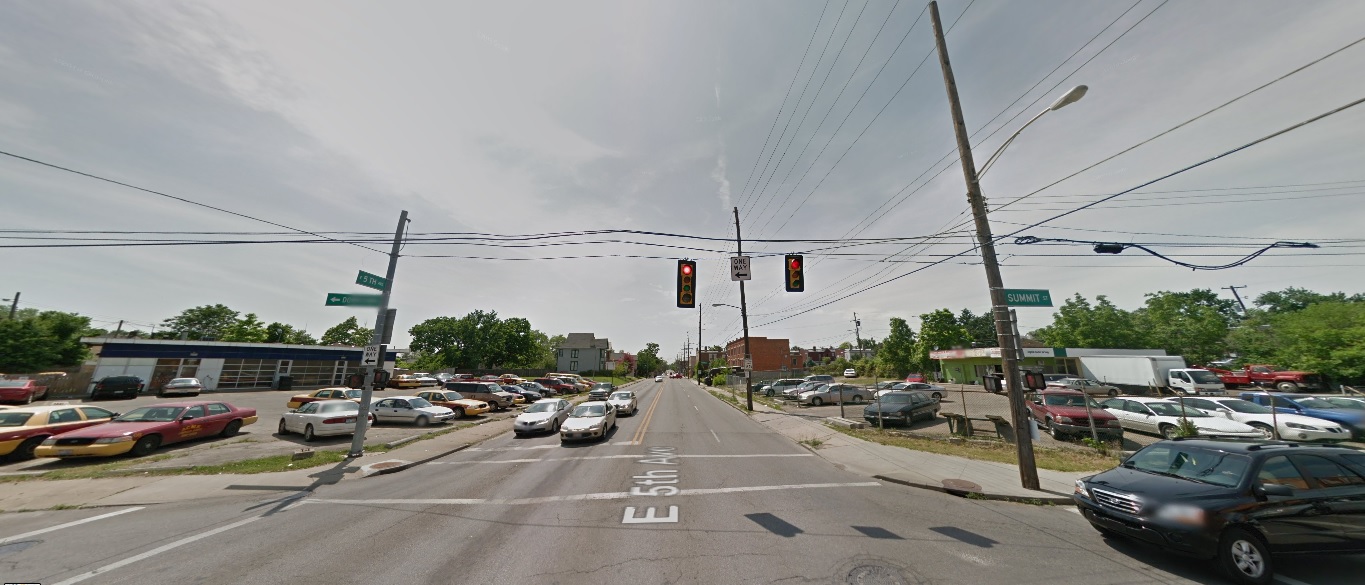
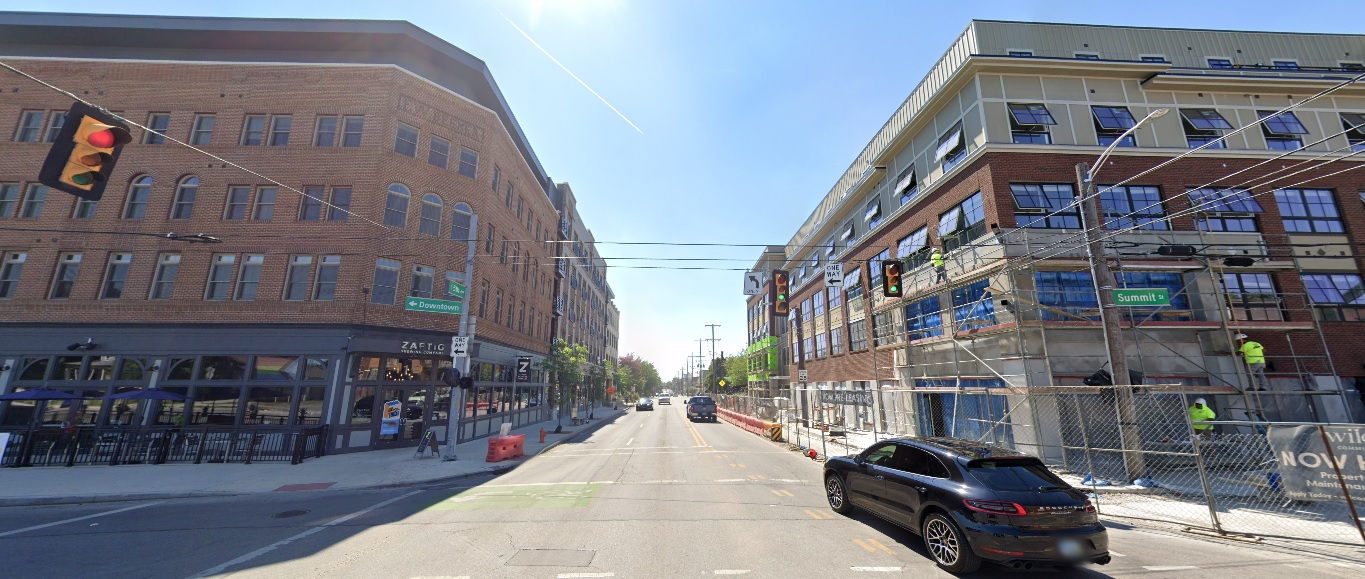
Summit Street, looking west at 5th Avenue Before: 2011 After: 2021
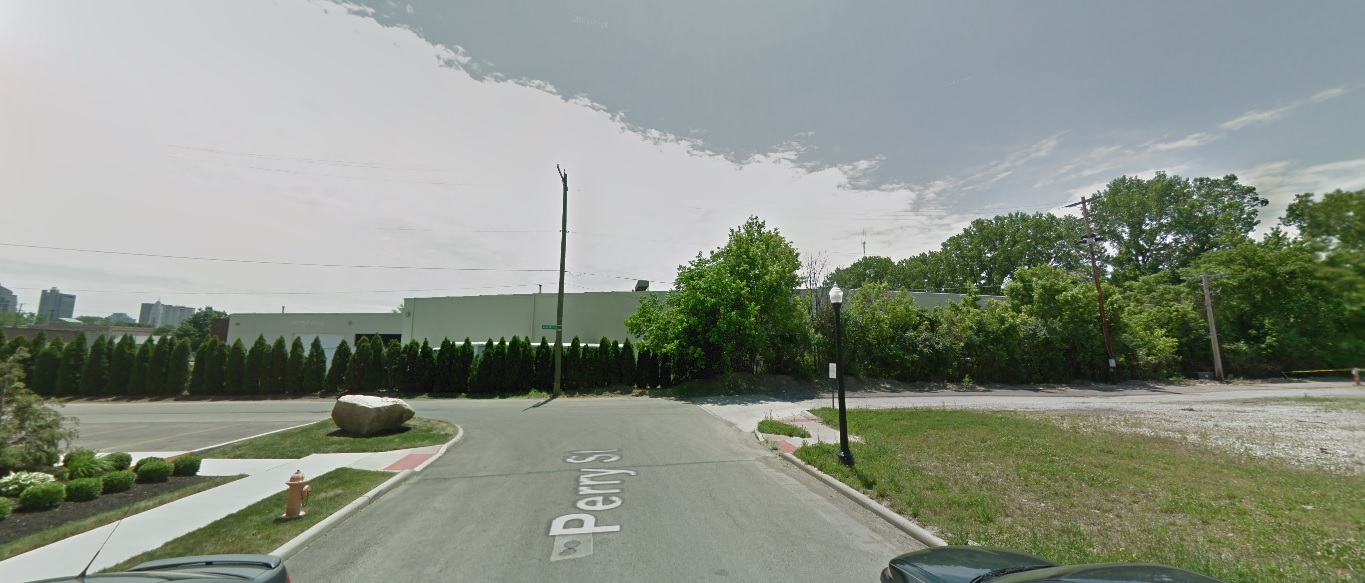
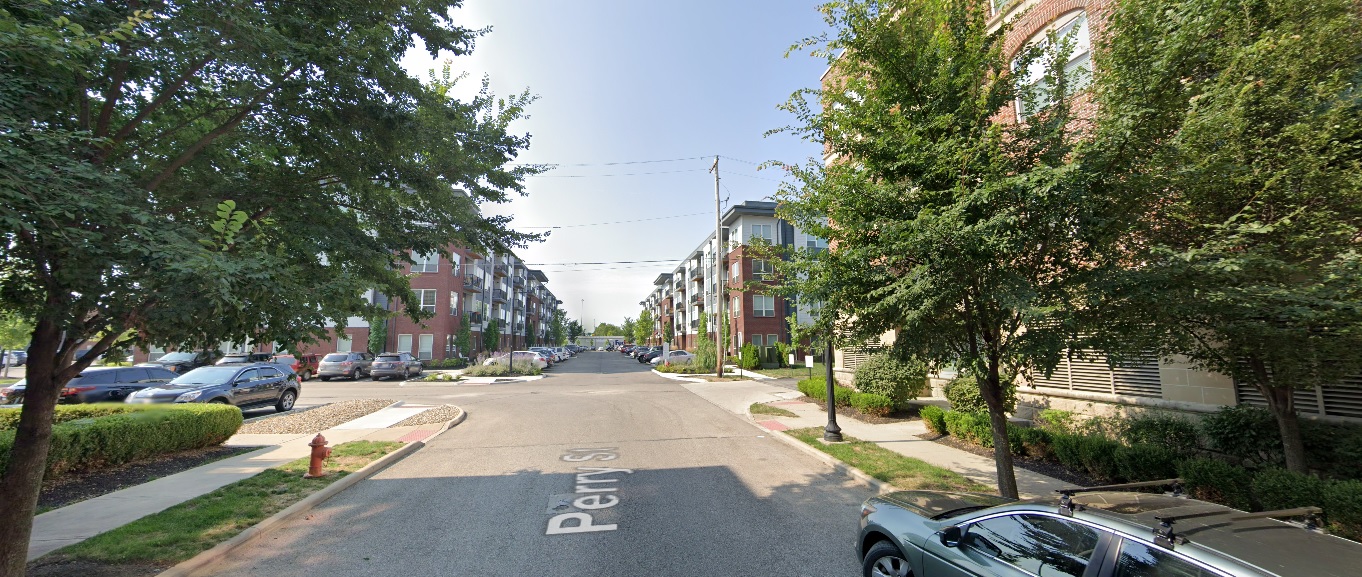
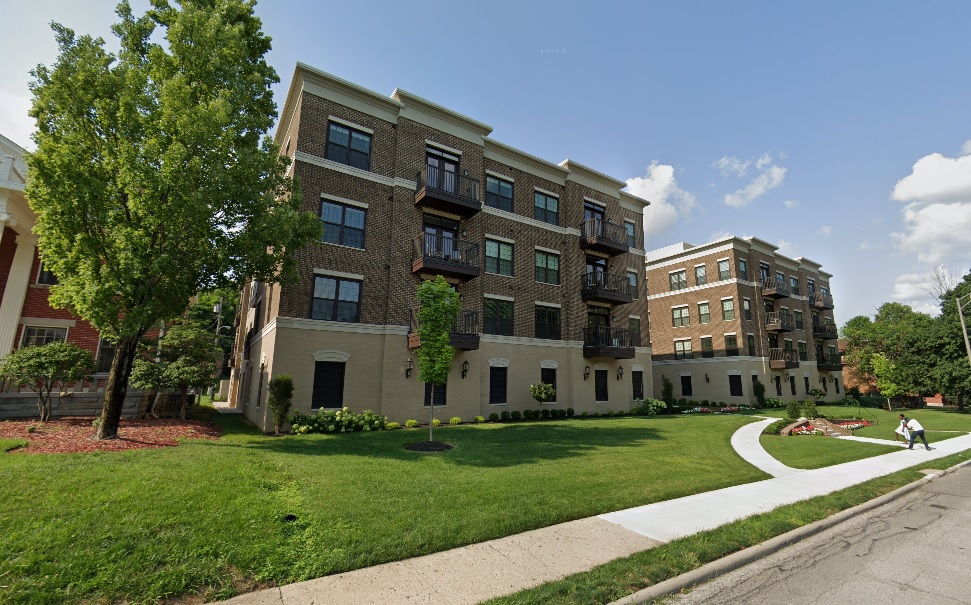
Perry Street, looking south at Quality Place Before: 2011 After: 2021
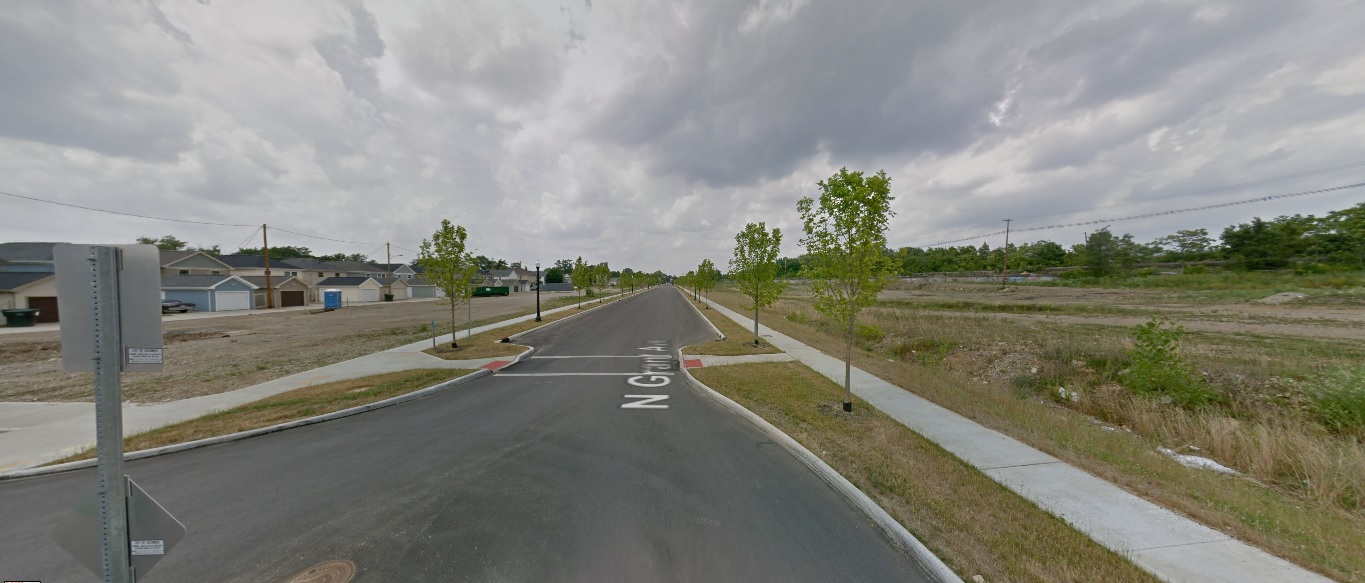
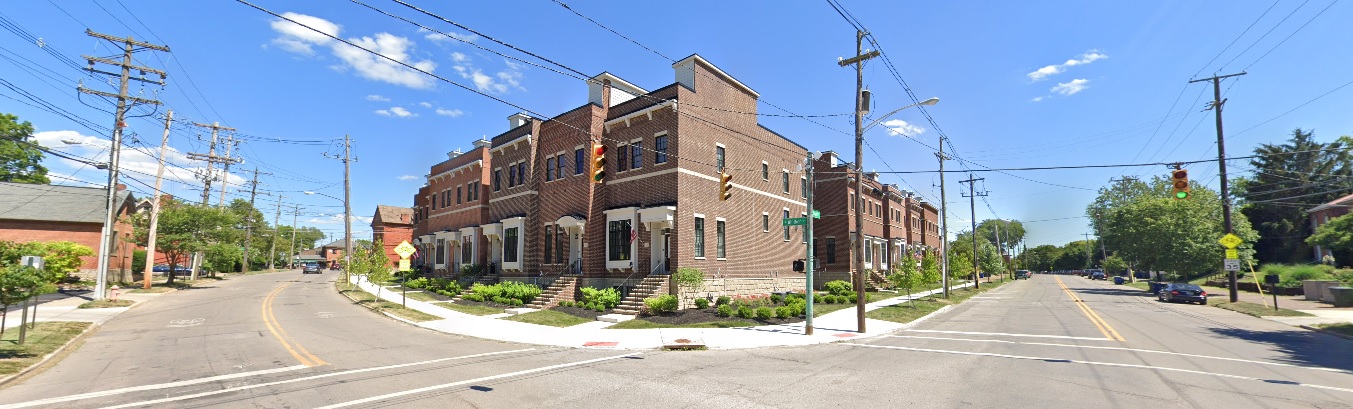
Weinland Park Grant Avenue, looking north from 7th Avenue Before: 2012 After: 2021
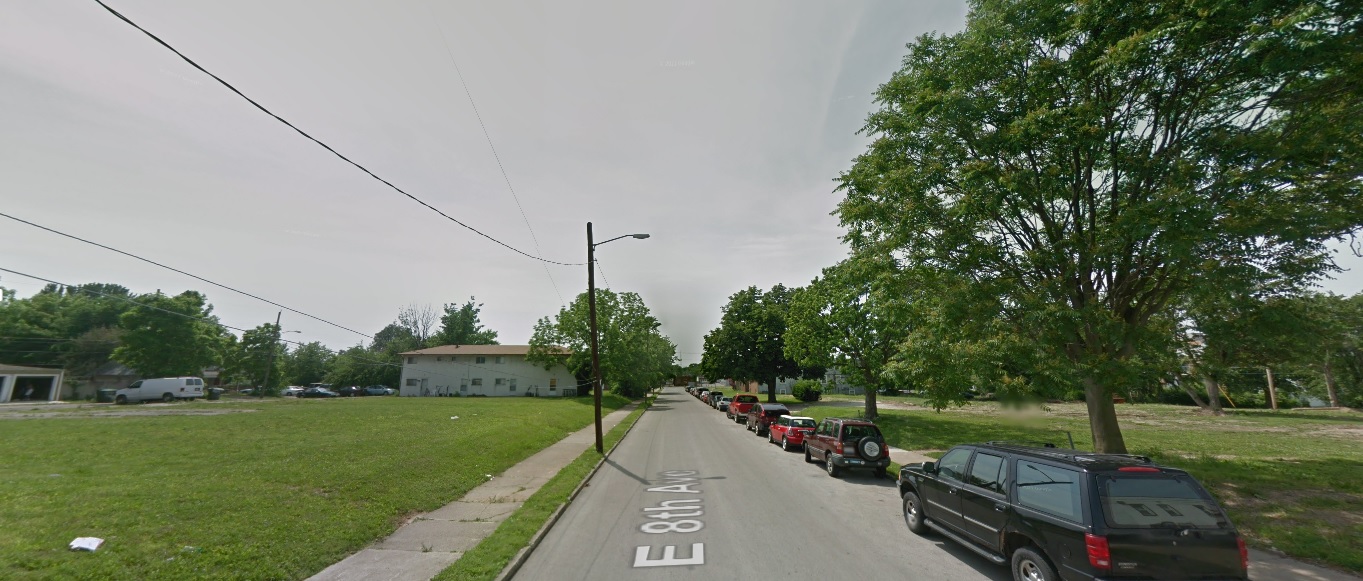
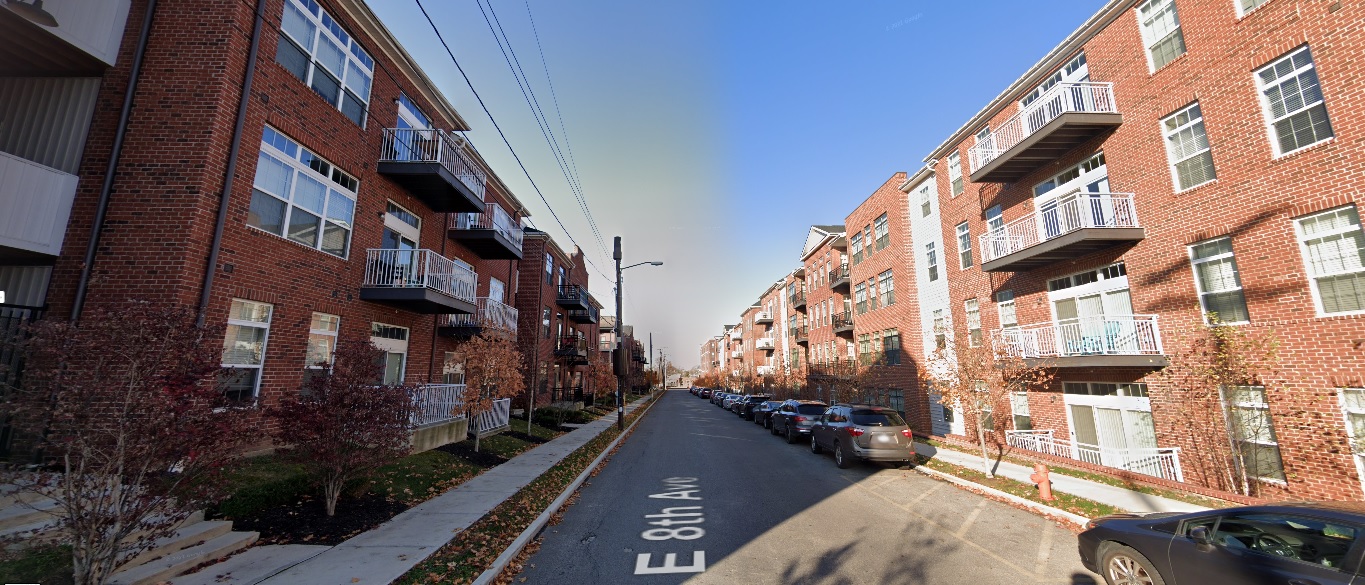
Eighth Avenue, looking west from Section Alley Before: 2011 After: 2020
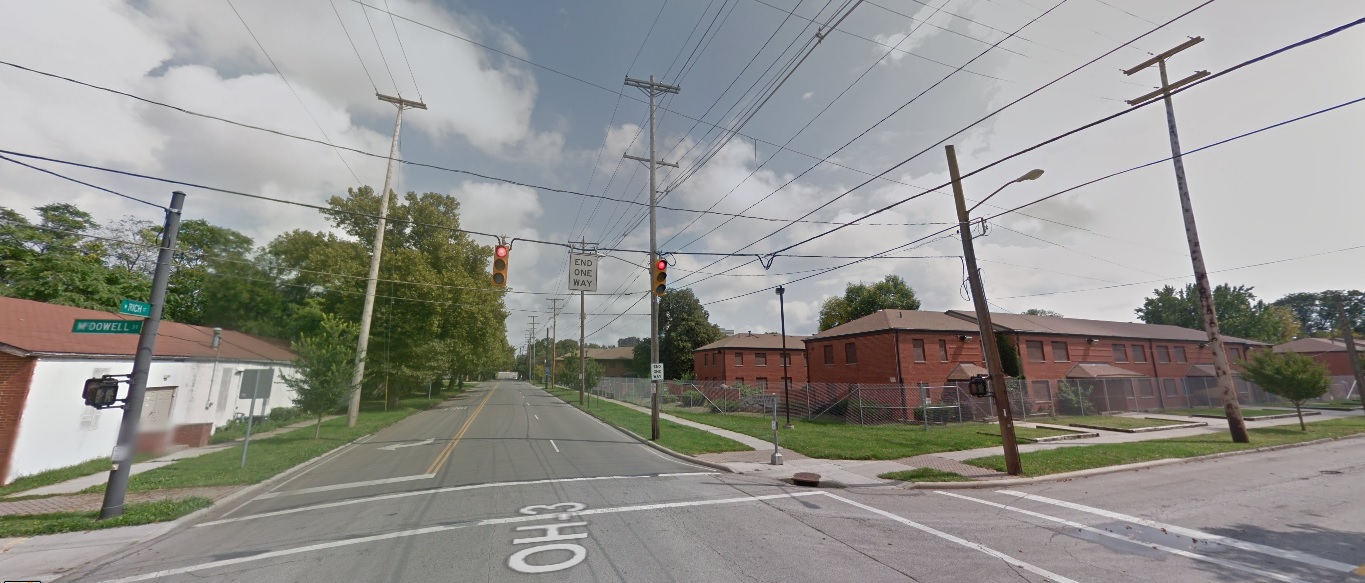
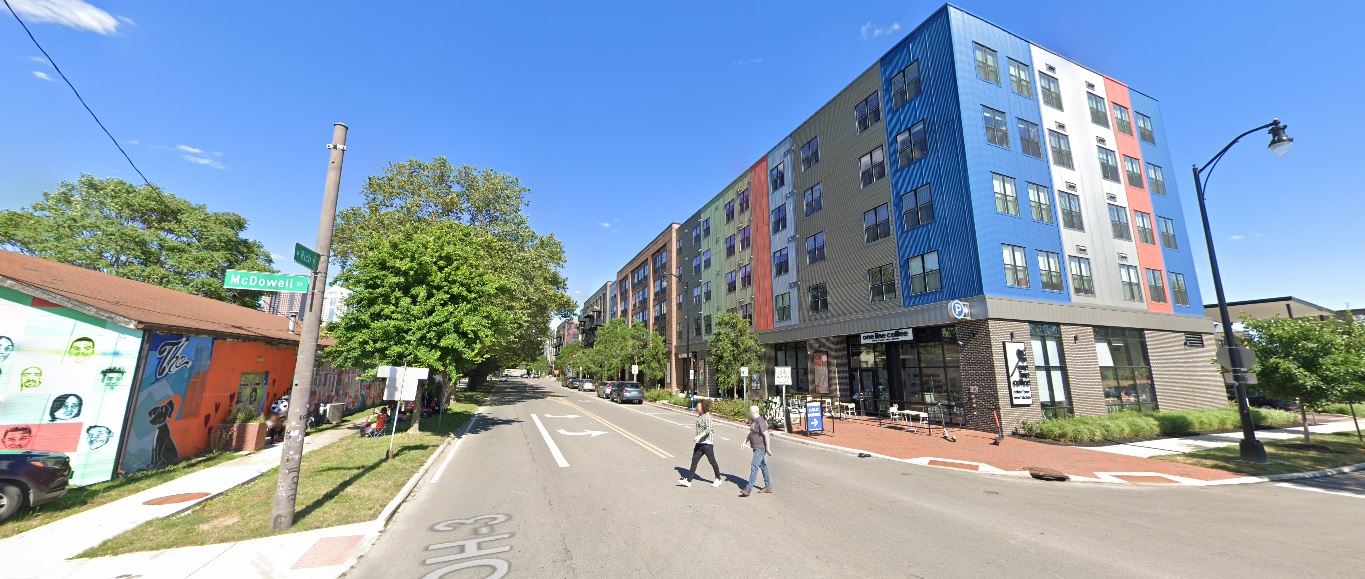
Franklinton Rich Street, looking east from McDowell Street Before: 2011 After: 2021
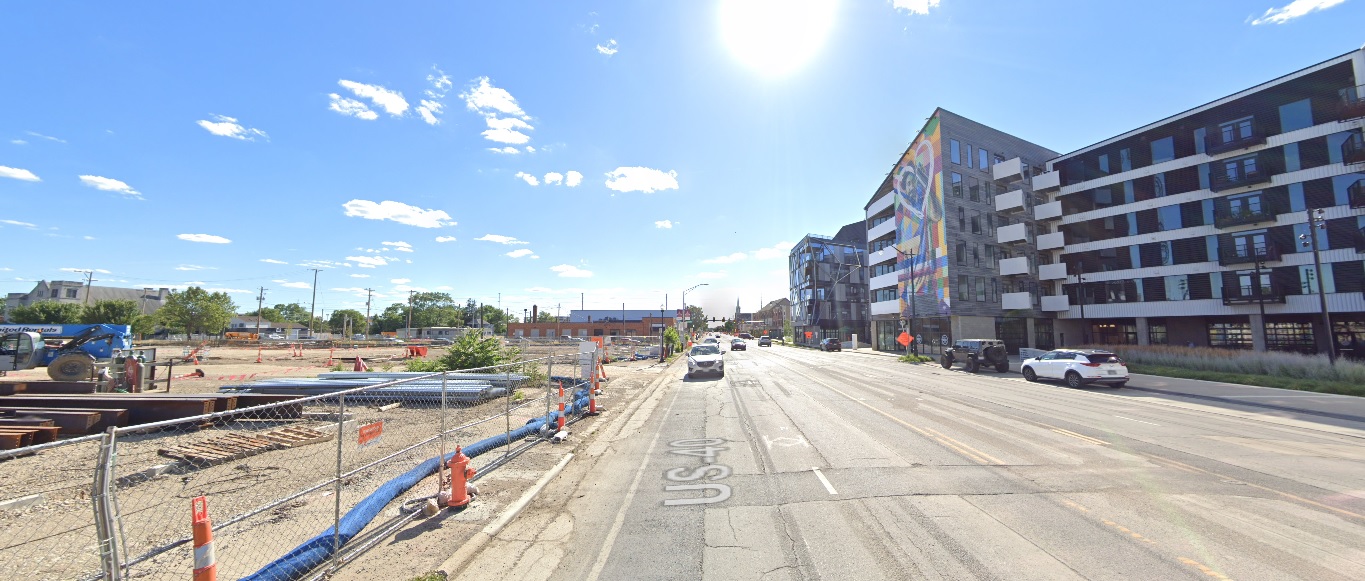
Broad Street, looking west from the railroad tracks. Before: 2011 After: 2021
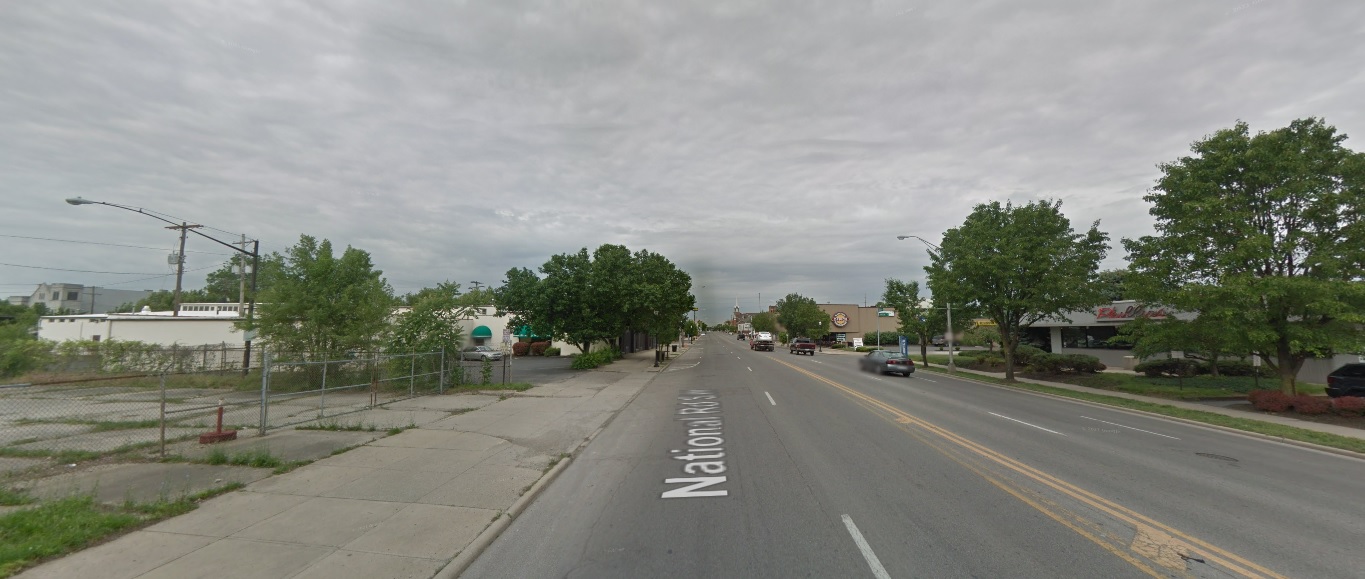
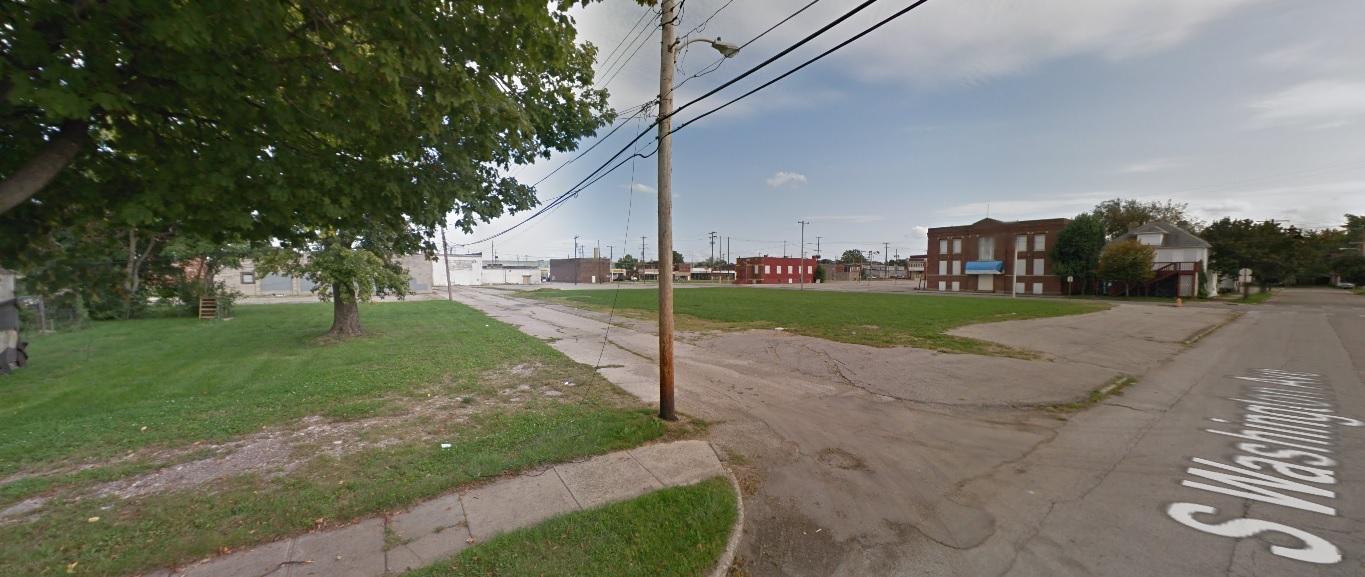
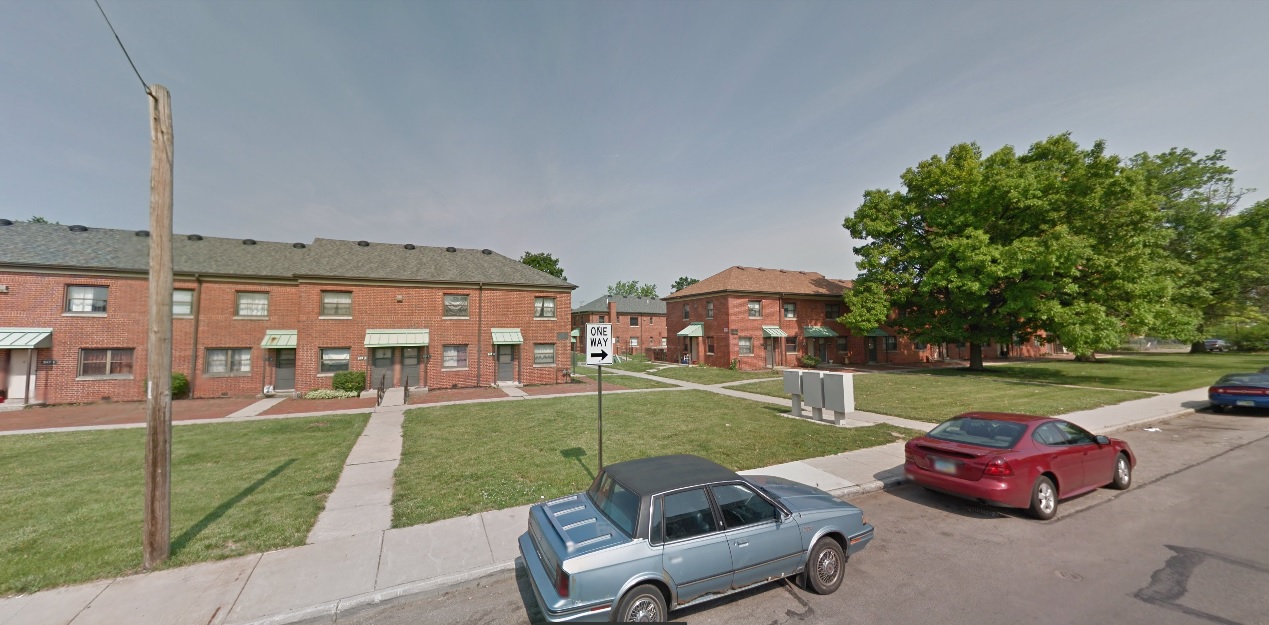
South Side Livingston Avenue, looking east at Parsons Avenue Before: 2009 After: 2020
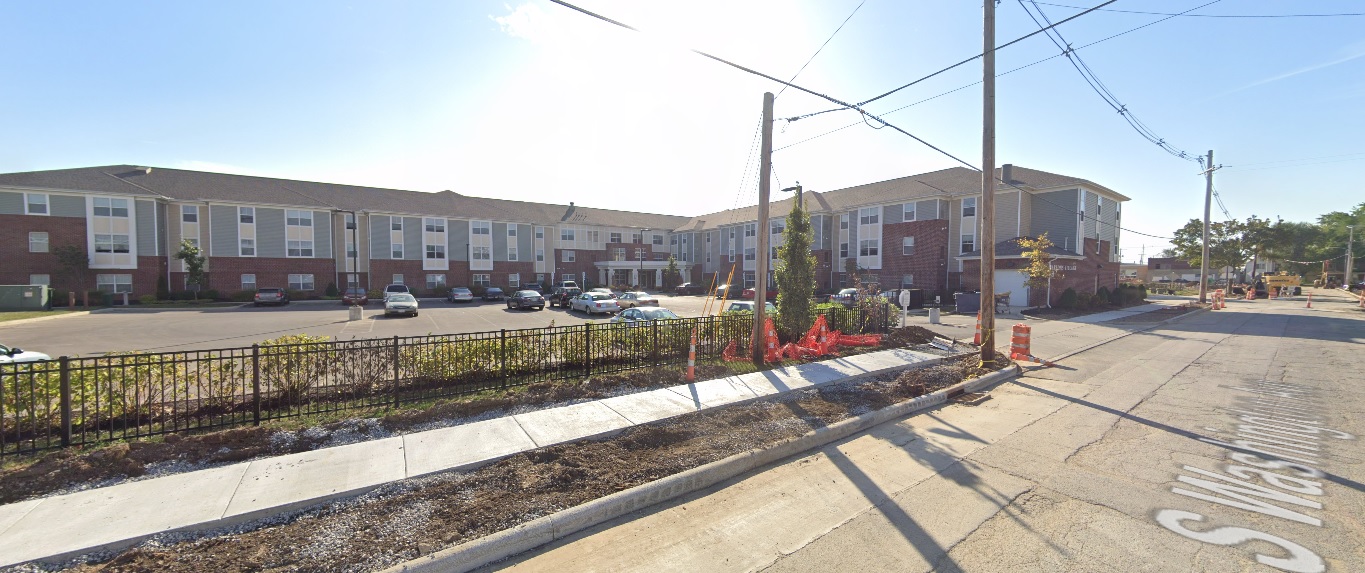
Washington Avenue, looking southeast from Innis Avenue Before: 2011 After: 2020
Front Street, looking south at Whittier Street Before: 2011 After: 2021
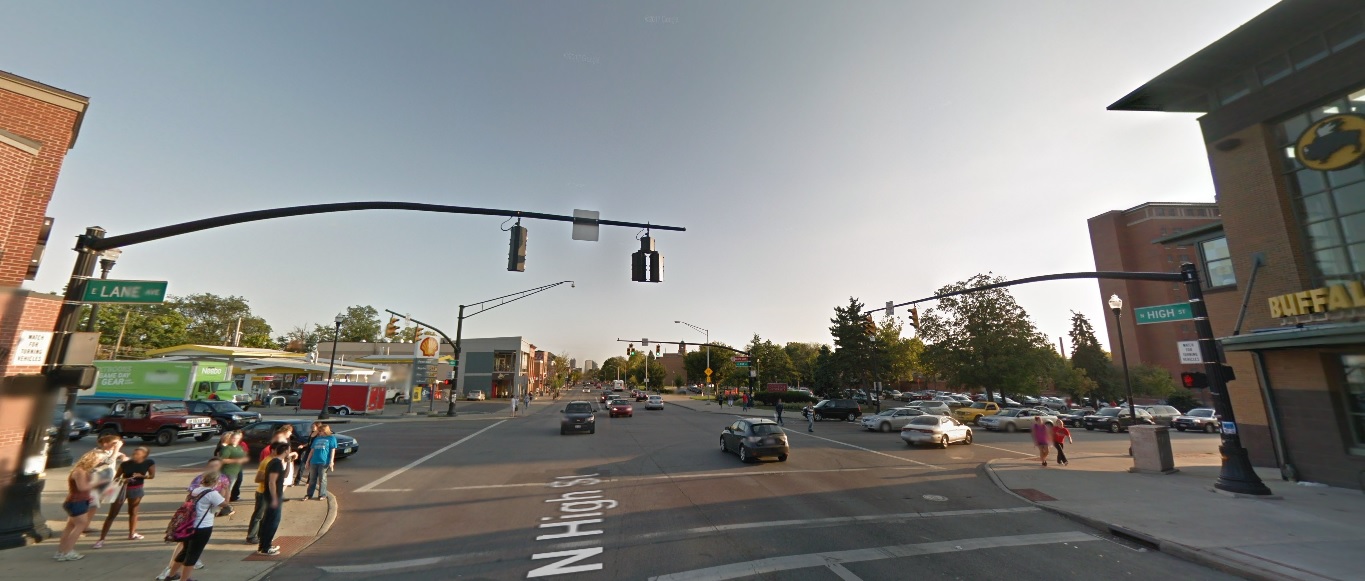
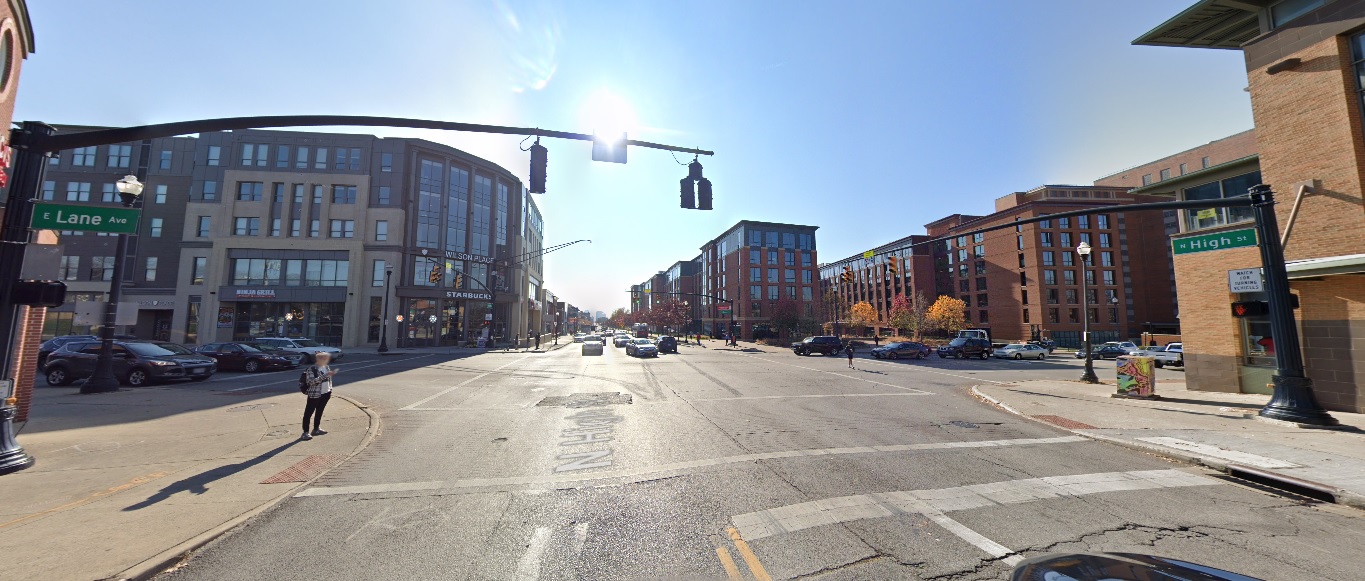
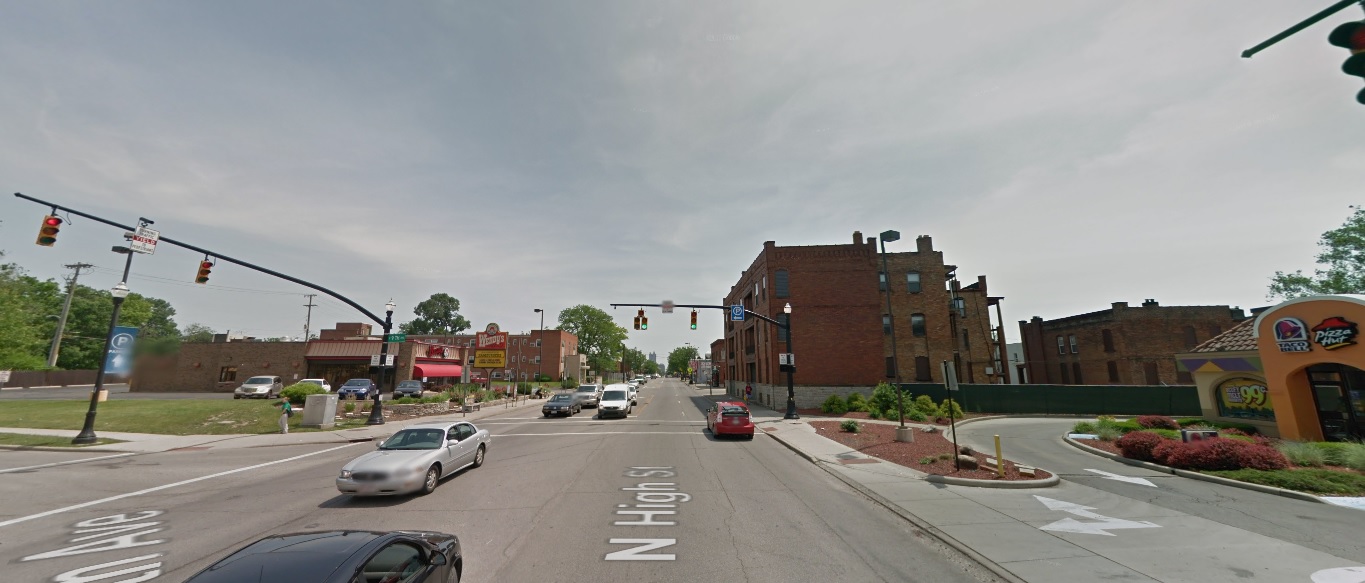
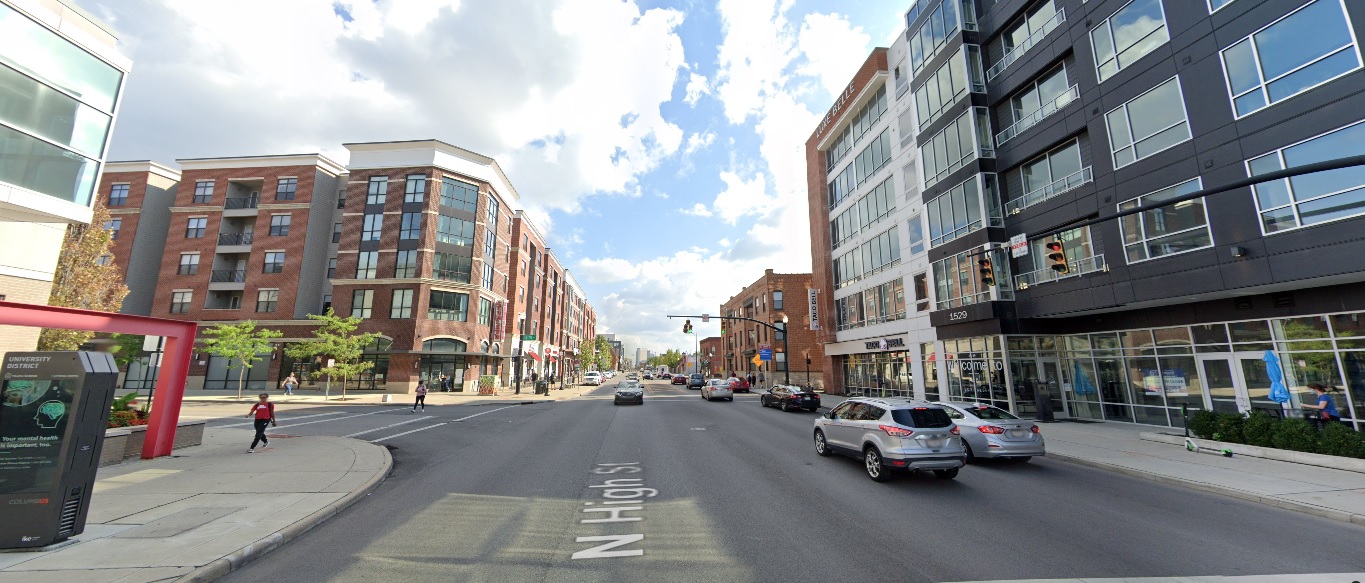
Campus High Street, looking south from Lane Avenue Before: 2011 After: 2020
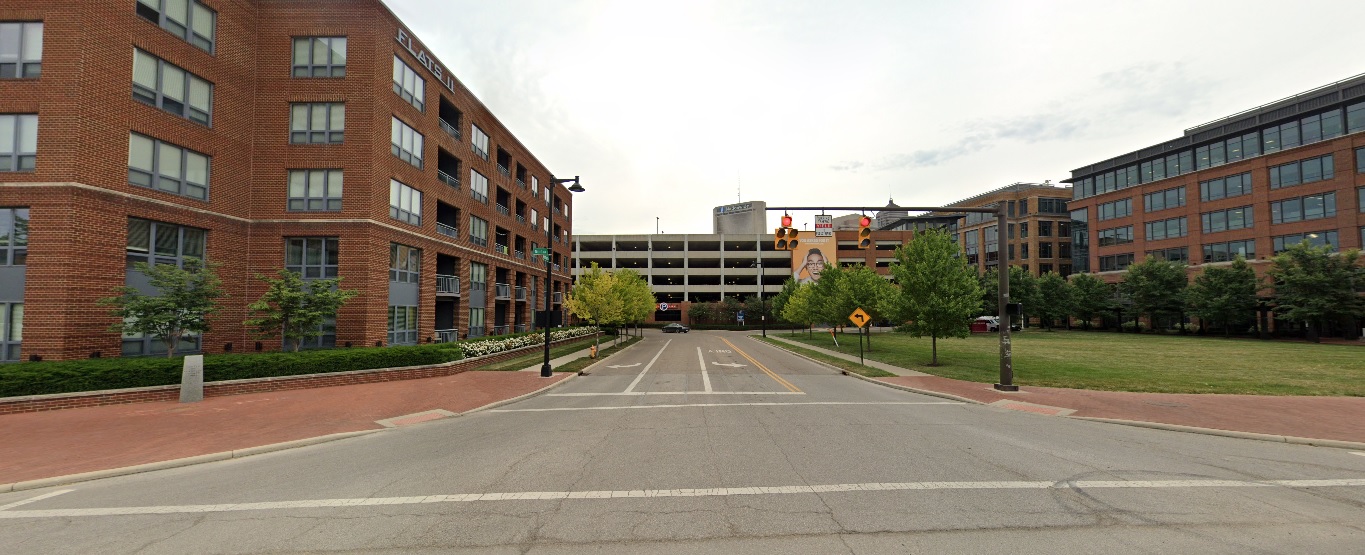
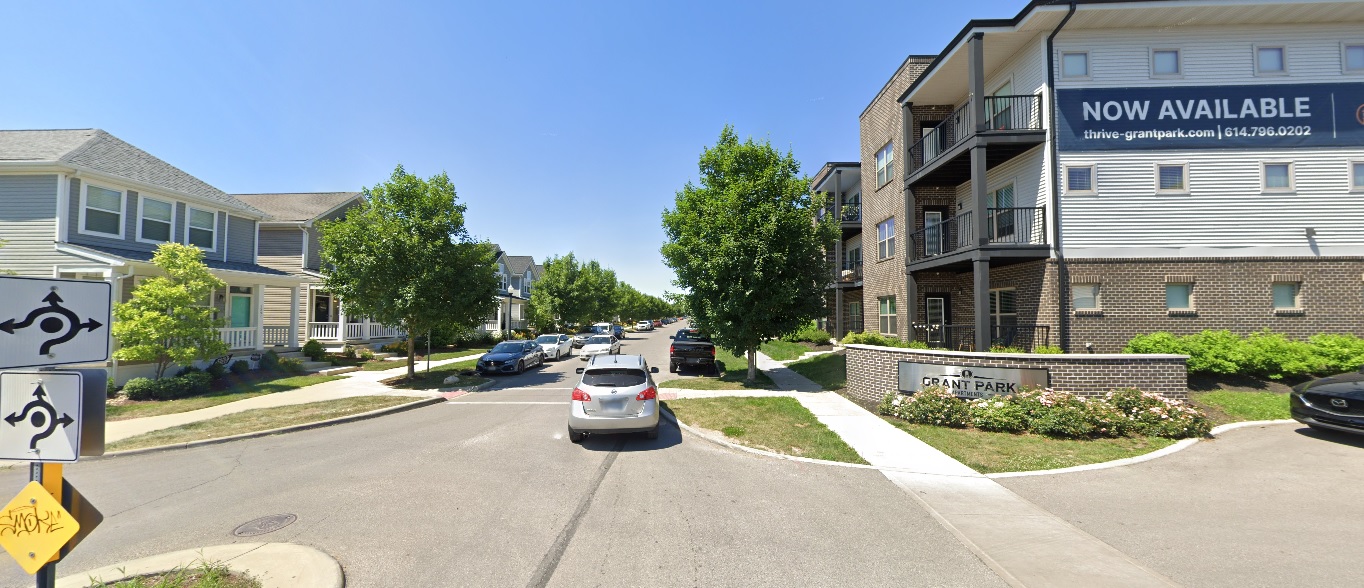
High Street, looking south from 8th Avenue Before: 2011 After: 2021
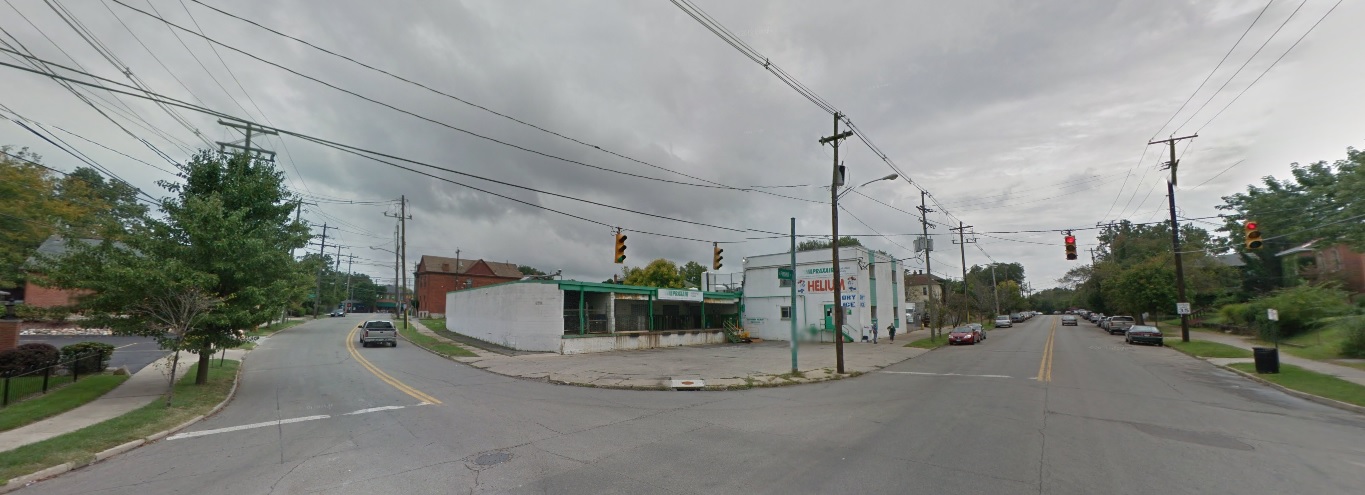
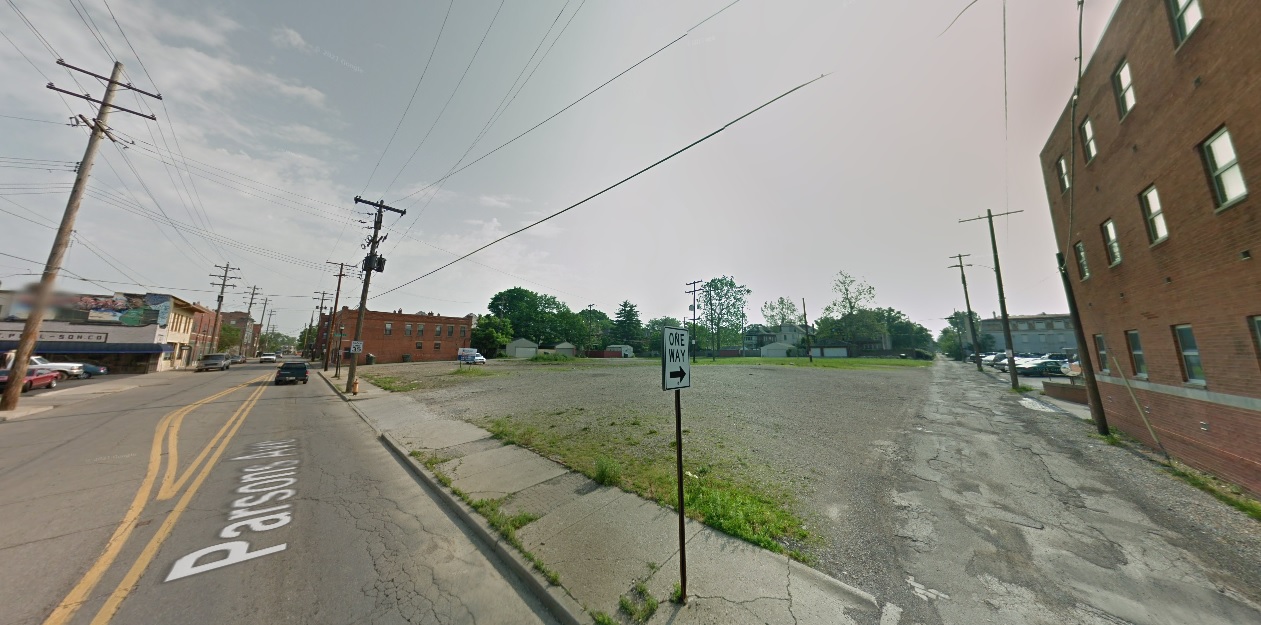
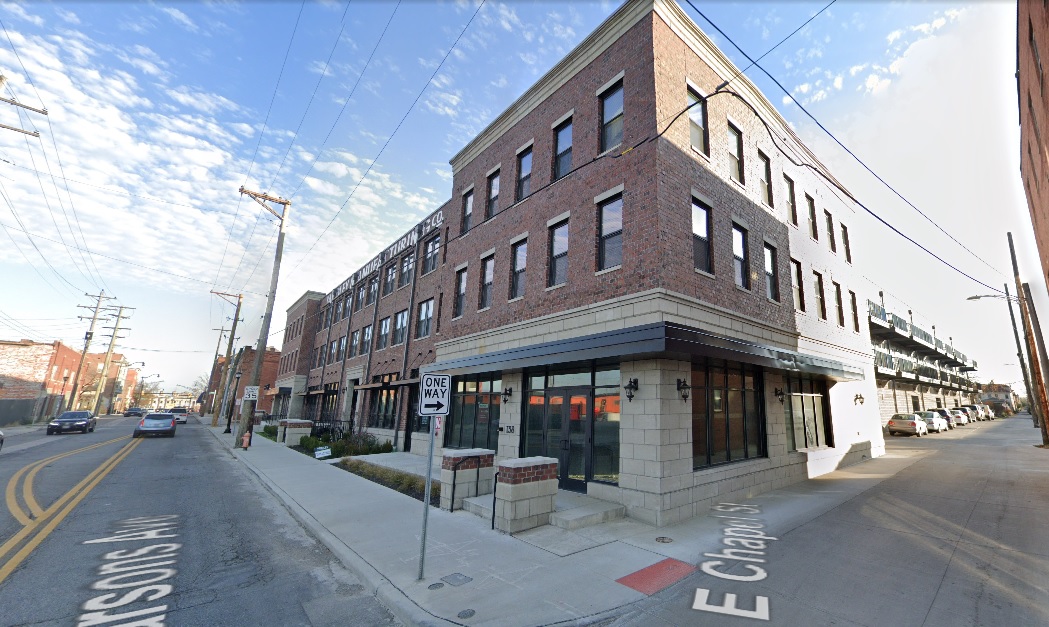
West Side Parsons Avenue, looking northeast from Chapel Street Before: 2011 After: 2020
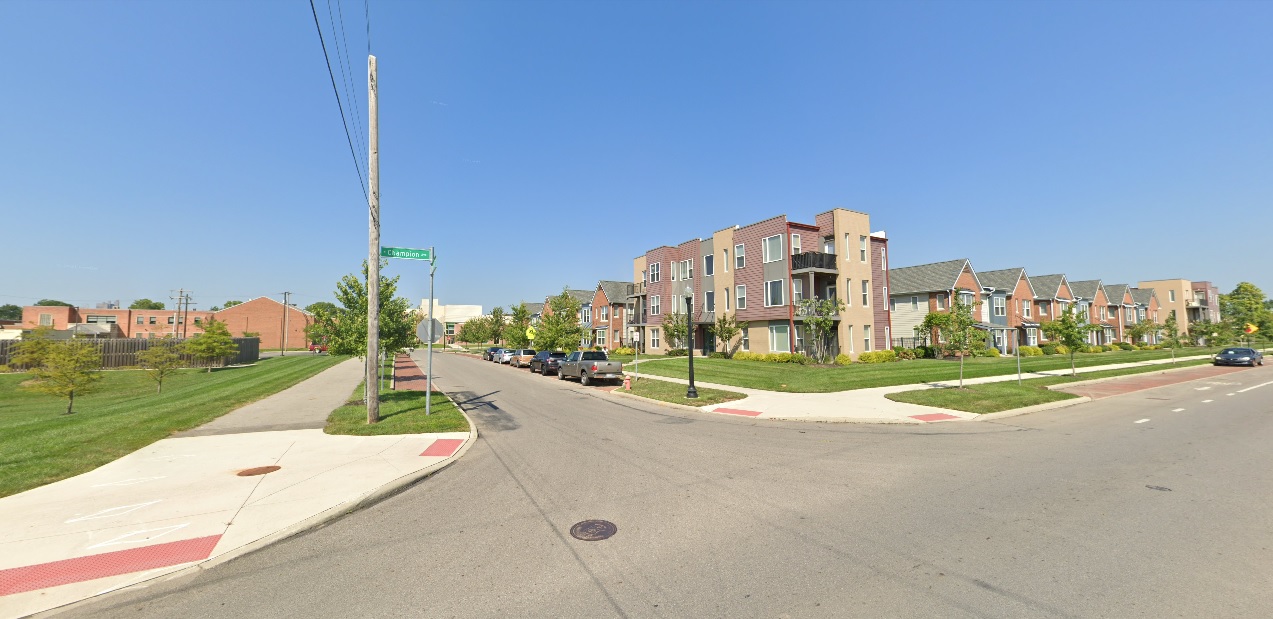
Champion Avenue, looking northwest at Phale D. Hale Drive Before: 2011 After: 2021
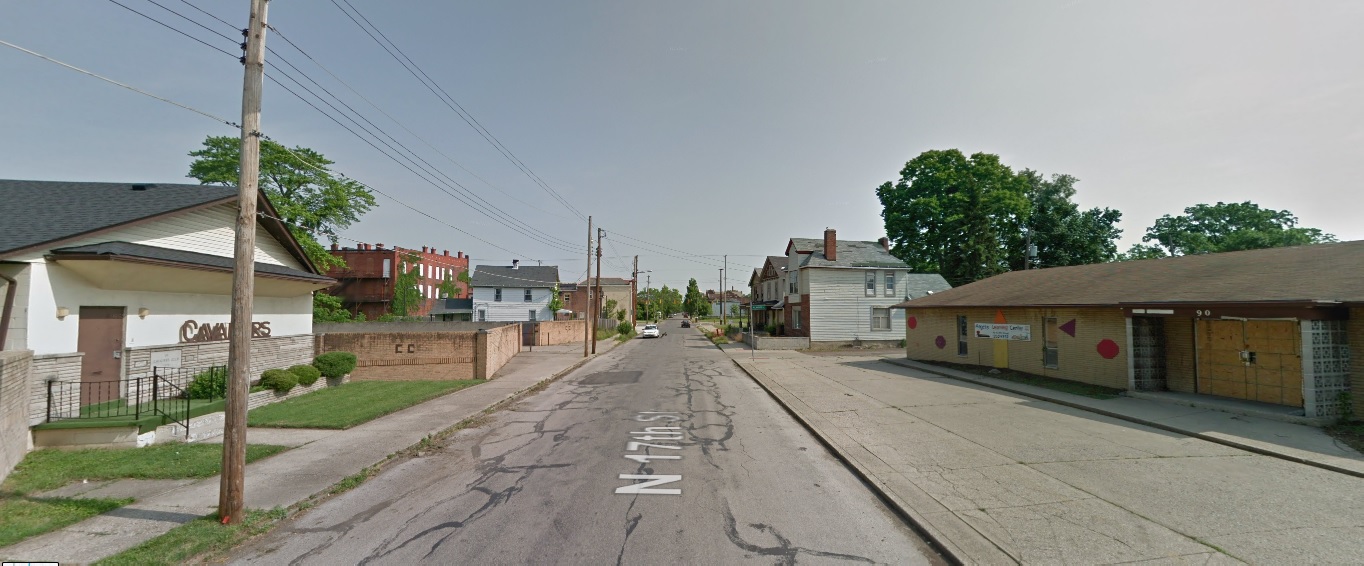
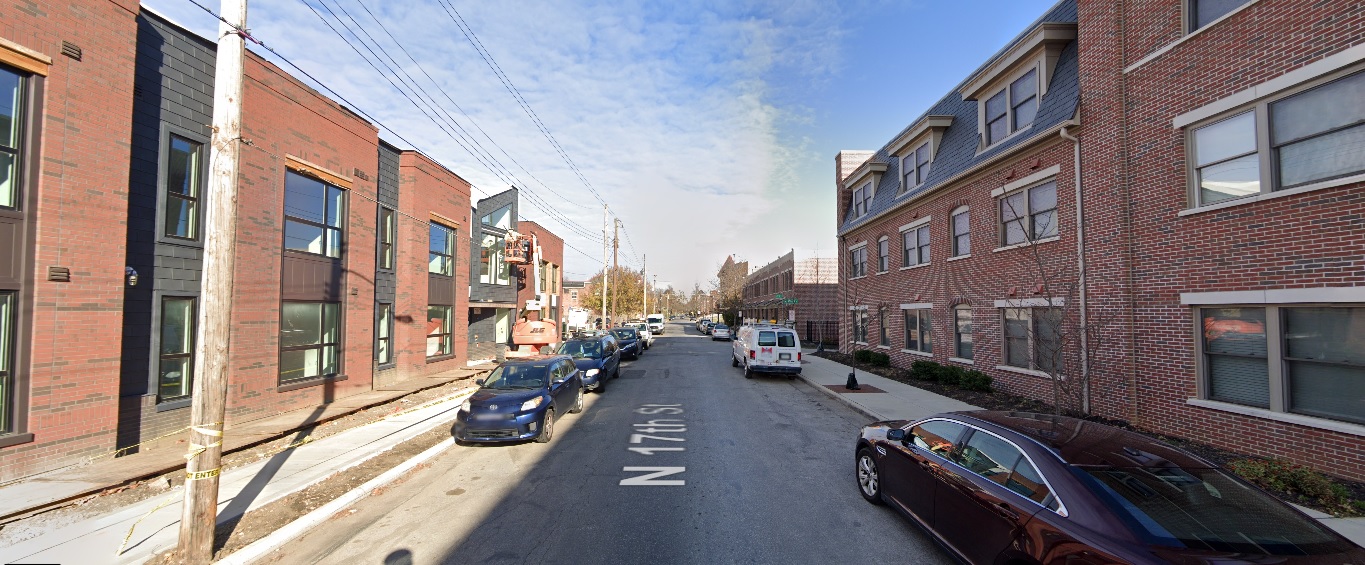
17th Avenue, looking north from Gay Street Before: 2011 After: 2020
Broad Street, looking northeast west of Woodland Avenue Before: 2011 After: 2021
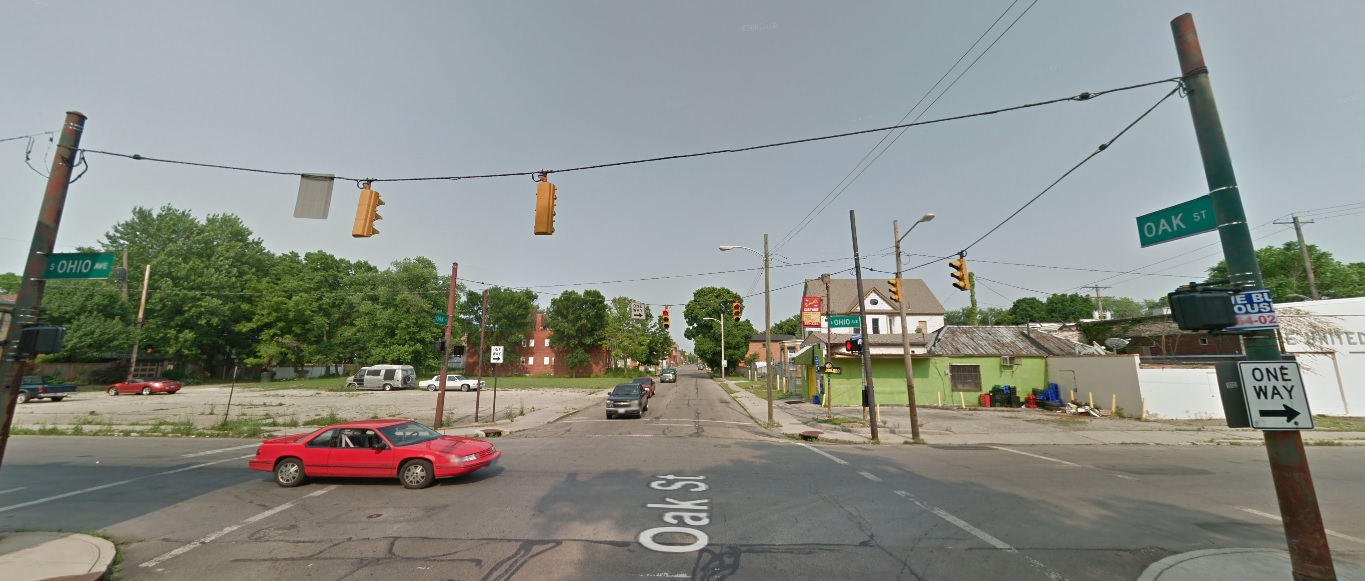
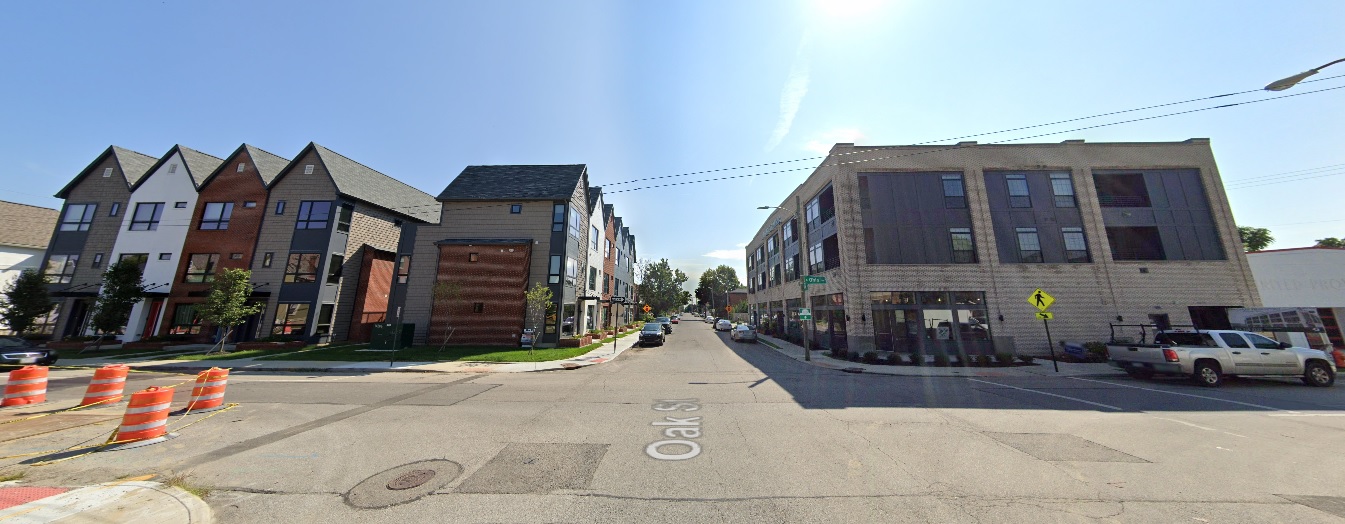
Oak Street, looking east from Ohio Avenue Before: 2011 After: 2021
These images represent just a small fraction of the development and changes that have occurred in and around the city, and don’t even include the large developments in suburban areas like Grandview Yard in Grandview or Bridge Park in Dublin. The next 10 years looks to be even more significant, with new mixed-use towers for Downtown, potential skyscrapers for Easton, and large numbers of infill development projects continuing in central neighborhoods from Franklinton to Linden to the South Side. With them, the city will continue to grow more dense and more vibrant and- with any luck- will also help spur much needed change to Columbus’ underwhelming transit system.
These Columbus development links show many of the projects seen in the photos, as well as projects that are still just in the proposal stages. The City provides a master list of area development commissions to keep track of the latest proposals.
The Columbus area housing market update January 2021 report is now available! Let’s be honest, the current housing market is extremely tough to navigate right now. This is true not so much for sellers, but rather buyers who are finding it nearly impossible to find a home they like at a good price in the neighborhood they want. There are relatively few homes available on the market, and those that are tend to get tangled in bidding wars that ultimately jack up the average sales price for the whole area.
The cause of this boils down to one critical problem- supply. There just aren’t enough existing homes to meet demand, nor are there nearly enough new homes being built. NIMBYism, local zoning and more issues are generally preventing increased home density in and around Columbus, keeping many potential homebuyers- and renters- struggling to find a place to live.
I haven’t done a breakdown of the Columbus real estate market in some time. Because of the current situation, I thought it would be a good time to take a fresh look.
The data below is from the January market report, the latest one available.
First, let’s look at those local areas that had the most homes for sale.
# of New Listings By County, January 2021 Franklin: 1,291 Delaware: 187 Licking: 157 Fairfield: 129 Union: 64 Pickaway: 47 Madison: 28 Morrow: 27 Perry: 20 Hocking: 16 Perhaps unsurprisingly, Franklin County has the most new listing by far.
Change of New Listings by County January 2020 vs. January 2021 Morrow: +8.0% Fairfield: -5.8% Licking: -6.5% Franklin: -6.6% Union: -7.2% Perry: -13.0% Madison: -20.0% Pickaway: -23.0% Delaware: -31.0% Hocking: -42.9% New listings were generally down across all but one metro county, a continuing story even before the pandemic.
Average Sales Price by County in January 2021 Delaware: $430,684 Union: $312,742 Fairfield: $265,821 Pickaway: $256,235 Franklin: $253,852 Licking: $234,116 Morrow: $232,393 Madison: $231,396 Perry: $219,053 Hocking: $208,231 All counties saw the average sale price of homes sold exceed the $200K mark, but Delaware County remains the most expensive place to buy a home in the metro.
Change in Average Sales Price by County January 2020 vs. January 2021 Perry: +53.7% Pickaway: +36.4% Fairfield: +25.9 Delaware: +23.5% Franklin: +13.4% Union: +12.0% Madison: +9.6% Licking: +9.0% Morrow: +8.9% Hocking: -7.6% All but Hocking County saw significant year-over-year sales price increases of homes sold.
Now let’s take a look at individual communities. Which ones were the hottest in January 2021?
Local Communities/Areas by New Listings in January 2021 1. Columbus (Overall): 850 2. Columbus City School District (CSD): 579 3. South-Western CSD: 173 4. Olentangy Local School District (LSD) (Delaware): 95 5. Hilliard CSD: 92 6. Westerville CSD: 86 7. Grove City: 77 8. Dublin CSD: 68 9. Pickerington LSD: 59 10. Groveport Madison LSD (Franklin): 56 11. Worthington CSD: 51 12. Gahanna Jefferson CSD: 50 13. Newark CSD: 42 14. Lancaster CSD: 41 15. Delaware CSD: 40 16. Upper Arlington CSD: 40 17. Pataskala: 37 18. Beechwold/Clintonville: 35 19. Gahanna: 35 20. Westerville: 35 21. Hilliard: 35 22. Blacklick: 34 23. Marysville School District: 33 24. Reynoldsburg CSD: 32 25. Dublin: 31 26. Teays Valley LSD (Pickaway): 30 27. Downtown Columbus: 29 28. Pickerington: 27 29. New Albany Plain LSD: 24 30. Short North: 24 31. Big Walnut LSD (Franklin): 22 32. Powell: 22 33. Canal Winchester CSD: 19 34. London CSD: 15 35. German Village: 15 36. New Albany: 14 37. Hamilton LSD (Franklin): 14 38. Buckeye Valley LSD (Delaware: 13 39. Bexley: 11 40. Worthington: 11 41. Granville CSD: 11 42. Obetz: 8 43. Johnstown-Monroe LSD (Licking): 8 44. Circleville CSD: 7 45. Grandview Heights: 7 46. Sunbury: 7 47. Whitehall: 6 48. Jonathan Alder LSD (Madison): 6 49. Jefferson LSD (Madison: 5 50. Minverva Park: 2 51. Valleyview: 1 52. Lithopolis: 0 It’s pretty clear that the number of new listings falls off dramatically outside of Columbus proper. Only a handful of suburban areas had more than 50.
Average Sales Price January 2021, # of Homes Sold and % Change vs. January 2020 1. New Albany: $788,943: 14: +8.4% 2. New Albany Plain LSD: $669,455: 20: +10.2% 3. German Village $637,550: 10: +2.3% 4. Olentangy LSD $494,911: 96: +23.0% 5. Powell: $493,087: 11: +19.2% 6. Granville CSD: $492,045: 6: +31.3% 7. Dublin: $468,902: 37: +17.5% 8. Upper Arlington CSD: $462,594: 26: -9.2% 9. Bexley: $438,288: 13: -17.6% 10. Grandview Heights: $437,010: 6: +8.5% 11. Buckeye Valley LSD: $403,616: 20: +40.9% 12. Downtown: $384,230: 22: -36.4% 13. Dublin CSD: $378,788: 78: +11.8% 14. Johnstown-Monroe LSD: $375,598: 12: +110.8% 15. Short North: $360,830: 10: -8.7% 16. Jonathan Alder LSD: $340,887: 15: +20.7% 17. Big Walnut LSD: $337,550: 14: -8.8% 18. Gahanna Jefferson CSD: $335,621: 34: +19.7% 19. Blacklick: $325,445: 32: +39.7% 20. Sunbury: $318,980: 5: +39.1% 21. Pickerington LSD: $318,093: 40: +28.6% 22. Worthington: $316,625: 8: +7.0% 23. Teays Valley LSD: $315,316: 21: +52.5% 24. Beechwold/Clintonville: $300,780: 43: +15.4% 25. Hilliard: $297,387: 25: +0.9% 26. Worthington CSD: $294,236: 40: +17.5% 27. Pickerington: $282,044: 18: +13.0% 28. Westerville: $279,126: $279,126: -0.9% 29. Hilliard CSD: $277,377: 92: +5.9% 30. Canal Winchester CSD: $276,299: 17: +21.7% 31. Grove City: $272,378: 47: +17.8% 32. Minerva Park: $269,580: 5: +21.2% 33. Westerville CSD: $265,781: 68: -3.3% 34. Obetz: $260,825: 6: +26.4% 35. Gahanna: $255,650: 16: -2.1% 36. Marysville CSD: $254,363: 32: +17.8% 37. Hamilton LSD: $245,750: 4: +85.8% 38. Delaware CSD: $245,526: 31: +21.8% 39. Pataskala: $237,293: 18: +26.8% 40. Lithopolis: $228,125: 4: -1.4% 41. South-Western CSD: $227,266: 131: +17.9% 42. Columbus: $222,124: 761: +17.0% 43. Columbus CSD: $215,256: 507: +20.2% 44. Jefferson LSD: $210,225: 4: -35.5% 45. Reynoldsburg CSD: $203,965: 34: +9.0% 46. Lancaster CSD: $203,095: 44: +37.5% 47. Groveport Madison LSD: $194,690: 43: +30.3% 48. London CSD: $190,733: 14: +43.8% 49. Circleville CSD: $183,546: 13: +5.3% 50. Whitehall: $165,361: 11: +68.6% 51. Newark CSD: $143,241: 51: +15.9% 52. Valleyview: $120,000: 1: N/A As stated above, most areas in the metro are priced above $200,000 for a house. Columbus overall is still one of the least expensive options. New Albany is really in a league all its own. It should be noted that many of these average price figures are based on relatively few sales. Because available inventory is so low, the average sales price is being pushed higher. However, it is certainly possible to find homes lower- and in some cases, much lower- than the average price. This is especially true in Columbus.
Finally, let’s look at how long for-sale homes actually stay on the market.
Average # of Days Listings Remain on the Market Until Sale, and % Change January 2020 to January 2021 1. Valleyview: 1: N/A No sales occurred in January 2020. 2. Gahanna: 9: -74.3% 3. Groveport Madison LSD: 9: -69.0% 4. Hamilton LSD: 9: -50.0% 5. Worthington: 9: -72.7% 6. Reynoldsburg CSD: 10: -68.8% 7. Obetz: 12: -71.4% 8. Hilliard: 13: -61.8% 9. Worthington CSD: 13: -56.7% 10. Circleville CSD: 14: -76.3% 11. Lithopolis: 14: -61.1% 12. Marysville CSD: 14: -63.2% 13. Minerva Park: 14: +133.3% 14. Pataskala: 14: -46.2% 15. New Albany: 15: -88.9% 16. New Albany Plain LSD: 15: -83.9% 17. Pickerington: 15: -71.7% 18. South-Western CSD: 15: -34.8% 19. Teays Valley LSD: 15: -58.3% 20. Canal Winchester CSD: 17: -73.0% 21. Whitehall: 17: -46.9% 22. Hilliard CSD: 18: -48.6% 23. Lancaster CSD: 18: -52.6% 24. Westerville CSD: 18: -47.1% 25. Delaware CSD: 19: -51.3% 26. Grove City: 19: -36.7% 27. Beechwold/Clintonville: 20: -53.5% 28. Columbus: 21: -30.0% 29. Westerville: 21: -27.6% 30. Newark CSD: 22: -31.3% 31. Pickerington LSD: 22: -45.0% 32. Dublin: 26: -55.9% 33. Buckeye Valley LSD: 27: -44.9% 34. Columbus CSD: 27: -18.2% 35. Dublin CSD: 27: -41.3% 36. Jefferson LSD: 27: -46.0% 37. London CSD: 27: -32.5% 38. Blacklick: 28: -12.5% 39. Grandview Heights: 28: -37.8% 40. Gahanna Jefferson CSD: 29: -23.7% 41. Johnstown Monroe LSD: 29: -12.1% 42. Sunbury: 29: +222.2% 43. Jonathan Alder LSD: 35: -10.3% 44. Short North: 35: -47.8% 45. Big Walnut LSD: 37: -54.3% 46. Bexley: 44: -18.5% 47. Upper Arlington CSD: 46: -17.9% 48. Olentangy LSD: 49: -16.9% 49. Powell: 52: -8.8% 50. Granville CSD: 54: -15.6% 51. German Village: 56: -38.5% 52. Downtown: 96: +242.9% Only 2 places in the metro saw an increase, with the big one being Downtown. This was most likely due to a few factors- last year’s protests and the pandemic reducing demand close to Downtown jobs. I would expect it to recover somewhat this year and certainly next year. Overall, though, most places saw significant drops in how long homes lasted on the market. Given that these are averages, we know that there were plenty of instances of homes flying off the market in just a few days.
Furthermore, the actual inventory on the market is 30 days or less. This means that if no more homes became available for sale, all the homes on the market would sell out in less than a month. In many cases, the supply would run out in just a few weeks.
Certainly, all these numbers indicate that Columbus itself is still one of the best options for home buying given its lower costs and greater supply, but even there, homes are selling in just a few weeks on average. There’s really been no better time to sell in a long time, but also no worse time to buy. Hopefully, this data provides at least a little insight into the local market and where one might fight the greatest advantages in finding a home. My recommendation is to use every available resource- from realtors to social media- to aid in the search.
This Columbus housing market update for March 2013 includes an expansion of data, specifically the time it takes for homes to sell on the current market.
Note: LSD= Local School District, CSD= City School District. In both cases, school district boundaries differ from city boundaries.
Top 15 Most Expensive Locations By Median Sales Price in March 2013 1. New Albany: $471,000 2. Dublin: $330,000 3. Powell: $317,000 4. New Albany Plain LSD: $316,000 5. Upper Arlington CSD: $302,450 6. Olentangy LSD: $291,250 7. Granville CSD: $282,050 8. Downtown: $269,000 9. German Village: $267,250 10. Dublin CSD: $266,500 11. Hilliard: $250,000 12. Big Walnut LSD: $245,000 13. Buckeye Valley LSD: $243,000 14. Johnstown Monroe LSD: $207,250 15. Bexley: $205,000
Top 15 Least Expensive Locations by Median Sales Price in March 2013 1. Whitehall: $45,250 2. Obetz: $56,450 3. Groveport Madison LSD: $63,625 4. Hamilton LSD: $66,750 5. Columbus CSD: $85,000 6. Lancaster CSD: $89,550 7. Newark CSD: $89,900 8. South-Western CSD: $100,000 9. Columbus: $103,250 10. Sunbury: $106,900 11. Reynoldsburg CSD: $115,000 12. Jefferson LSD: $122,000 13. Blacklick: $123,500 14. London CSD: $128,000 15. Grandview Heights: $136,000
Whitehall was the cheapest market yet again, though its median prices have been going up slowly.
Overall Market Median Sales Price in March 2013: $139,028
Top 15 Locations with the Highest Median Sales Price % Growth Between March 2012 and March 2013 1. Minerva Park: +223.8% 2. Jonathan Alder LSD: +99.0% 3. Circleville CSD: +63.3% 4. Buckeye Valley LSD: +59.3% 5. Johnstown Monroe LSD: +53.5% 6. Reynoldsburg CSD: +47.4% 7. Hilliard: +47.1% 8. Downtown: +34.6% 9. Big Walnut LSD: +31.5% 10. Westerville CSD: +28.3% 11. Powell: +28.1% 12. Gahanna: +22.0% 13. Olentangy LSD: +18.4% 14. Marysville CSd: +14.8% 15. Worthington: +13.9%
Downtown continued to do well, but otherwise few places inside 270 did.
Top 15 Locations with the Lowest Median Sales Price % Growth Between March 2012 and March 2013 1. Grandview Heights: -43.7% 2. Sunbury: -42.6% 3. Obetz: -29.3% 4. Whitehall: -24.3% 5. Bexley: -21.1% 6. Lithopolis: -20.1% 7. Hamilton LSD: -15.8% 8. Blacklick: -12.0% 9. Pataskala: -9.2% 10. Delaware CSD: -5.3% 11. Gahanna Jefferson CSD: -5.1% 12. Beechwold/Clintonville: -4.1% 13. South-Western CSD: -2.9% 14. London CSD: -1.9% 15. Columbus CSD: -1.0%
Overall Market Median Sales Price % Change March 2012 vs. March 2013: +9.9%
Top 10 Locations with the Most New Listings in March 2013 1. Columbus: 1,309 2. Columbus CSD: 811 3. South-Western CSD: 221 4. Olentangy LSD: 197 5. Hilliard CSD: 195 6. Westerville CSD: 185 7. Dublin CSD: 140 8. Pickerington LSD: 100 9. Worthington CSD: 97 10. Dublin: 93
Top 10 Locations with the Fewest New Listings in March 2013 1. Valleyview: 1 2. Lithopolis: 2 3. Minerva Park: 4 4. Jefferson LSD: 6 5. Johnstown Monroe LSD: 8 6. Jonathan Alder LSD: 9 7. Obetz: 10 8. Hamilton LSD: 13 9. Grandview Heights: 14 10. Sunbury: 17 11. Circleville CSD: 17
Total New Listings in the Columbus Metro in March 2013: 3,222 Overall Metro New Listings % Change March 2012-March 2013: +0.2%
Prices were up almost 10% year over year for the month despite a small increase in overall supply.
Top 10 Fastest-Selling Locations by # of Days Homes Remain on the Market Before Sale in March 2013 1. Minerva Park: 3 2. Worthington: 29 3. Granville CSD: 35 4. Jonathan Alder LSD: 36 5. Upper Arlington CSD: 51 6. Downtown: 54 7. Pickerington: 54 8. Pickerington LSD: 60 9. Dublin CSD: 61 10. Grandview Heights: 63 11. Groveport Madison LSD: 63 12. Reynoldsburg CSD: 63 13. South-Western CSD: 63 14. Grove City: 65 15. Powell: 65
Top 10 Slowest-Selling Locations by # of Days Homes Remain on the Market Before Sale in March 2013 1. Bexley: 188 2. Circleville CSD: 168 3. Sunbury: 163 4. Lancaster CSD: 140 5. Big Walnut LSD: 129 6. Hilliard: 125 7. Lithopolis: 121 8. Newark CSD: 120 9. Obetz: 119 10. Gahanna: 117
The Columbus Realtors provides market condition reports going back many years.