The 2022 final housing market update looks at the overall market performance for the year versus 2021.
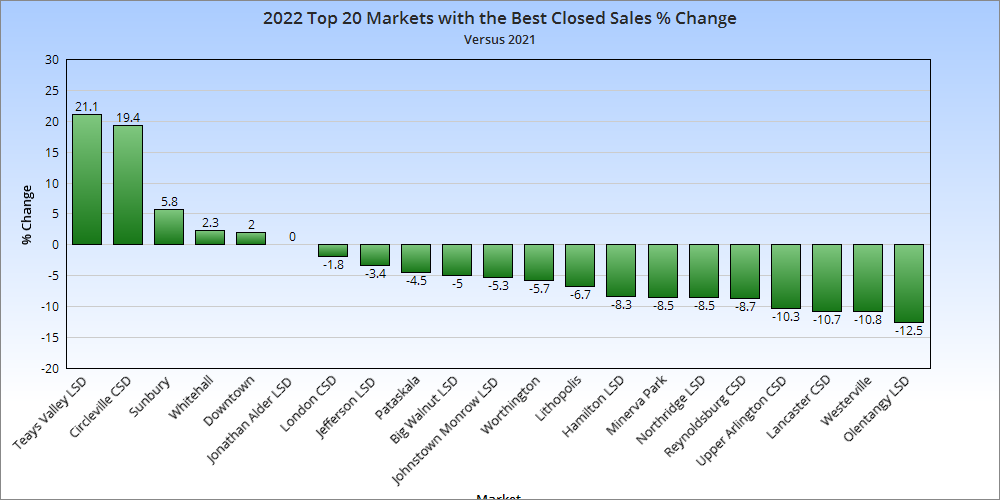
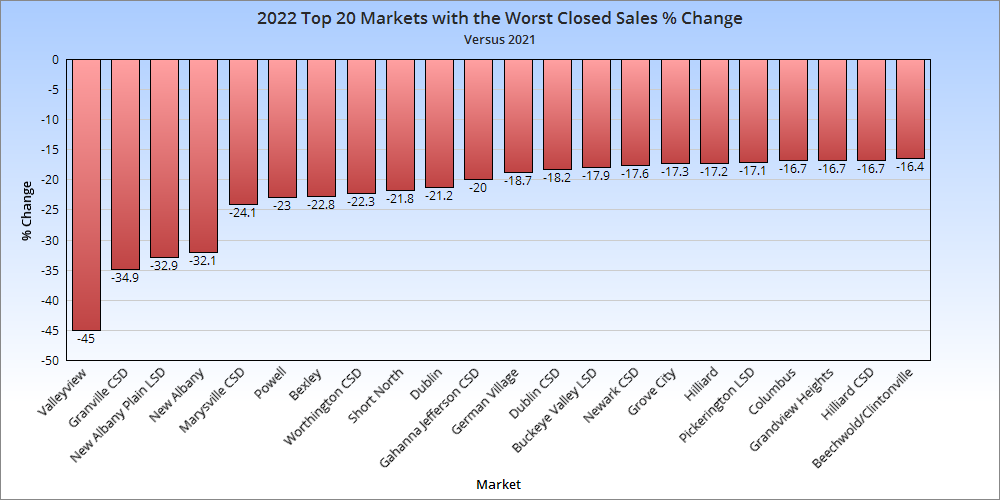
Note: LSD= Local School District, CSD= City School District. In both cases, school district boundaries differ from city boundaries.
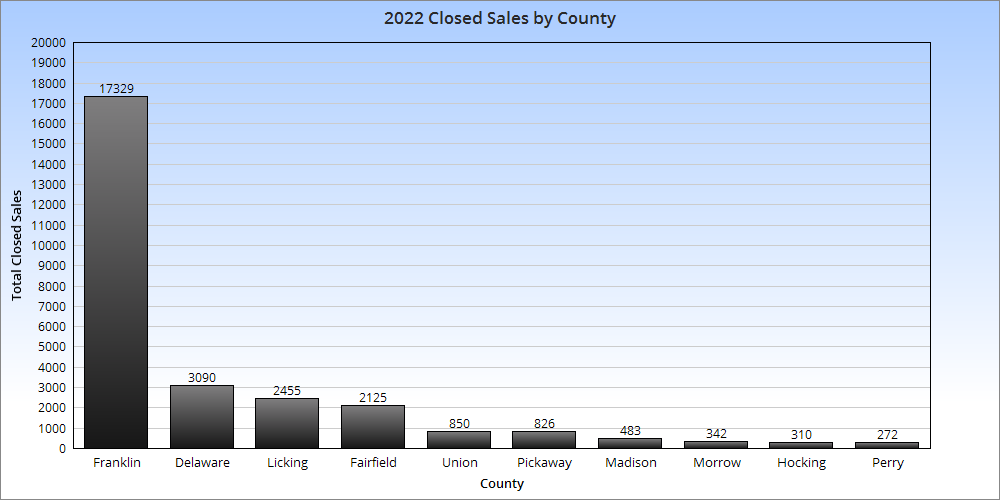
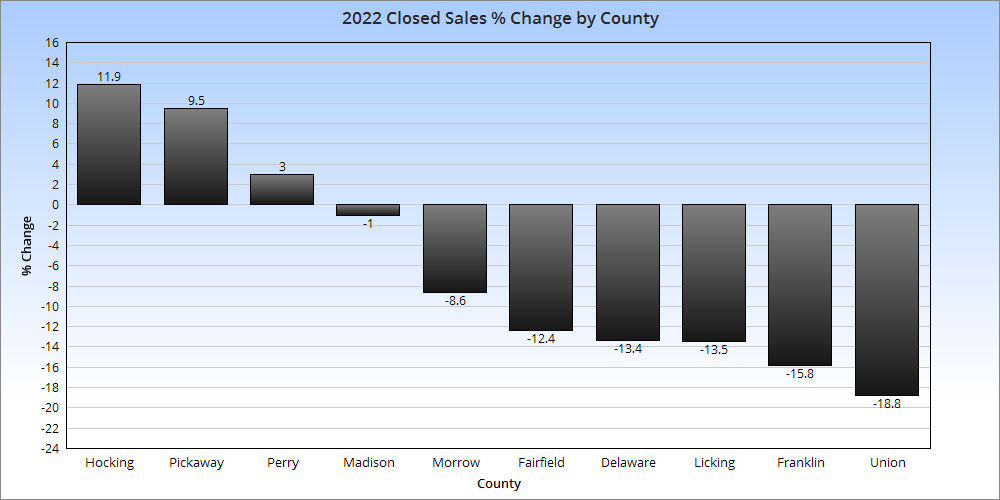
Closed sales are those sales that were completed during the year. 7 of the 10 metro counties saw declines vs. 2021.
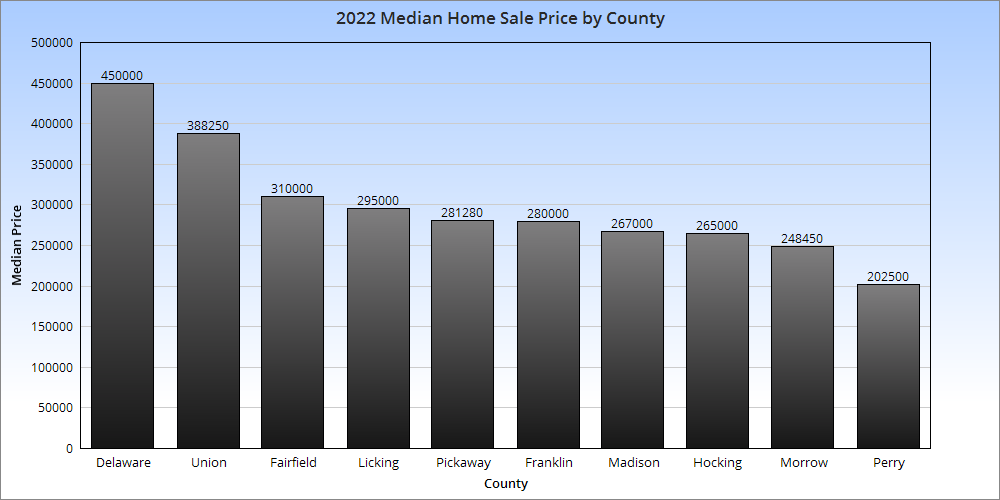
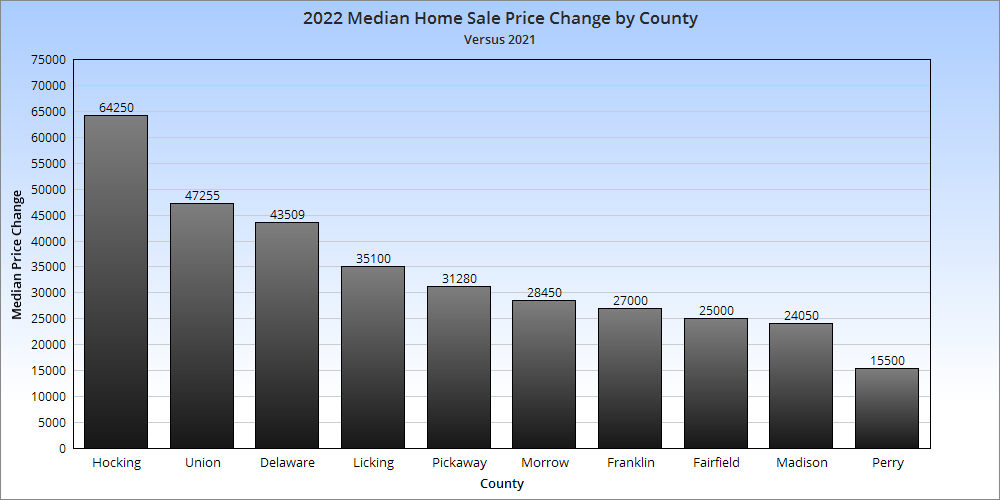
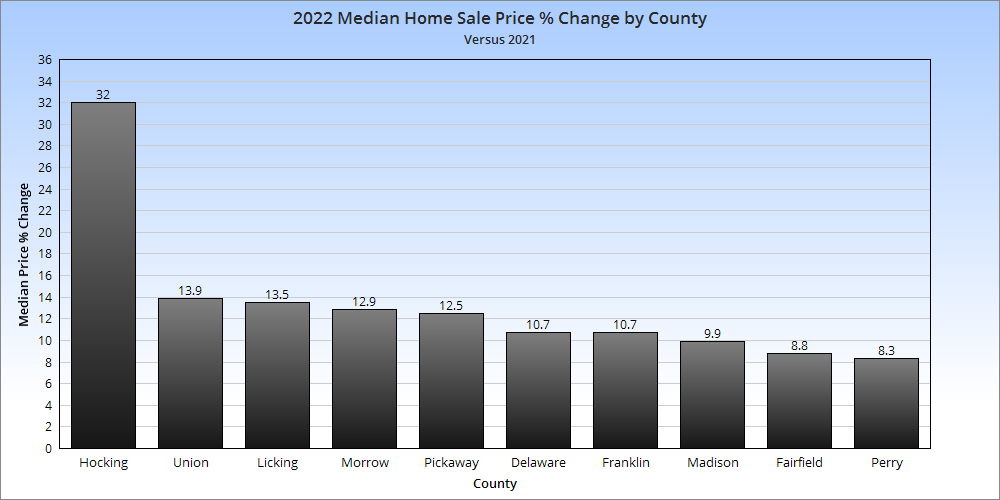
Overall Market Median Sales Price in 2022: $298,748 Based on the 10 Columbus Metro Area counties, the median price increased by $34,139 over 2021. Overall Market Median Sales Price % Change in 2022 versus 2021: +12.9%
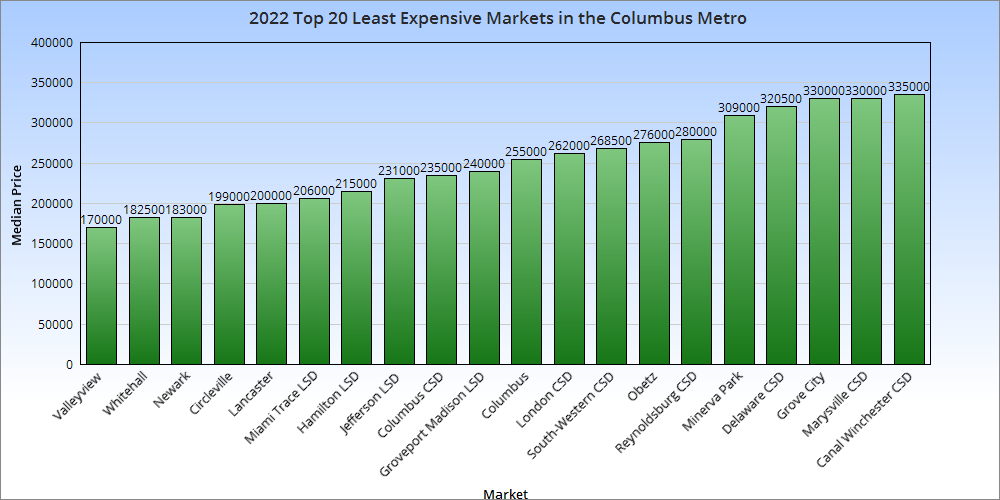
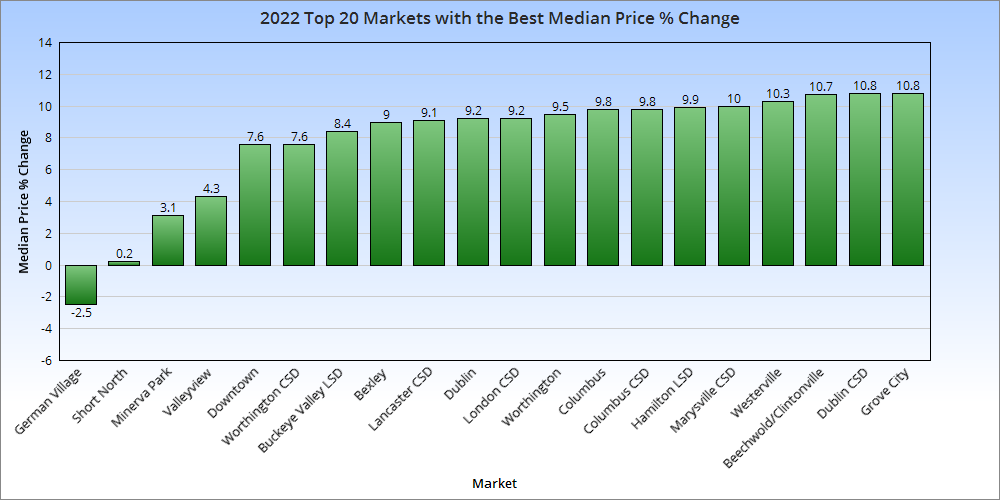
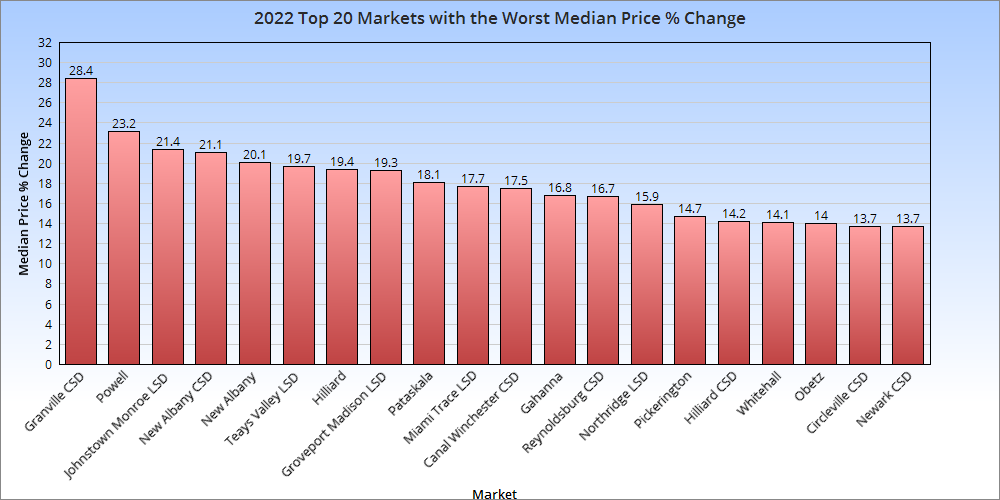
Best in the case of market median price % change is subjective. For buyers, it would be prices that have increased the least or even declined, while for sellers it would be the largest increases.
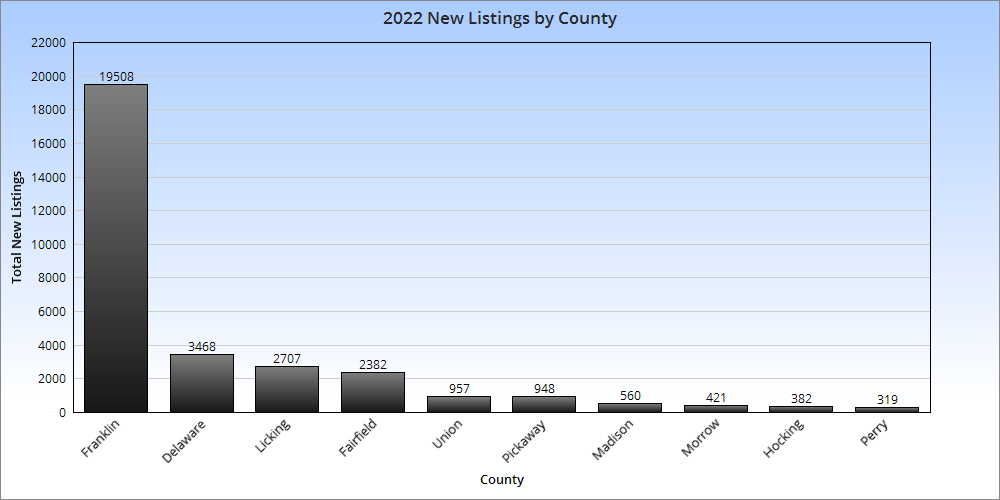
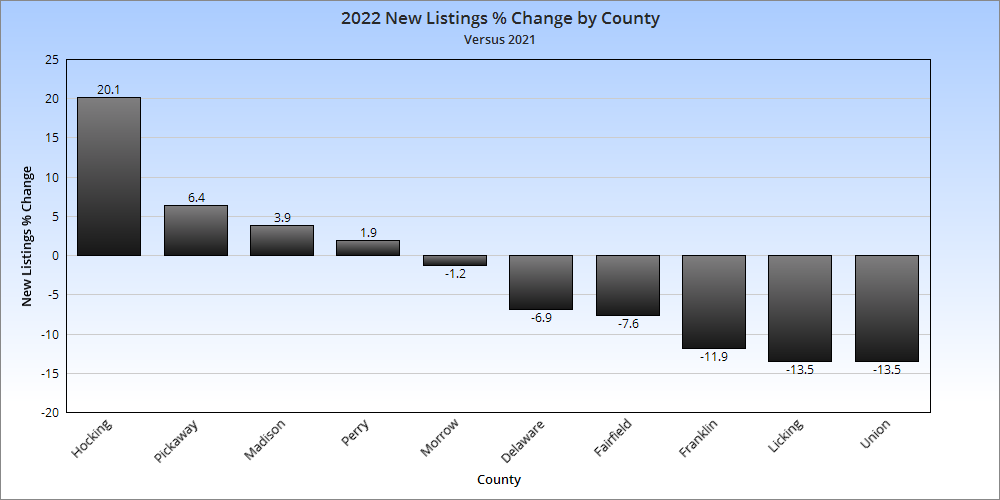
Total Metro New Listings in 2022: 31,652 Total Metro New Listings Change from 2021 to 2022: -3,508 Thousands of fewer homes going to market helped keep prices rising across the metro despite a significant slowdown in overall sales.
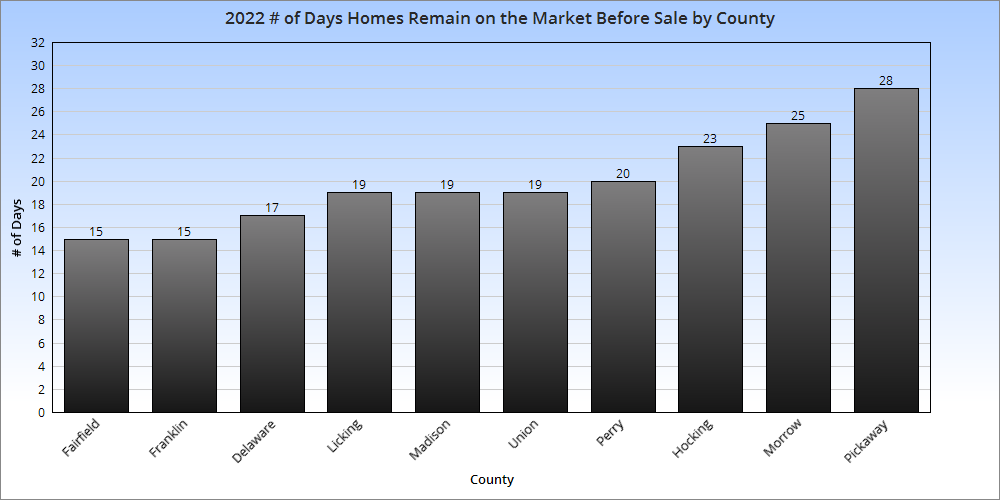
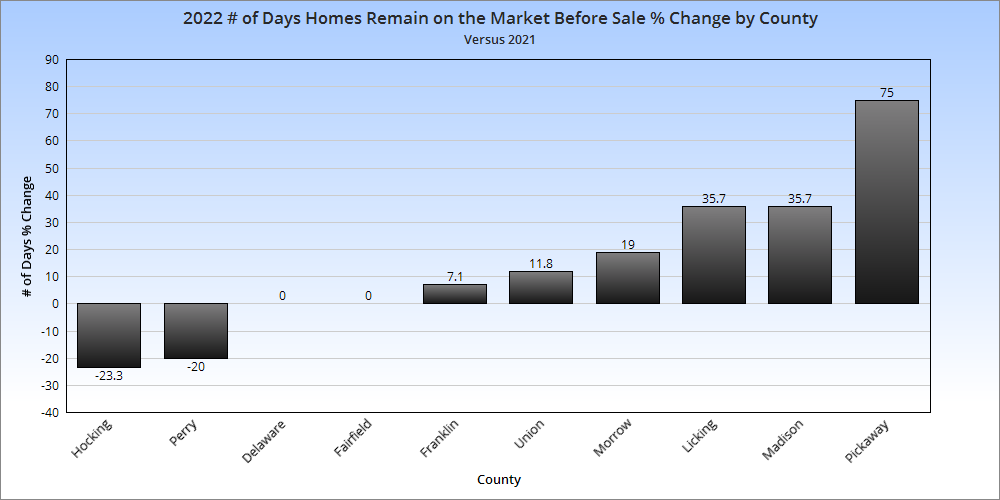
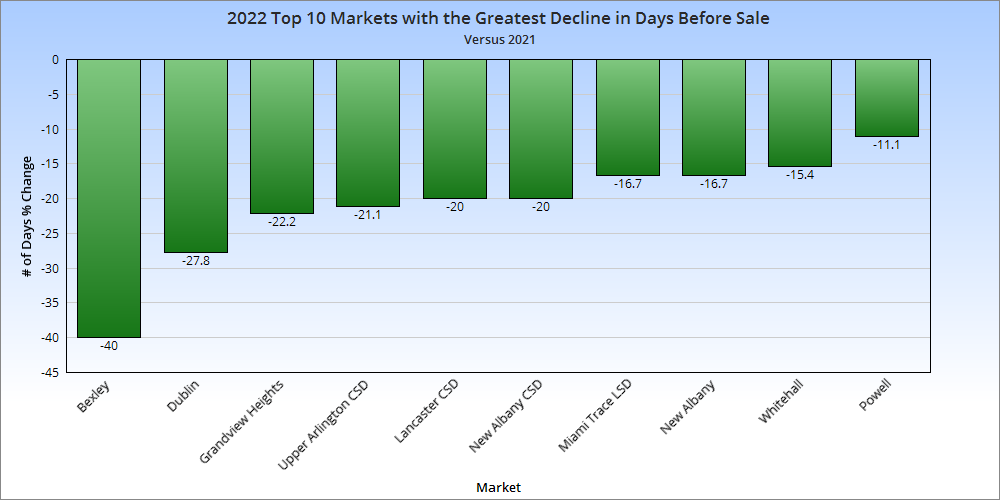
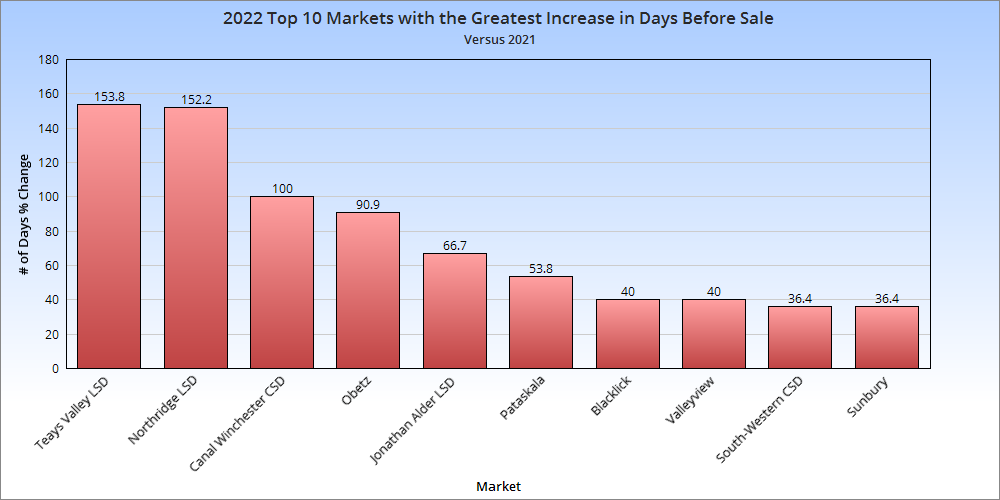
Average # of Days Homes Remain on the Market Before Sale for the Metro Overall in 2022: 20.0 # of Days Homes Remain on the Market Before Sale % Change for the Metro 2021 vs. 2022: +9.3%
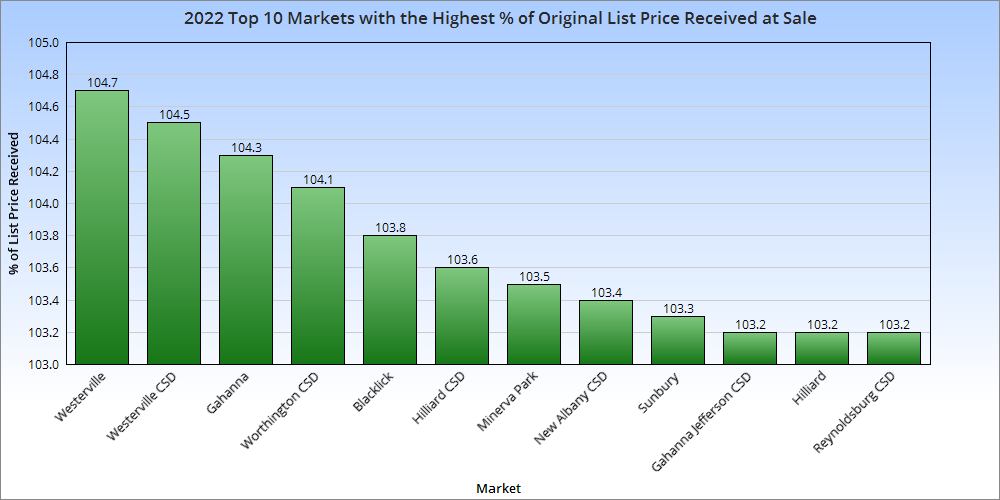
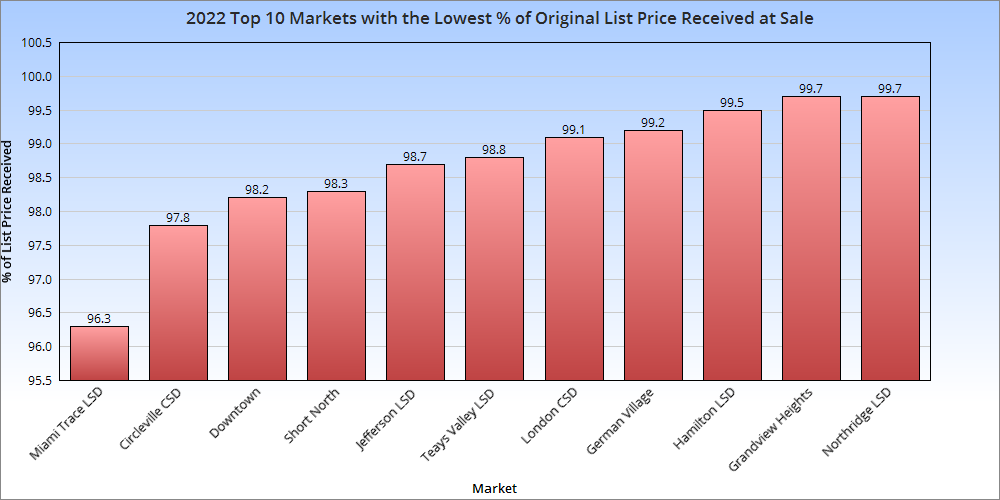
This new data shows whether a market was receiving more or less than the original list price for the homes for sale. Those above 100% were markets that typically had buyer competition to the point where they had to pay more than list. Those below 100% were the opposite, where relatively lower demand allowed some buyers to get a home for under list.
And there you have it, the final housing market update for 2022!
The latest numbers for the Columbus housing market from Columbus Realtors.
LSD=Local school district CSD=City school district
Top 15 Most Expensive Locations by Median Sales Price in October 2013 1. New Albany: $445,900 2. Upper Arlington CSD: $358,000 3. Downtown: $330,000 4. Powell: $305,000 5. Dublin: $302,125 6. Jefferson LSD: $292,500 7. Olentangy LSD: $288,500 8. Granville CSD: $272,000 9. New Albany Plain LSD: $262,500 10. Worthington: $249,900 11. Buckeye Valley LSD: $246,250 12. Big Walnut LSD: $238,500 13. Beechwold/Clintonville: $230,000 14. Bexley: $225,875 15. German Village: $217,500
Top 15 Least Expensive Locations by Median Sales Price in October 2013 1. Whitehall: $42,500 2. Lancaster CSD: $75,250 3. Hamilton LSD: $83,450 4. Columbus CSD: $84,200 5. Newark CSD: $87,450 6. Groveport Madison LSD: $90,150 7. London CSD: $94,500 8. South-Western CSD: $95,000 9. Columbus: $104,500 10. Circleville CSD: $110,250 11. Blacklick: $134,251 12. Obetz: $134,950 13. Canal Winchester CSD: $135,000 14. Grove City: $135,000 15. Reynoldsburg CSD: $136,200
Overall Metro Median Sales Price in October 2013: $149,302 Median Sales Price Change October 2012-October 2013: -$3,183
Top 15 Locations with the Highest Median Sales Price % Growth Between October 2012-October 2013 1. Hamilton LSD: +85.4% 2. Jefferson LSD: +69.8% 3. Downtown: +63.8% 4. Reynoldsburg CSD: +54.4% 5. Obetz: +51.8% 6. Jonathan Alder LSD: +50.4% 7. Sunbury: +36.5% 8. Beechwold/Clintonville: +28.6% 9. Westerville CSD: +20.2% 10. Minerva Park: +19.4% 11. Marysville CSD: +19.4% 12. Lithopolis: +19.0% 13. Northridge LSD: +17.4% 14. Circleville CSD: +16.7% 15. Granville CSD: +15.6%
Top 15 Locations with the Lowest Median Sales Price % Growth Between October 2012-October 2013 1. German Village: -16.3% 2. Lancaster CSD: -16.3% 4. Buckeye Valley LSD: -14.9% 5. New Albany Plain LSD: -14.6% 6. Canal Winchester CSD: -14.6% 7. Grandview Heights: -14.2% 8. Hilliard: -12.8% 9. South-Western CSD: -11.4% 10. London CSD: -11.3% 11. Dublin CSD: -10.8% 12. Dublin: -10.3% 13. Whitehall: -7.6% 14. Gahanna Jefferson CSD: -5.6% 15. Johnstown Monroe LSD: -3.7%
Overall Metro Median Price % Change October 2012-October 2013: -2.1%
Top 10 Locations with the Most New Listings in October 2013 1. Columbus: 1,107 2. Columbus CSD: 691 3. Westerville CSD: 177 4. South-Western CSD: 169 5. Hilliard CSD: 158 6. Olentangy LSD: 157 7. Dublin CSD: 123 8. Groveport Madison LSD: 91 9. Worthington CSD: 79 10. Dublin: 73
Top 10 Locations with the Fewest New Listings in October 2013 1. Valleyview: 0 2. Lithopolis: 0 3. Minerva Park: 2 4. Jefferson LSD: 5 5. Obetz: 5 6. Sunbury: 5 7. Northridge LSD: 9 8. Jonathan Alder LSD: 9 9. German Village: 9 10. Grandview Heights: 10
Overall Metro New Listings in October 2013: 2,693 New Listings % Change October 2012-October 2013: +5.9%
Top 10 Fastest-Selling Locations by # of Days Homes Remain on the Market Before Sale in October 2013 1. Johnstown Monroe LSD: 30 2. Powell: 31 3. Buckeye Valley LSD: 32 4. Grandview Heights: 39 5. Minerva Park: 42 6. Beechwold/Clintonville: 45 7. Northridge LSD: 45 8. Olentangy LSD: 46 9. Westerville: 46 10. Jonathan Alder LSD: 47
Top 10 Slowest-Selling Locations by # of Days Homes Remain on the Market Before Sale in March 2013 1. Circleville CSD: 118 2. London CSD: 107 3. Lancaster CSD: 106 4. Obetz: 105 5. Hamilton LSD: 96 6. New Albany CSD: 91 7. Granville CSD: 84 8. Jefferson LSD: 82 9. Big Walnut LSD: 81 10. Hilliard: 78 11. Reynoldsburg: CSD: 78
Overall Metro Average # of Days on Market Before Sale: 74.7
Top 10 Locations with the Best Change in # of Days on the Market Before Sale October 2012-October 2013 1. Lithopolis: +522.2% 2. Minerva Park: -77.25 3. Johnstown Monroe LSD: -74.6% 4. Buckeye Valley LSD: -71.7% 5. Jonathan Alder LSD: -69.1% 6. Grandview Heights: -64.2% 7. Powell: -62.7% 8. German Village: -61.2% 9. Northridge LSD: -54.5% 10. Pickerington LSD: -47.0%
Top 10 Locations with the Worst Change in the # of Days on the Market Before Sale October 2012-October 2013 1. Hamilton LSD: +190.9% 2. Obetz: +150.0% 3. Lancaster CSD: +86.0% 4. Sunbury: +50.0% 5. Circleville CSD: +45.7% 6. London CSD: +27.4% 7. New Albany: +14.6% 8. Worthington: +13.7% 9. Granville CSD: +9.1% 10. New Albany CSD: +8.3%
Overall Metro # of Days on Market Before Sale % Change October 2012-October 2013: -24.9%
This Columbus housing market update for March 2013 includes an expansion of data, specifically the time it takes for homes to sell on the current market.
Note: LSD= Local School District, CSD= City School District. In both cases, school district boundaries differ from city boundaries.
Top 15 Most Expensive Locations By Median Sales Price in March 2013 1. New Albany: $471,000 2. Dublin: $330,000 3. Powell: $317,000 4. New Albany Plain LSD: $316,000 5. Upper Arlington CSD: $302,450 6. Olentangy LSD: $291,250 7. Granville CSD: $282,050 8. Downtown: $269,000 9. German Village: $267,250 10. Dublin CSD: $266,500 11. Hilliard: $250,000 12. Big Walnut LSD: $245,000 13. Buckeye Valley LSD: $243,000 14. Johnstown Monroe LSD: $207,250 15. Bexley: $205,000
Top 15 Least Expensive Locations by Median Sales Price in March 2013 1. Whitehall: $45,250 2. Obetz: $56,450 3. Groveport Madison LSD: $63,625 4. Hamilton LSD: $66,750 5. Columbus CSD: $85,000 6. Lancaster CSD: $89,550 7. Newark CSD: $89,900 8. South-Western CSD: $100,000 9. Columbus: $103,250 10. Sunbury: $106,900 11. Reynoldsburg CSD: $115,000 12. Jefferson LSD: $122,000 13. Blacklick: $123,500 14. London CSD: $128,000 15. Grandview Heights: $136,000
Whitehall was the cheapest market yet again, though its median prices have been going up slowly.
Overall Market Median Sales Price in March 2013: $139,028
Top 15 Locations with the Highest Median Sales Price % Growth Between March 2012 and March 2013 1. Minerva Park: +223.8% 2. Jonathan Alder LSD: +99.0% 3. Circleville CSD: +63.3% 4. Buckeye Valley LSD: +59.3% 5. Johnstown Monroe LSD: +53.5% 6. Reynoldsburg CSD: +47.4% 7. Hilliard: +47.1% 8. Downtown: +34.6% 9. Big Walnut LSD: +31.5% 10. Westerville CSD: +28.3% 11. Powell: +28.1% 12. Gahanna: +22.0% 13. Olentangy LSD: +18.4% 14. Marysville CSd: +14.8% 15. Worthington: +13.9%
Downtown continued to do well, but otherwise few places inside 270 did.
Top 15 Locations with the Lowest Median Sales Price % Growth Between March 2012 and March 2013 1. Grandview Heights: -43.7% 2. Sunbury: -42.6% 3. Obetz: -29.3% 4. Whitehall: -24.3% 5. Bexley: -21.1% 6. Lithopolis: -20.1% 7. Hamilton LSD: -15.8% 8. Blacklick: -12.0% 9. Pataskala: -9.2% 10. Delaware CSD: -5.3% 11. Gahanna Jefferson CSD: -5.1% 12. Beechwold/Clintonville: -4.1% 13. South-Western CSD: -2.9% 14. London CSD: -1.9% 15. Columbus CSD: -1.0%
Overall Market Median Sales Price % Change March 2012 vs. March 2013: +9.9%
Top 10 Locations with the Most New Listings in March 2013 1. Columbus: 1,309 2. Columbus CSD: 811 3. South-Western CSD: 221 4. Olentangy LSD: 197 5. Hilliard CSD: 195 6. Westerville CSD: 185 7. Dublin CSD: 140 8. Pickerington LSD: 100 9. Worthington CSD: 97 10. Dublin: 93
Top 10 Locations with the Fewest New Listings in March 2013 1. Valleyview: 1 2. Lithopolis: 2 3. Minerva Park: 4 4. Jefferson LSD: 6 5. Johnstown Monroe LSD: 8 6. Jonathan Alder LSD: 9 7. Obetz: 10 8. Hamilton LSD: 13 9. Grandview Heights: 14 10. Sunbury: 17 11. Circleville CSD: 17
Total New Listings in the Columbus Metro in March 2013: 3,222 Overall Metro New Listings % Change March 2012-March 2013: +0.2%
Prices were up almost 10% year over year for the month despite a small increase in overall supply.
Top 10 Fastest-Selling Locations by # of Days Homes Remain on the Market Before Sale in March 2013 1. Minerva Park: 3 2. Worthington: 29 3. Granville CSD: 35 4. Jonathan Alder LSD: 36 5. Upper Arlington CSD: 51 6. Downtown: 54 7. Pickerington: 54 8. Pickerington LSD: 60 9. Dublin CSD: 61 10. Grandview Heights: 63 11. Groveport Madison LSD: 63 12. Reynoldsburg CSD: 63 13. South-Western CSD: 63 14. Grove City: 65 15. Powell: 65
Top 10 Slowest-Selling Locations by # of Days Homes Remain on the Market Before Sale in March 2013 1. Bexley: 188 2. Circleville CSD: 168 3. Sunbury: 163 4. Lancaster CSD: 140 5. Big Walnut LSD: 129 6. Hilliard: 125 7. Lithopolis: 121 8. Newark CSD: 120 9. Obetz: 119 10. Gahanna: 117
The Columbus Realtors provides market condition reports going back many years.