For this update, I’m going to do things a bit differently. In previous updates, I have done long ranking lists and it got to be a bit overwhelming. So starting with this update, I’m going to do more charts instead.
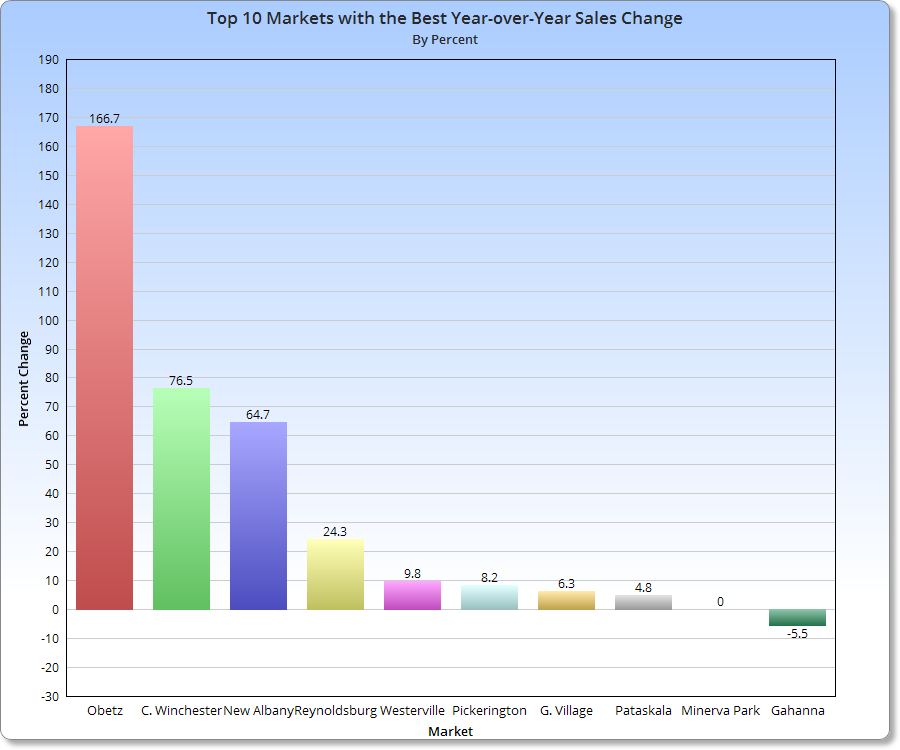
In any case, August continued the year-long trend of home sales being down, with the month coming in at more than 11% off from the same time last year. Prices, however, were up more than 6% to reach a monthly record. There continues to be a supply problem, which is the main mechanism driving both lower sales and higher prices.
December ended a 2-month decline in home sales for the area, with overall sales up 2.5% according to the Housing Market Update December 2013 data from Columbus Realtors.
Here are the stats for the 21 major areas of Franklin County that I look at housing stats for.
Top 10 December 2013 Sales Increases over December 2012 1. Minerva Park: +200.0% 2. Obetz: +200.0% 3. Reynoldsburg: +72.7% 4. Clintonville: +55.6% 5. Gahanna: +55.0% 6. Pataskala: +27.3% 7. Dublin: +15.4% 8. German Village: +10.0% 9. Worthington: +6.3% 10. Columbus: +3.8%
Top 10 Year-to-Date Sales Through December 2013 1. Columbus: 10,267 2. Dublin: 797 3. Upper Arlington: 719 4. Clintonville: 701 5. Westerville: 630 6. Grove City: 609 7. Hilliard: 556 8. Gahanna: 526 9. Reynoldsburg: 505 10. Pickerington: 312
Top 10 Year-to-Date Increases Through December 2013 Over 2012 1. Minerva Park: +51.9% 2. Gahanna: +31.8% 3. Pataskala: +31.0% 4. Reynoldsburg: +30.8% 5. Whitehall: +27.3% 6. Clintonville: +26.3% 7. Hilliard: +23.6% 8. Whitehall: +23.4% 9. Westerville: +21.9% 10. Bexley: +21.5%
Average Sales December 2013 Urban: 74.5 Suburban: 28.2 Urban without Columbus: 14.7
Average % Change December 2013 vs. December 2012 Urban: +40.5% Suburban: +6.4% Urban without Columbus: +44.2%
Average YTD Sales Through December 2013 Urban: 1,177.1 Suburban: 466.5 Urban without Columbus: 268.1
Average YTD % Change YTD Through December 2013 Urban: +15.7% Suburban: +19.4% Urban without Columbus: +15.3%
Top 10 Average Sales Price December 2013 1. New Albany: $563,187 2. Upper Arlington: $377,943 3. Bexley: $376,592 4. Dublin: $351,279 5. Downtown: $314,583 6. German Village: $303,136 7. German Village: $271,656 8. Hilliard: $249,811 9. Worthington: $232,741 10. Clintonville: $223,250
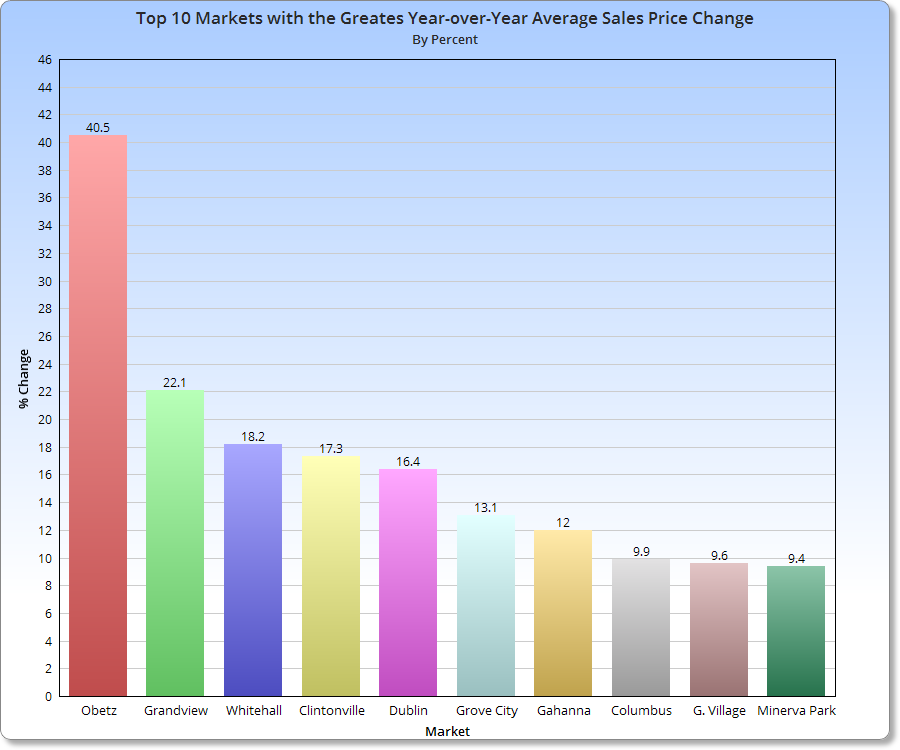
Top 10 Average Sales Price % Change December 2013 Over December 2012 1. Whitehall: +37.3% 2. New Albany: +32.8% 3. Pataskala: +29.6% 4. Reynoldsburg: +26.3% 5. Upper Arlington: +25.8% 6. Clintonville: +25.3% 7. Bexley: +23.7% 8. Hilliard: +21.9% 9. Gahanna: +19.6% 10. Dublin: +13.1%
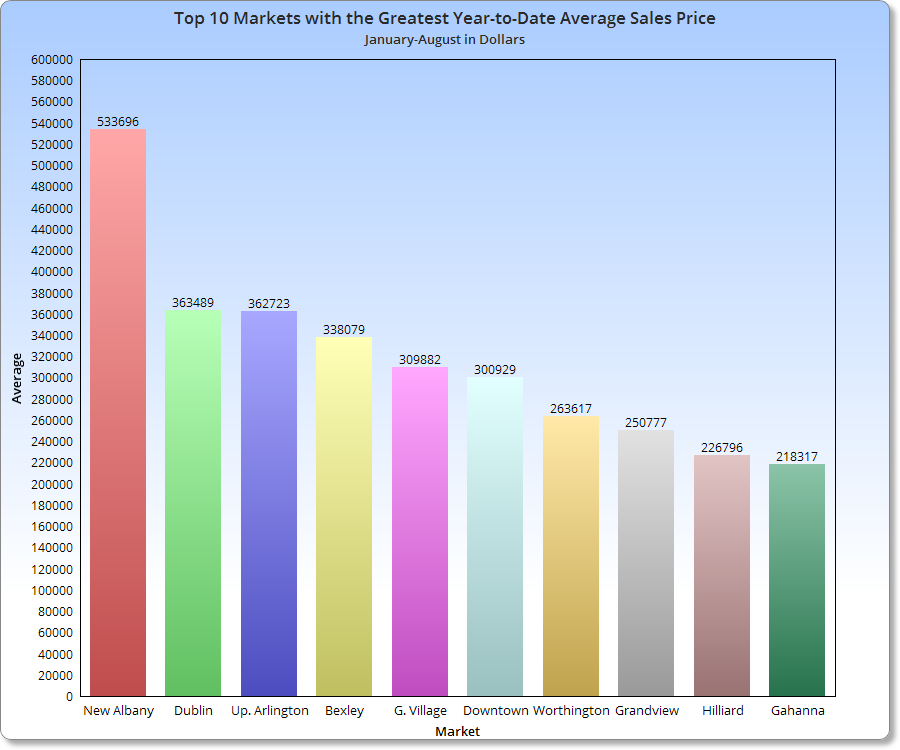
Top 10 Average Sales Prices YTD Through December 2013 1. New Albany: $542,634 2. Upper Arlington: $365,143 3. Bexley: $352,214 4. Dublin: $336,048 5. German Village: $298,199 6. Downtown: $287,976 7. Worthington: $248,857 8. Grandview Heights: $223,185 9. Hilliard: $217,078 10. Gahanna: $199,546
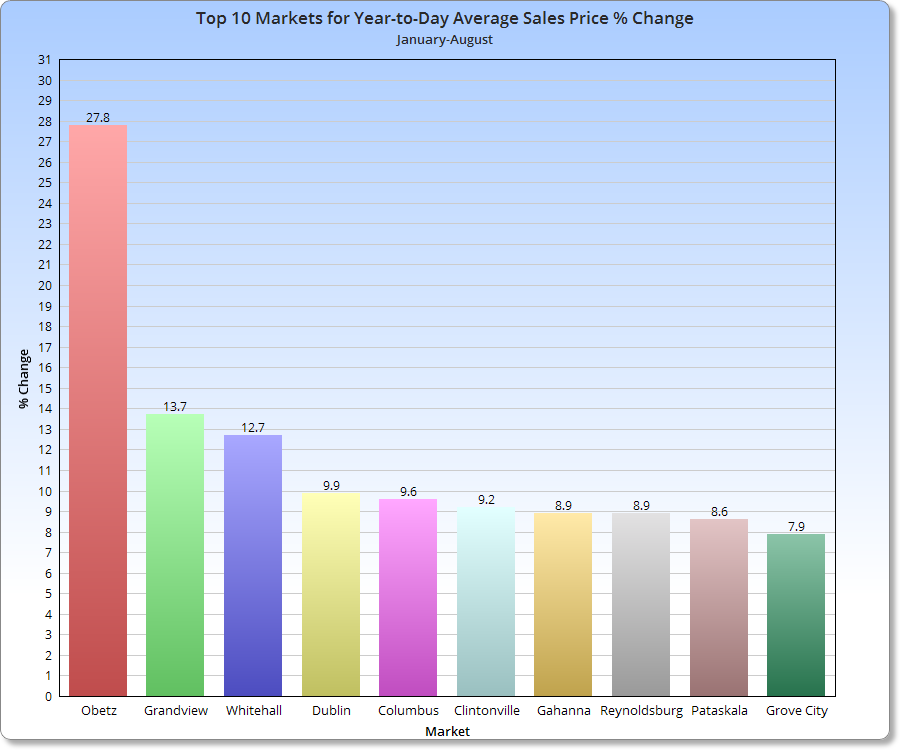
Top 10 Average YTD Sales Price % Change Through December 2013 vs. 2012 1. Whitehall: +18.9% 2. Downtown: +14.0% 3. Minerva Park: +14.0% 4. Upper Arlington: +13.8% 5. Gahanna: +12.1% 6. New Albany: +9.8% 7. Reynoldsburg: +9.6% 8. Obetz: +9.0% 9. Worthington: +7.5% 10. Bexley: +5.8%
Average Sales Price December 2013 Urban: $218,764 Suburban: $233,048 Urban without Columbus: $227,832
Average Sales Price Change December 2012 vs. December 2012 Urban: -1.6% Suburban: +15.5% Urban without Columbus: -2.9%
Average Sales Price YTD Urban: $217,056 Suburban: $224,060 Urban without Columbus: $226,017
Average Sales Price % Change YTD Urban: +5.6% Suburban: +5.6% Urban without Columbus: +5.7%
Top 10 Fastest Selling Markets December 2013 (Based on Average # of Days for Listings to Sell) 1. Bexley: 26 2. Obetz: 42 3. New Albany: 47 4. Hilliard: 50 5. Clintonville: 51 6. Pataskala: 57 7. Gahanna: 58 8. Upper Arlington: 58 9. Reynoldsburg: 61 10. Grove City: 63
Average # of Days Before Sale, December 2013 Urban: 73.4 Suburban: 63.9 Urban without Columbus: 73.8
Average # of Days Before Sale YTD Urban: 61.3 Suburban: 62.9 Urban without Columbus: 60.9
Top 10 Lowest Market Housing Supplies (Based on # of Months to Sell all Listings) 1. Worthington: 1.2 2. Bexley: 1.8 3. Clintonville: 1.9 4. Hilliard: 1.9 5. Upper Arlington: 1.9 6. Grandview Heights: 2.1 7. Westerville: 2.1 8. Gahanna: 2.2 9. Minerva Park: 2.2 10. German Village: 2.3
A healthy housing supply is considered to be around 5 months. Anything less than 3 months is considered very low. All of the 21 areas I looked at were below 5 months, indicating a county-wide shortage. This shortage has only deepened over the last year, with December having the lowest number of available homes in nearly 15 years.
Average # of Months to Sell All Listings, December 2013 Urban: 2.7 Suburban: 3.2 Urban without Columbus: 2.6
Average % Change of Single-Family Home Sales December 2013 vs. December 2012 Urban: +28.5% Suburban: +14.3% Urban without Columbus: +30.8%
Average % Change of Single-Family Home Sales YTD vs. YTD 2012 Urban: +9.8% Suburban: +19.0% Urban without Columbus: +8.8%
Average % Change of Condo Sales December 2013 vs. December 2012 Urban: +20.5% Suburban: -4.2% Urban without Columbus: +20.5%
Average % Change of Condo Sales YTD vs. YTD 2012 Urban: +29.0% Suburban: +23.5% Urban without Columbus: +29.9%
According to Columbus Realtors, September continued one of the Columbus area’s longest positive streaks when it came to housing sales, although sales were down a bit from earlier this year. Overall, sales were up 13.1% and prices were up 4.2%.
For the housing report, I look at the 21 major areas of the Franklin County area (11 urban, 10 suburban). Here is what the September market looked like.
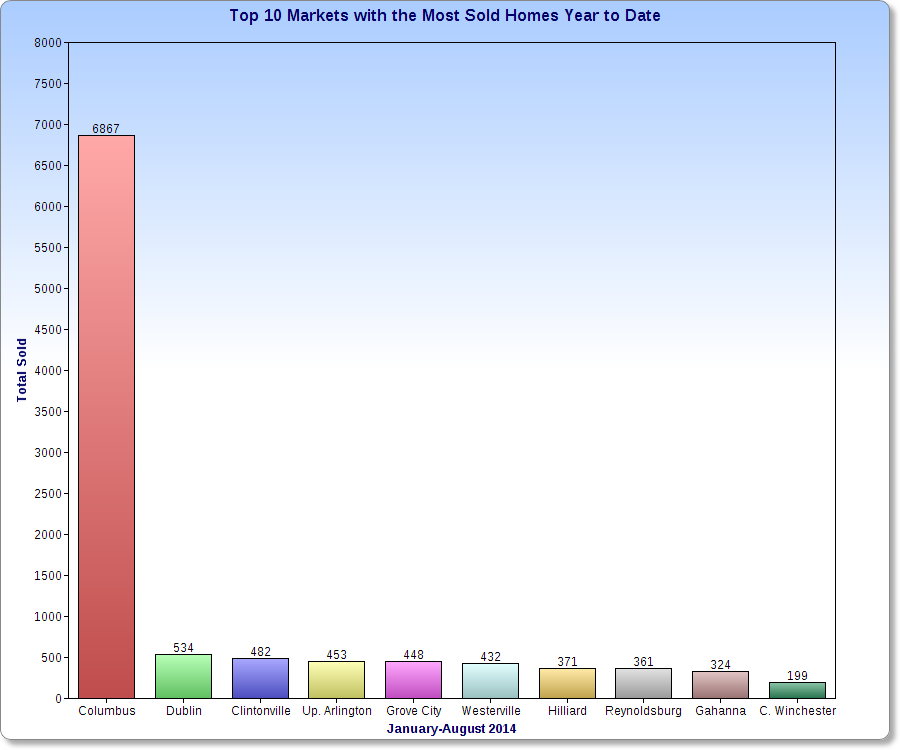
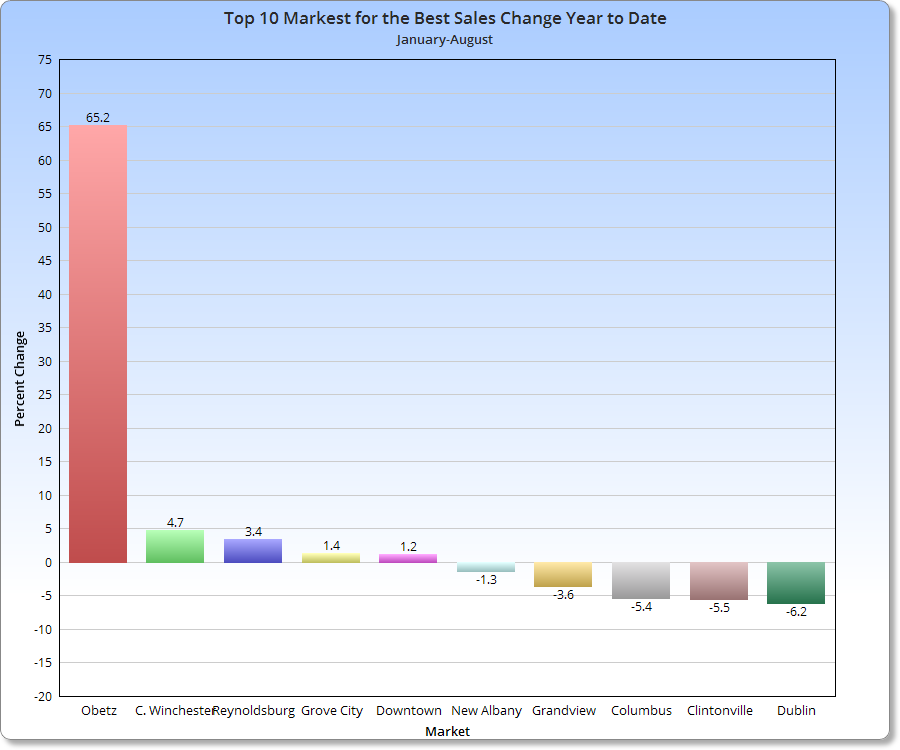
The Columbus housing market August 2013 data from Columbus Realtors shows that the area continued hot, with record August sales and potentially a record year still in the making. For the region, sales were up 11% for August and are were up almost 23% for the first 8 months of the year.
I looked at the 21 major areas of Franklin County (11 urban, 10 suburban). Here is what the August market looked like.
In this edition of the Columbus Housing Market July 2013, we see from Columbus Realtorsthat the housing market has been pretty white hot, and metro area sales set monthly records in July with an increase over 28%. July also featured the 3rd highest sales of any month on record.
I looked at the 21 major areas of Franklin County (11 urban, 10 suburban). Here is what the July market looked like.
Average # of Days before Sale, July 2013 Urban: 49.8 Suburban: 48.7 Urban without Columbus: 48.8
Average # of Days before Sale, YTD Urban: 64.6 Suburban: 62.3 Urban without Columbus: 64.4
Top 10 Lowest Housing Supplies (based on # of months to sell all listings), July 2013 1. Worthington: 1.9 2. Grandview Heights: 2.4 3. Upper Arlington: 2.4 4. Clintonville: 2.5 5. Hilliard: 2.7 6. Westerville: 2.8 7. Dublin: 3.1 8. Bexley: 3.2 9. Gahanna: 3.6 10. Downtown: 4.0
Average # of Months to Sell All Listings Urban: 3.7 Suburban: 4.2 Urban without Columbus: 3.6
Average % Change of Single-Family Home Sales, July 2013 vs. July 2012 Urban: +55.0% Suburban: +33.4% Urban without Columbus: +58.0%
Average % Change of Condo Sales, July 2013 vs. July 2012 Urban: +78.4% Suburban: +89.0% Urban without Columbus: +82.3%
Average % Change of Single-Family Home Sales YTD vs. YTD 2012 Urban: +14.4% Suburban: +28.5% Urban without Columbus: +13.0%
Average % Change of Condo Sales YTD vs. YTD 2012 Urban: +42.8% Suburban: +32.7% Urban without Columbus: +44.0%
Seems like most areas are doing fairly well, including the urban core. Of course, these number do not measure rentals, which is what is really booming right now in the residential scene.