2012 City Population Estimates


2012 city population estimates Columbus, Ohio

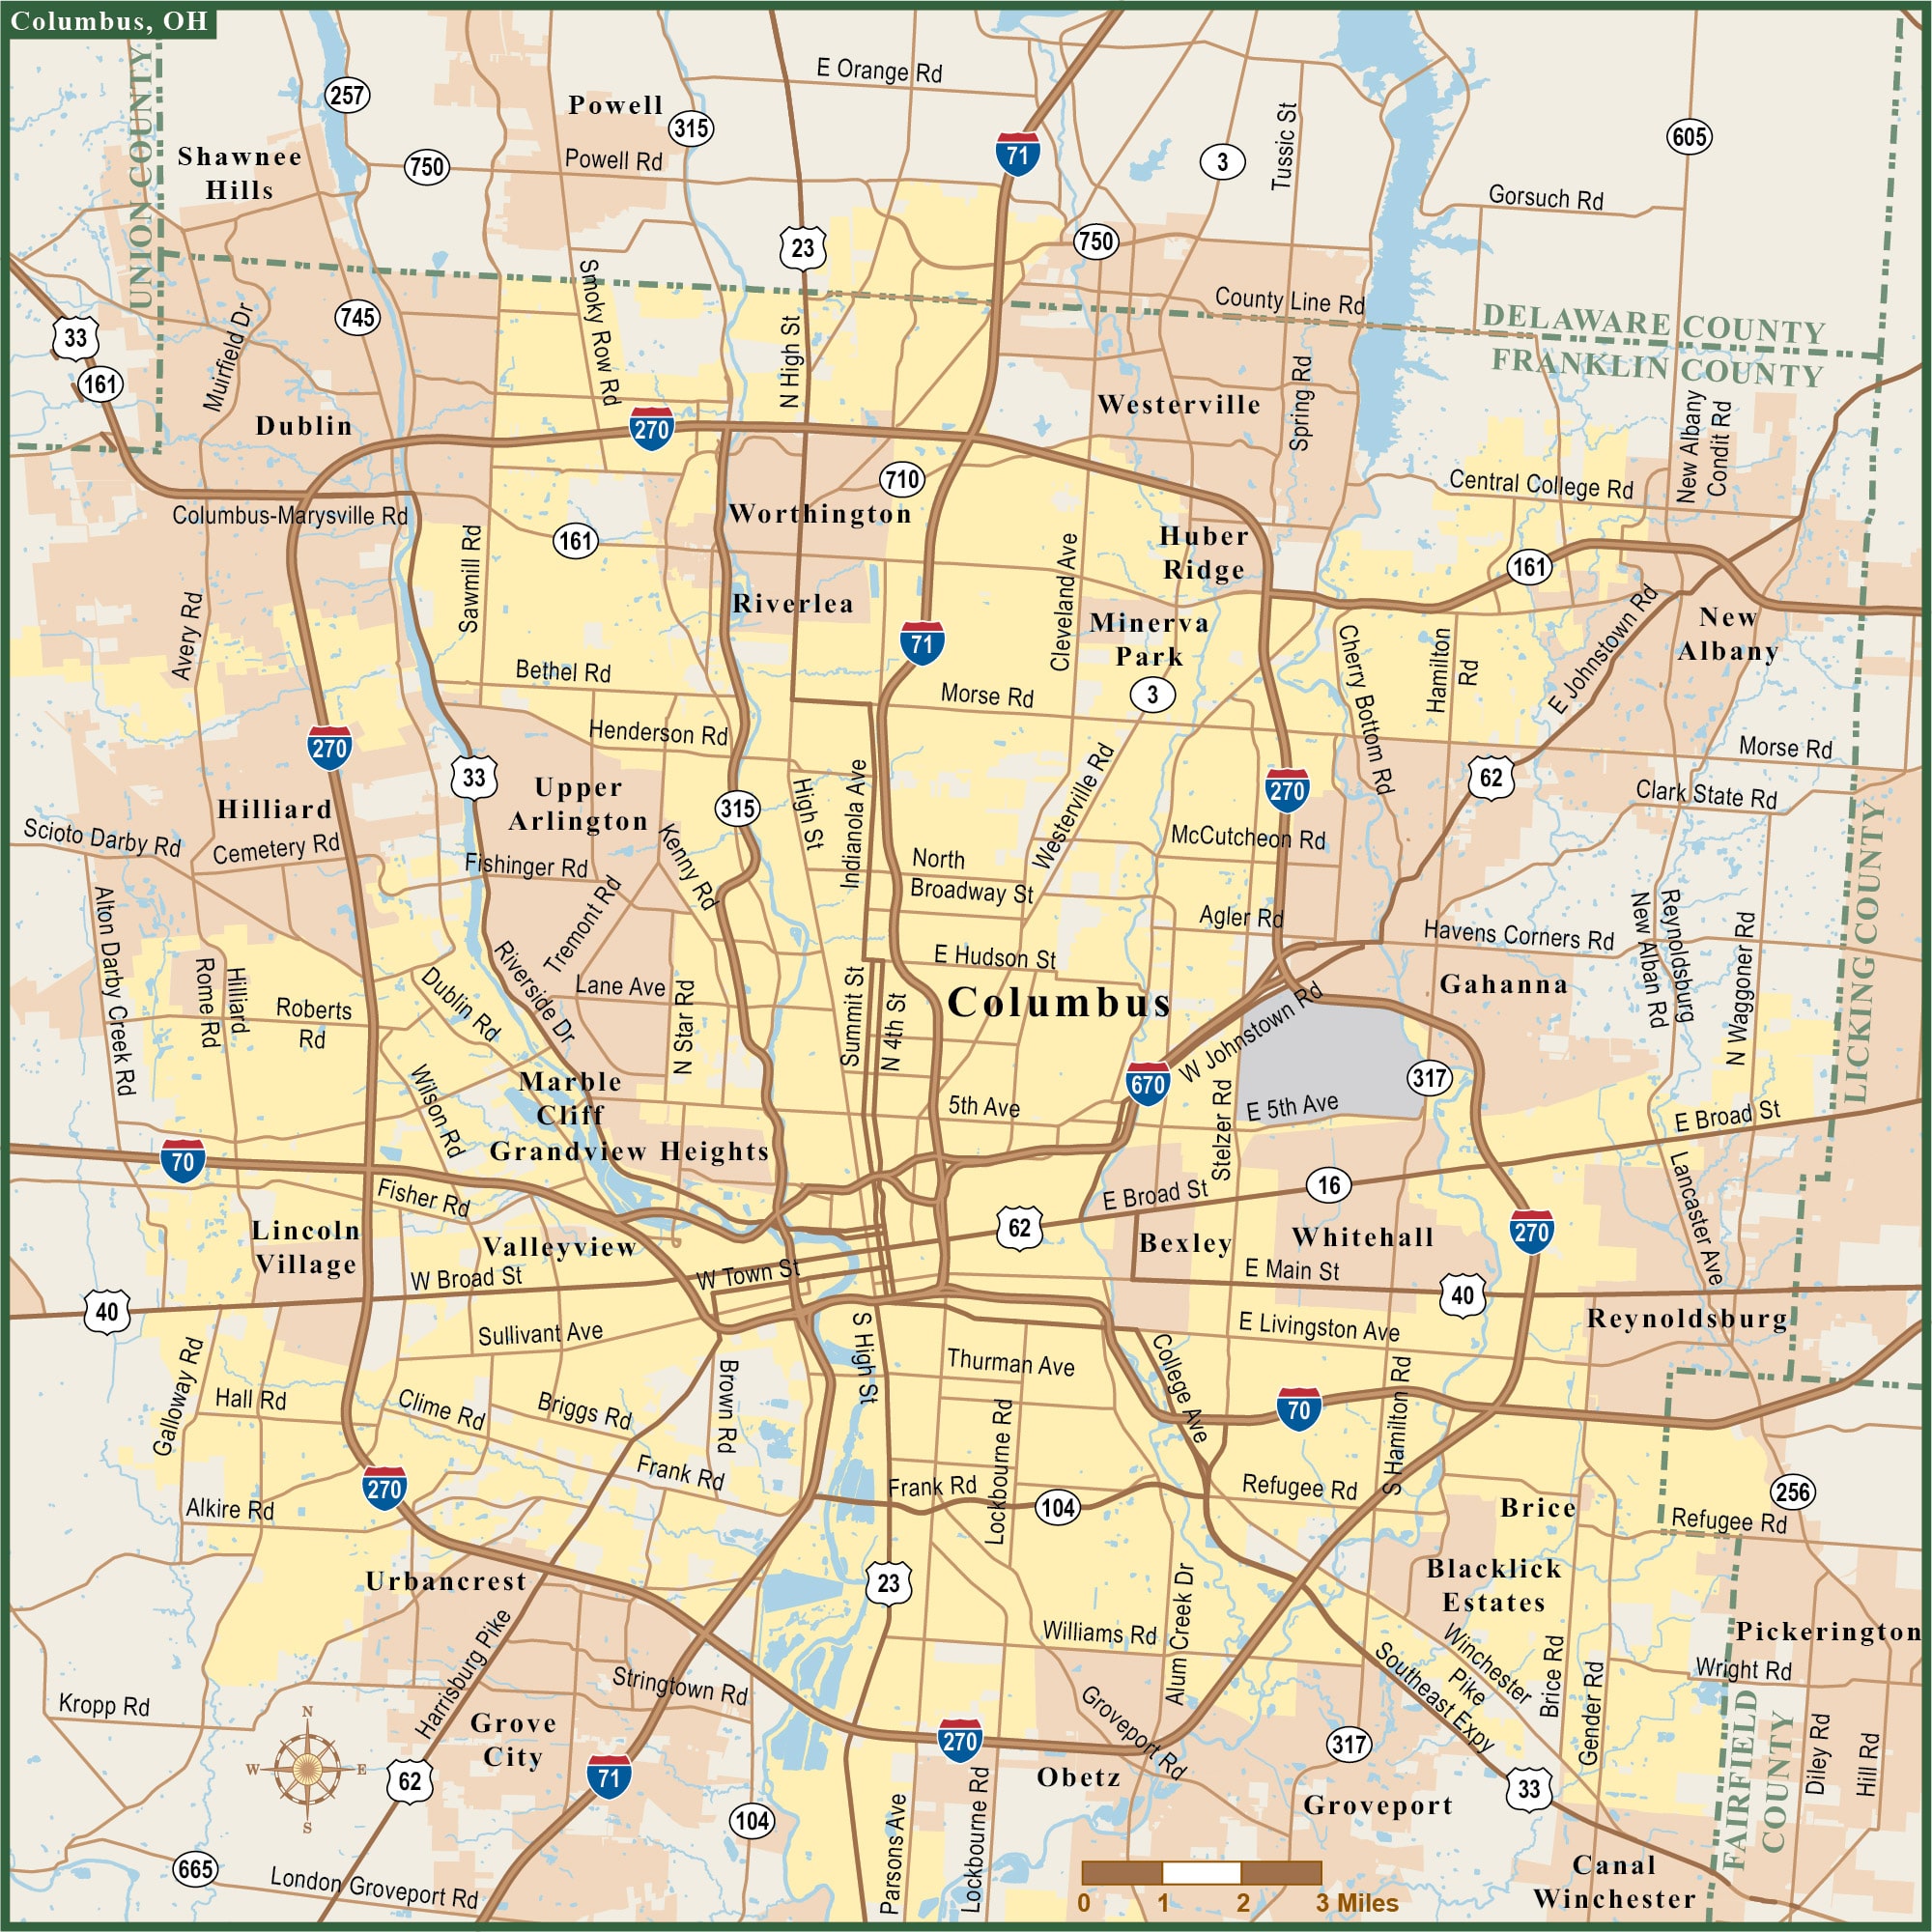
Here are the 2012 city population estimates for just about every location within the Columbus Metro Area.

The numbers show what the 2010 Census population was, the July 1, 2012 estimate, and the total change over that period.

City- 2010 – 2012 – Change
Alexandria 517 518 +1
Amanda 737 741 +4
Ashley 1,330 1,344 +14
Ashville 4,097 4,115 +18
Baltimore 2,966 2,968 +2
Bexley 13,057 13,252 +195
Bremen 1,425 1,438 +13
Brice 115 116 +1
Buckeye Lake 2,746 2,723 -23
Canal Winchester 7,101 7,393 +292
Cardington 2,047 2,046 -1
Carroll 524 524 0
Chesterville 228 229 +1
Circleville 13,314 13,453 +139
Columbus 787,033 809,798 +22765
Commercial Point 1,582 1,587 +5
Corning 583 579 -4
Crooksville 2,534 2,518 -16
Darbyville 222 224 +2
Delaware 34,753 35,925 +1172
Dublin 41,751 42,906 +1155
Edison 437 439 +2
Fulton 258 259 +1
Gahanna 33,248 33,828 +580
Galena 653 666 +13
Glenford 173 176 +3
Grandview Heights 6536 6910 +374
Granville 5646 5638 -8
Gratiot 221 221 0
Grove City 35575 36832 +1257
Groveport 5363 5540 +177
Hanover 921 1002 +81
Harrisburg 320 326 +6
Hartford 397 393 -4
Heath 10310 10389 +79
Hebron 2336 2350 +14
Hemlock 155 155 0
Hilliard 28435 30564 +2129
Johnstown 4632 4806 +174
Junction City 819 816 -3
Kirkersville 525 528 +3
Lancaster 38780 38880 +100
Laurelville 527 523 -4
Lithopolis 1106 1181 +75
Lockbourne 237 241 +4
Logan 7152 7157 +5
London 9904 9876 -28
Magnetic Springs 268 270 +2
Marble Cliff 573 580 +7
Marengo 342 344 +2
Marysville 22094 22051 -43
Midway 322 322 0
Milford Center 792 802 +10
Millersport 1044 1047 +3
Minerva Park 1272 1291 +19
Mount Gilead 3660 3658 -2
Mount Sterling 1782 1716 -66
Murray City 449 445 -4
New Albany 7724 8507 +783
Newark 47573 47688 +115
New Holland 801 827 +26
New Lexington 4731 4751 +20
New Straitsville 722 720 -2
Obetz 4532 4628 +96
Orient 270 272 +2
Ostrander 643 656 +13
Pataskala 14962 15091 +129
Pickerington 18291 18692 +401
Plain City 4225 4221 -4
Pleasantville 960 955 -5
Powell 11500 11960 +460
Rendville 36 36 0
Reynoldsburg 35893 36347 +454
Richwood 2229 2238 +9
Riverlea 545 555 +10
Rushville 302 304 +2
St Louisville 373 374 +1
Shawnee 655 652 -3
Shawnee Hills 681 709 +28
Somerset 1481 1473 -8
South Bloomfield 1744 1770 +26
South Solon 355 355 0
Sparta 161 162 +1
Stoutsville 560 563 +3
Sunbury 4389 4605 +216
Tarlton 282 285 +3
Thornville 991 995 +4
Thurston 604 607 +3
Unionville Center 233 235 +2
Upper Arlington 33771 34203 +432
Urbancrest 960 975 +15
Utica 2132 2130 -2
Valleyview 620 627 +7
Westerville 36120 37073 +953
West Jefferson 4222 4199 -23
West Rushville 134 135 +1
Whitehall 18062 18403 +341
Williamsport 1023 1032 +9
Worthington 13575 13757 +182

For those counting, there are 99 places in that list. 79 of them, or 79.8%, show growth over the period. Every place within Franklin County saw growth- maybe not down to the neighborhood level- but in all of the towns and cities.

Columbus passed 800,000 for the first time, and its actual growth rate increased from about 1.1% annually to 1.6% annually.


New 2012 Metro and County Population Estimates


New 2012 Metro and County Population Estimates

New 2012 metro and county population estimates have been released by the US Census, so we’ll break down the numbers and see if any trends pop out.

First the statewide county maps for numerical change for 2010-2011 and 2011-2012.


Some good and bad with these. The bad is that fewer counties were estimated to be growing from 2011-2012 than were in 2010-2011. The good news it that central core counties improved their growth or slowed their losses, such as Franklin, Cuyahoga and Hamilton. This may mean that population is consolidating around urban cores rather than being spread out… or it may just mean that more counties are losing population.

Top 10 Counties with Greatest Numerical Growth
1. Franklin: +16,273
2. Delaware: +2,444
3. Warren: +1,893
4. Hamilton: +1,350
5. Wood: +1,291
6. Butler: +657
7. Clermont: +619
8. Hancock: +560
9. Stark: +540
10. Geauga: +362

If we take every county estimate, Ohio grew by 10,502, which is a slight improvement from 2011′s 8,447, which itself was faster than 2010′s 7,608. Still very slow, but seemingly getting a bit better each year.

As far as the metropolitan areas, their boundaries were changed last week as new definitions for what constitutes a metro area were introduced. This produced some rather drastic changes to metro areas and their populations.

Old and New Metro Boundaries and their Old and New Populations
Akron: Did not change boundaries and still consists of Summit and Portage counties.
2011: 702,854
2012: 702,262

Canton: Did not change and is still Stark and Carroll counties.
2011: 403,164
2012: 403,455

Cincinnati: Added Union County, Indiana, but dropped Franklin County, Indiana.
2011: 2,122,330
2012: 2,128,603

Cleveland: Did not change and is still Cuyahoga, Lake, Lorain, Geauga and Medina counties.
2011: 2,068,397
2012: 2,063,535

Columbus: Added Perry and Hocking Counties.
2011: 1,925,137
2012: 1,944,002

Dayton: Dropped Preble County.
2011: 801,040
2012: 800,972

Toledo: Dropped Ottawa County.
2011: 609,320
2012: 608,711

Youngstown: Did not change, still Mahoning, Trumbull and Mercer County, PA.
2011: 561,697
2012: 558,206

As you can see, 5 of the 8 are losing population, though most had slower losses in 2012 than they did in 2011. This may also be a sign of population moving toward the urban centers, or again, could just be a blip.

One of the interesting pieces of data about the metro areas is the section on components of population change, meaning where did the growth or loss come from.

Total Metro Births July 1, 2011 to July 1, 2012 and Rank
1. Cincinnati: +27,374
2. Columbus: +25,910
3. Cleveland: +22,484
4. Dayton: +9,414
5. Akron: +7,418
6. Toledo: +7,285
7. Youngstown: +5,446

Total Metro Deaths July 1, 2011 to July 1, 2012 and Rank
1. Cleveland: -20,290
2. Cincinnati: -18,204
3. Columbus: -14,457
4. Dayton: -7,930
5. Youngstown: -6,811
6. Akron: -6,756
7. Toledo: -5,678

Natural Change (Births vs Deaths) July 1,2011 to July 1, 2012 and Rank
1. Columbus: +11,453
2. Cincinnati: +9,170
3. Cleveland: +2,194
4. Toledo: +1,607
5. Dayton: +1,484
6. Akron: +662
7. Youngstown: -1,365

Domestic Migration July 1, 2011 to July 1, 2012 and Rank
1. Columbus: +2,688
2. Akron: -2,248
3. Youngstown: -2,341
4. Dayton: -2,717
5. Toledo: -2,931
6. Cincinnati: -6,036
7. Cleveland: -10,579

Columbus is the only metro seeing positive domestic migration in Ohio.

International Migration July 1, 2011 to July 1, 2012 and Rank
1. Columbus: +4,729
2. Cleveland: +3,555
3. Cincinnati: +3,217
4. Dayton: +1,175
5. Akron: +1,009
6. Youngstown: +778
7. Toledo: +676

Total In-Migration July 1, 2011 to July 1, 2012 and Rank
1. Columbus: +7,417
2. Youngstown: -974
3. Akron: -1,239
4. Dayton: -1,542
5. Toledo: -2,255
6. Cincinnati: -2,819
7. Cleveland: -7,024

Canton is the only other Ohio metro that saw a net postive in-migration for the time period besides Columbus.

For more information on county and metro areas, follow the below links:
Metro Area Demographics/
Franklin County Demographics