2011 Census Tract Estimates


2011 census tract estimates Columbus, Ohio

While I wouldn’t normally make a post on the 2011 census tract estimates- or any other estimates for them- because I really don’t know what their reliability is, I thought it might be an interesting exercise.

I only looked at those tracts that made up the original 1950 boundaries as well as some of the adjacent areas. I won’t go into too much detail, but…

In 2010, only 20 of the 78 tracts I looked at were growing. Well, specifically, only 20 grew during the 2000-2010 period, not just in 2010 alone. So several more could’ve been starting to recover in 2010, but since it measured the whole decade, it might still show up as a loss. In any case, the 2011 estimates are interesting just because they show a much different picture.

If I use the exact estimate used, 34 of the 78 tracts were growing in 2011, a significant improvement. However, some of the estimates were hard to understand where they came from. For example, they had Downtown tracts, which have had rapid growth the last decade, as declining in population for 2011, even while more and more residential units are built and more people move into the area. Also, they showed some tracts gaining population when the long-term trend is for significant loss and no reason to see that reversing.

So using the margin of error as a guide, I went back over them and did my own estimates. Of the 78 tracts, I only did my own for 14, as they were the only ones I felt didn’t match the reality on the ground or the long-term trends. With those changes, 38 of the 78 were growing, a slight increase of the official 34.

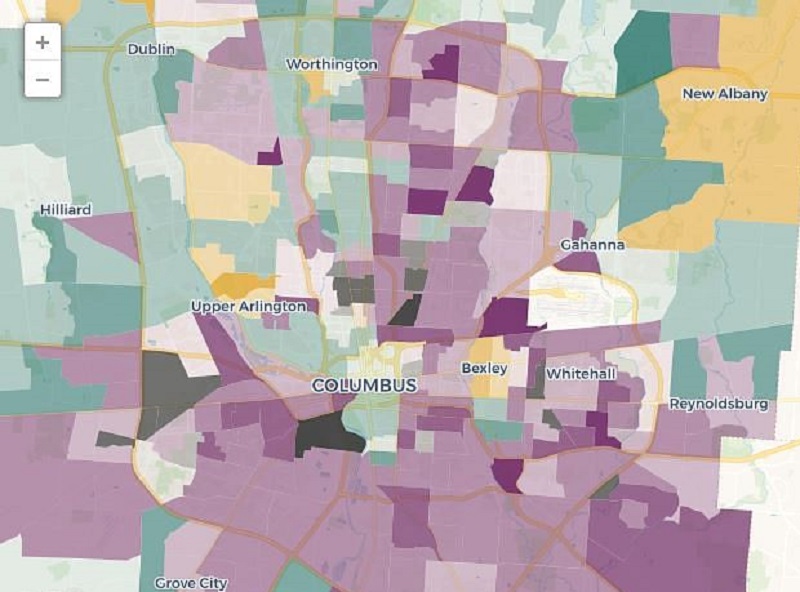
If we use the official estimates, the total population for the 78 tracts was 232,297, a loss of 2,285 since 2010. If we use my estimates, the population would be 237,806, or an increase of 3,224. So what’s the real story? Well, new 2012 tract estimates will be coming out soon. When they do, I will compare and see what, if any, updates should be made. The only real way to know, however, is to wait until 2020 with the next census. Still, until that time, it’s fun to look at the numbers- or maps– and see if the urban core is recovering in the same way that cities and towns are in and around Franklin County.


2012 Urban and Suburban Population Trends


2012 urban and suburban population trends

I posted the 2012 city estimates from the US Census yesterday. Within them may be an interesting trend that has long-term implications for Columbus and other cities, so today we’re going to go over 2012 urban and suburban population trends, and see how they compare.

A lot of the talk in the news in recent years has been how urban core cities are seeing a comeback of sorts. I’ve made mention of it several times, myself, with hard data located on the Demographics and Population part of this site. However, there is some disagreement between urban proponents and suburban proponents about what’s really going on, and that disagreement seems to focus mostly around if the city is growing faster than the suburbs, and if so, if that trend can be sustained.

Looking over the estimates, I noticed something that may support the urban back-to-the-city argument, at least in Columbus. What I noticed was that those villages/towns/cities that were growing tended to be clustered closer to the urban core of the metro than those that were losing population.

I first gathered the data on the Columbus metro area’s 99 incorporated places, ranging in population from 36 on up to Columbus’ 809,798. I then measured the distance between Columbus’ Downtown center and the center of all 99 places. I then broke them up into increments of about 5 miles each. Here is some of what I found.

Average Total Population Growth by Place 2010-2012 by Distance from Columbus’ Center
0-4.9 Miles: 3,962.8
5-9.9 Miles: 438.4
10-14.9 Miles: 342.8
15-19.9 Miles: 26.5
20-24.9 Miles: 148.9
25+ Miles: 10.5

What this says, is that for the most part, the closer a place is to the center, the more total average growth it’s had since 2010. While the 0-4.9 mile distance is somewhat skewed because it includes Columbus’ growth, there is also a significant drop-off beyond 15 miles from the center.

Next, I looked at all the places that saw either 0 population change or a loss during the 2010-2012 period. Again, it was separated by the distance from Columbus’ center.

0-4.9 Miles: 0 of 6, or 0.0%
5-9.9 Miles: 0 of 12, or 0.0%
10-14.9 Miles: 1 of 12, or 8.3%
15-19.9 Miles: 2 of 8, or 25.0%
20-24.9 Miles: 2 of 10, or 20.0%
25+ Miles: 21 of 51, or 41.2%

What this shows is that the further the distance away from the center, in general, the more places there were that were stagnant or lost population since 2010.

Finally, I looked at the top 15 total population increases of all places from 2010-2012, as well as their distance from Columbus’ center.
1. Columbus (obviously): +22,765- 0 Miles
2. Hilliard: +2,129- 9.9 Miles
3. Grove City: +1,257- 7.4 Miles
4. Delaware: +1,172- 23.6 Miles
5. Dublin: +1,155- 11.3 Miles
6. Westerville: +953- 12.0 Miles
7. New Albany: +783- 13.0 Miles
8. Gahanna: +580- 7.5 Miles
9. Powell: +460- 14.2 Miles
10. Reynoldsburg: +454- 9.9 Miles
11. Upper Arlington: +432- 4.1 Miles
12. Pickerington: +401- 14.1 Miles
13. Grandview Heights: +374- 2.6 Miles
14. Whitehall: +341- 6.0 Miles
15. Canal Winchester: +292- 12.7 Miles

12 of the 15 are within Franklin County. Another 2 (Pickerington and Powell) are near the Franklin County border. Only Delaware is beyond 15 miles from Columbus’ center.

So do these numbers show a real trend? Maybe. Some of the questions are: Do 2 years of data support a real trend or just a blip? Is this really an urban movement or a rural decline… or both? Is this a new/recent trend or have the numbers been changing? Those questions and others need to be answered before making a definitive statement, but if nothing else, they are a positive indication that Columbus and it’s immediate surroundings remain the metro’s (and Ohio’s) strongest population draw.