Here is a map for all the listed 1950s Ohio severe weather reports during that era. Click on the pins for more information.
The map incudes information for tornadoes, high wind and hail reports.
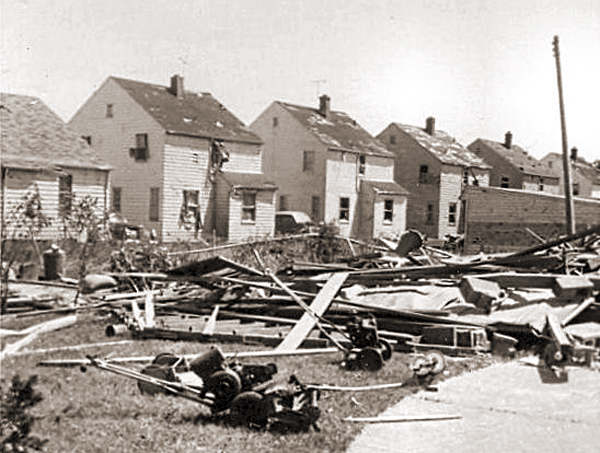
June 8, 1953 Northeast Ohio tornado damage.

Here is a map for all the listed 1950s Ohio severe weather reports during that era. Click on the pins for more information.
The map incudes information for tornadoes, high wind and hail reports.
June 8, 1953 Northeast Ohio tornado damage.