
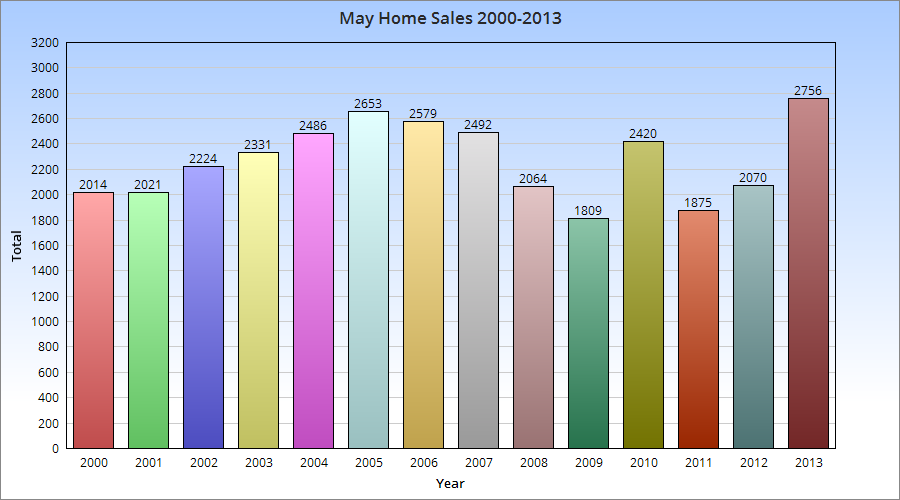
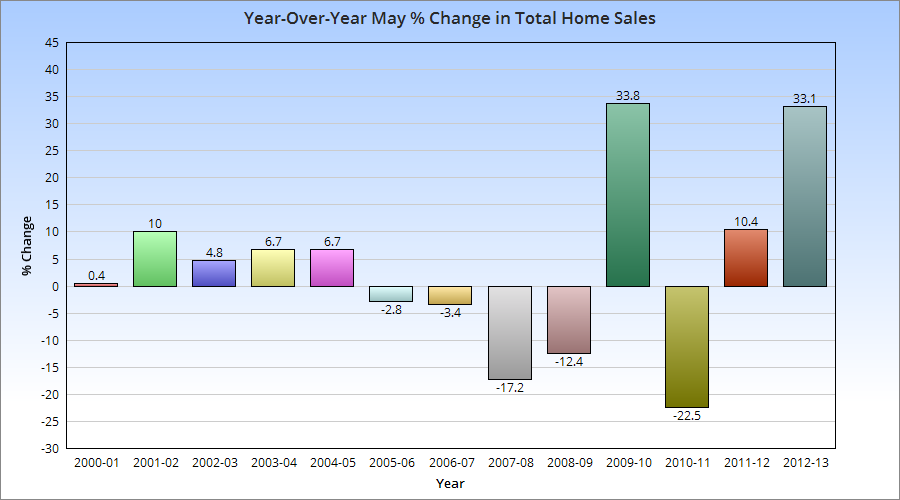
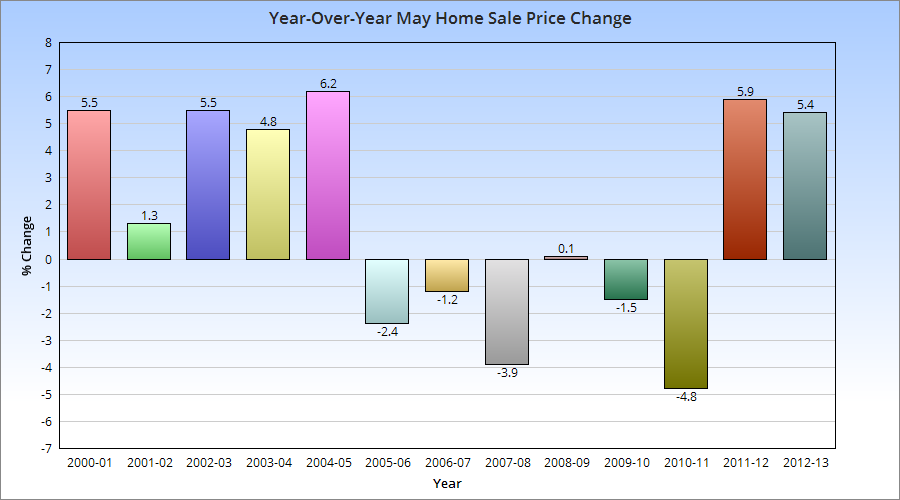
May home sales set a record for the month.
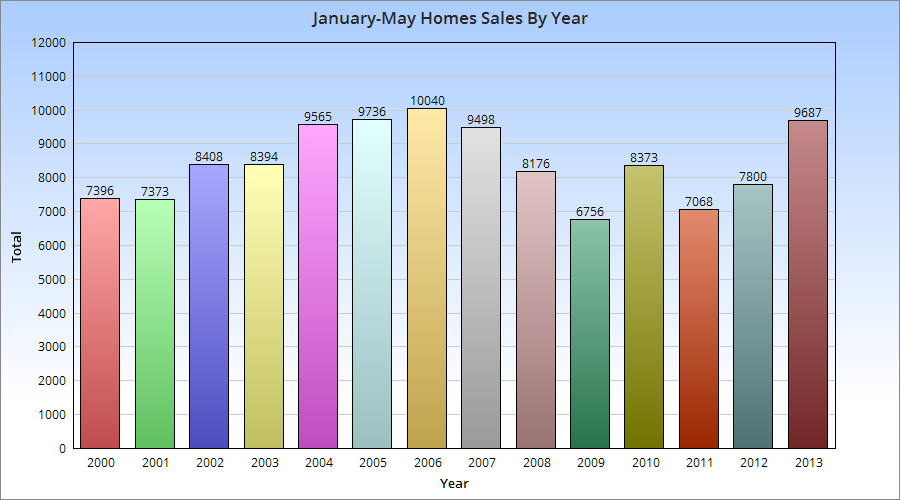
Through May, total sales are also way up, and were the 2nd highest for the 2000-2013 period.
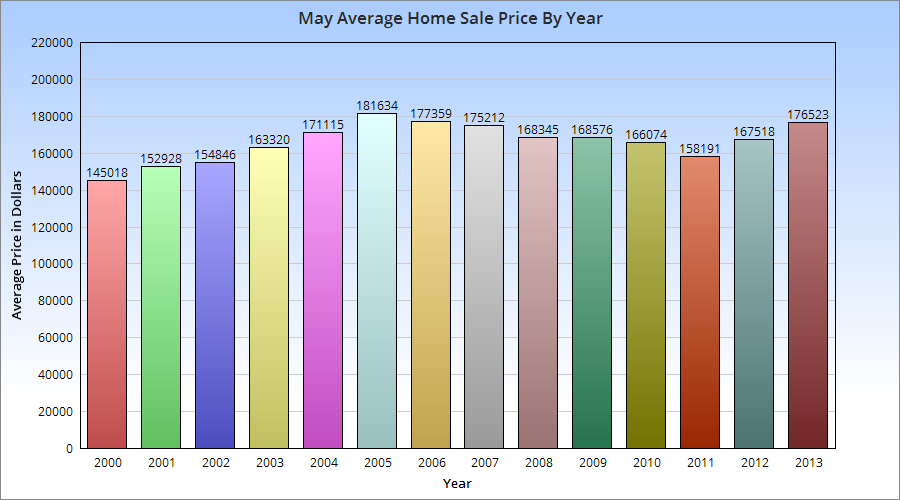
The average May home sales price was the highest since 2006.
The average January-May sales price was also up.
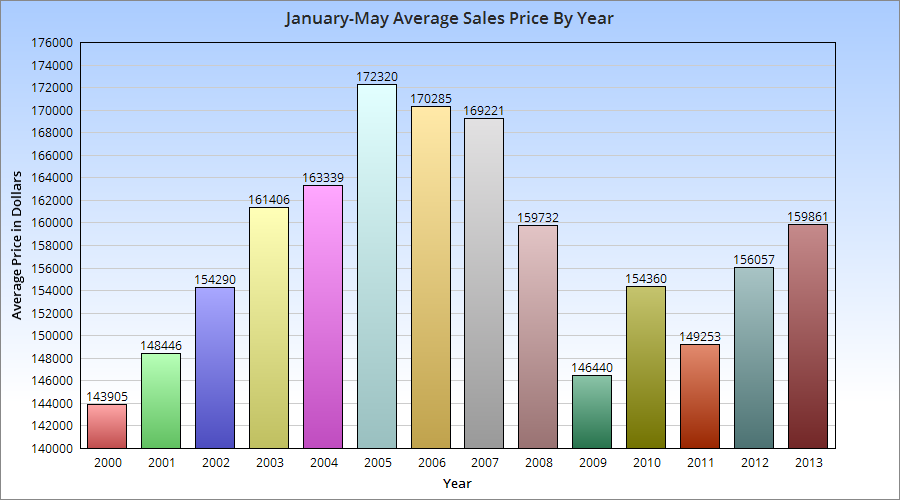
To me, all this shows is that after the Recession’s downturn, housing in the Columbus area is seeing a strong recovery. In some cases, the recovery is already surpassing the market that existed pre-Recession.