The US Census recently released updated estimates for 2016 for smaller-area designations like tracts and blocks. Looking at them, I wanted to see where racial groups were growing the fastest at that level. The first map is based on the % change from 2010 to 2016. What’s interesting about this map is that it is such a hodgepodge. No single part of the county is dominated by growth in any specific racial group. However, a few things can be generally determined. For example, almost all of the tracts where the White population is growing the fastest are within I-270, and the majority of those within the eastern half of the Columbus in what have long been dominated by Black majority populations. These areas include parts of Linden, the Near South and Near East sides. That said, the White population was growing the fastest in just 30 census tracts by % change. This compared to 53 for the Black population, 83 for the Asian population and 107 for the Hispanic population.
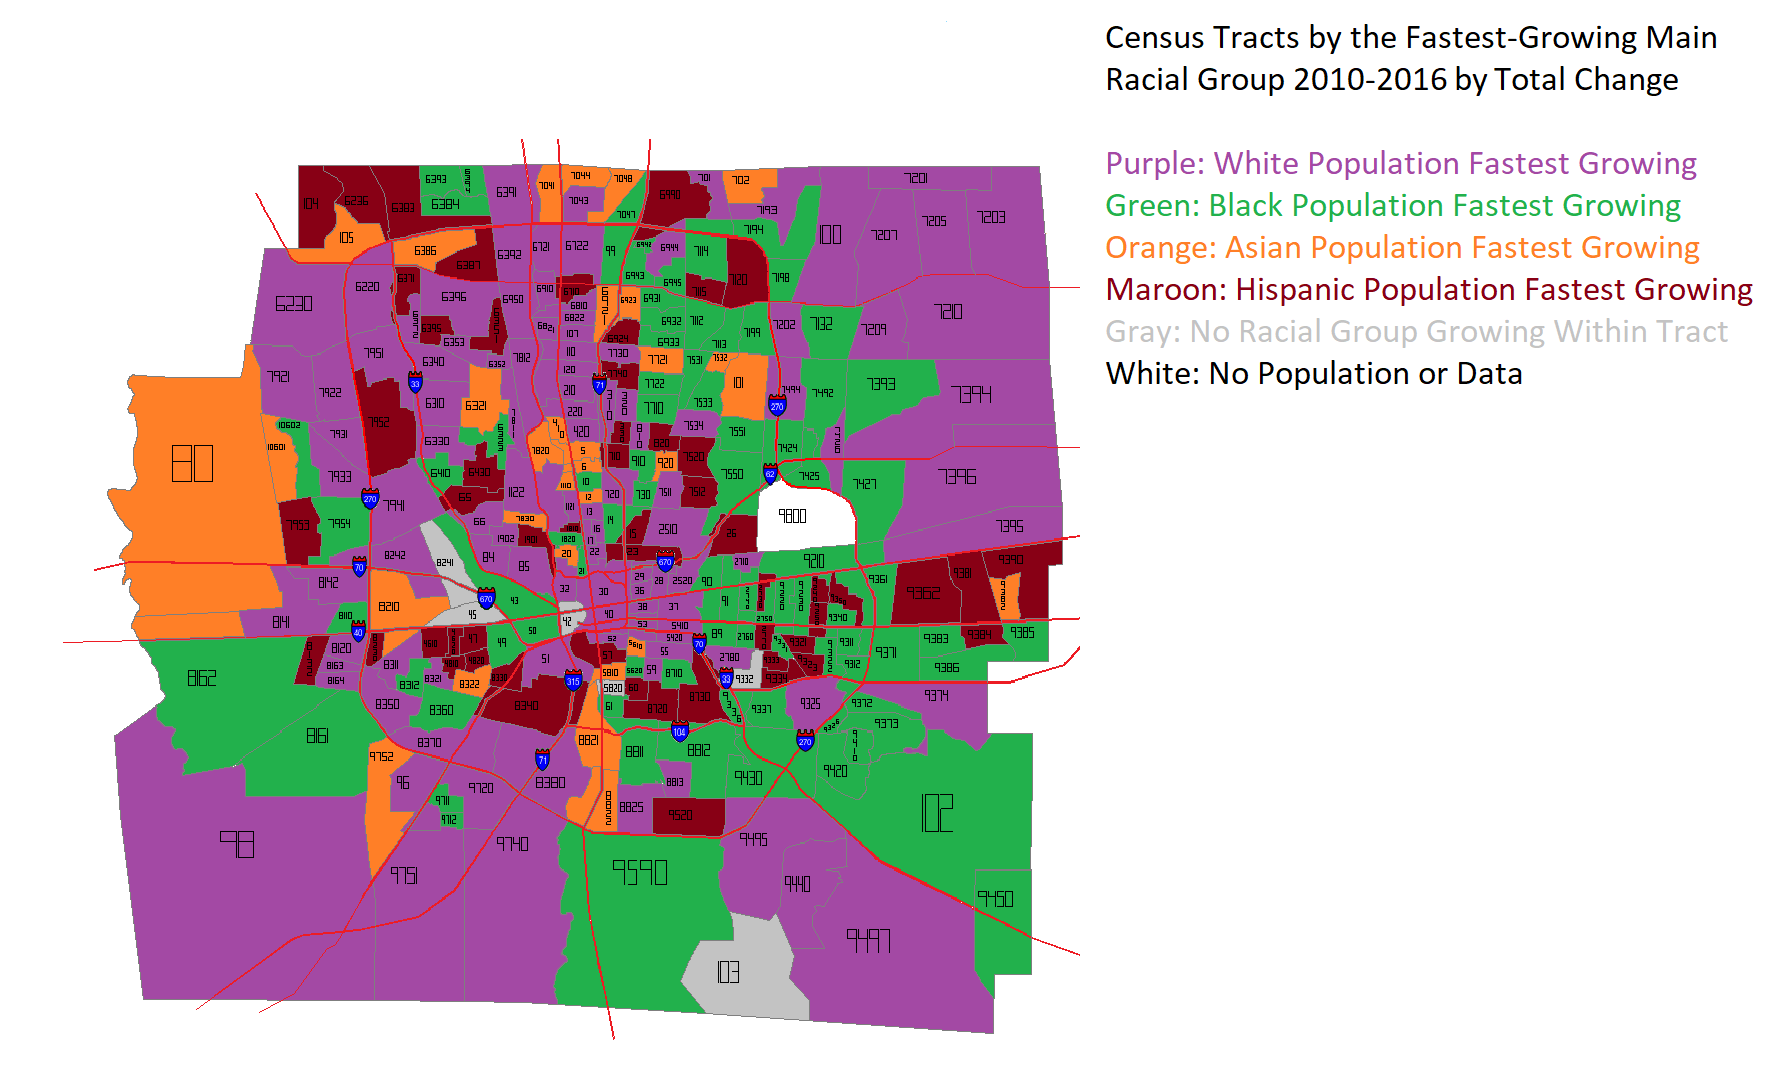
The next map takes a slightly different approach, measuring the TOTAL change in population, rather than by %. Again, a hodgepodge, but much less so than before. Instead of being the fastest-growing in just 30 tracts, the White population rockets up to 108 tracts. This shows that, while Asian and Hispanic populations have respectable % growth, this is largely based on comparatively small population bases. Still, non-White populations are clearly making inroads throughout Franklin County.
I saw this postthe other day about changing neighborhood demographics in certain cities, particularly when it comes to racial segregation and gentrification. Surprisingly, of all the maps and posts I’ve done on demographics, I hadn’t thought to do one that showed Franklin County gentrification trends. Well, now I have.
A bit of an explanation is needed for the color coding: -For those categories marked “Steady”, the demographic listed has been the majority throughout the period, with little to no change of other demographics. -For those mixed categories of one decline and one rise, it means that the majority demographic has declined at least 5 percentage points, while a secondary demographic has risen at least 5 percentage points. -For the category of recent or steady integration, there are at least 2 demographics at 10% or more of the total population, as well as a 3rd demographic reaching at least 5% of the population.
A few things that stand out to me: The eastern half of the county is in much greater flux than the western half, and integration is respectable county-wide. These neighborhoods of demographic equilibrium are largely the result of increasing Hispanic and Asian populations, particularly on the Northeast and West Sides, as well as the Whitehall area. In the center core, almost all of the High Street corridor has remained Steady White, suggesting that other demographics have, so far, been unable to tap into the building boom along and adjacent to this corridor. One other thing I notice is that there are FAR more tracts with a growing black population than there are with a growing White population, suggesting that perhaps the idea of Whites moving into neighborhoods and displacing residents is not quite as big of an issue as some might believe.
Here are the integrated tracts by year, based the above criteria, and their racial breakdown.
Breakdown of # of Tracts by % of Hispanic Population 1990 95% or Higher: 0 90%-94.9%: 0 80%-89.9%: 0 70%-79.9%: 0 60%-69.9%: 0 50%-59.9%: 0 Total Majority Hispanic Tracts: 0 40%-49.9%: 0 30%-39.9%: 0 20%-29.9%: 0 10%-19.9%: 0 0.1%-9.9%: 278 0%: 5 2015 95% or Higher: 0 90%-94.9%: 0 80%-89.9%: 0 70%-79.9%: 0 60%-69.9%: 0 50%-59.9%: 0 Total Majority Hispanic Tracts: 0 40%-49.9%: 0 30%-39.9%: 1 20%-29.9%: 7 10%-19.9%: 33 0.1%-9.9%: 241 0%: 9
Integrated Tracts By Year 1990: 2 2015: 98
Most Integrated Tract by Year 1990 1122: White: 76.6% Black: 9.6% Asian: 11.2% Hispanic: 2.5% 2015 7721: White: 33.9% Black: 31.2% Asian: 26.8% Hispanic: 10.1%
All in all, the data shows that the county is much less racially stratified/segregated now than it was in 1990, and that it doesn’t appear that gentrification is really affecting many areas in terms of forcing out one racial group for another.