Columbus Development Maps
2010-2013 Development
2014-2019 Development
2020-2025 Development
All these pages are basically just map versions of the development pages. However, the maps are organized by year and include before and after photos of the development sites.
Columbus Fantasy Transit Map
![]()
![]()
2019 Transit Map
The transit map for the Columbus Metro Area is just one example of many existing fantasy maps for Central Ohio. This one includes routes for light rail, BRT (Bus Rapid Transit) and interurban rail to neighboring counties.
The Redevelopment of Westland Mall
Mall Site
Westland Mall and the larger surrounding area is in desperate need of a revamp. Recently, a proposal to make the site into a “Weston” development in the potential style of Easton has emerged. I made this map several years ago as a basic blueprint for how the entire area could be rebuilt into a much more urban, walkable, vibrant corridor.
Ohio Severe Weather Report Maps by Decade
1950-1959 Severe Reports
1960-1960 Severe Reports
1970-1979 Severe Reports
2010-2019 Severe Reports
The 1950s and 1960s maps are the only ones completed so far.
Columbus Area Bike Lanes, Multi-use Paths and Sidewalk Infrastructure
Bike Infrastructure
This map attempts to include all the existing bike and multi-use infrastructure in the area, along with general pedestrian infrastructure. The map will is not fully updated yet through 2019.
Downtown Columbus Parking Infrastructure
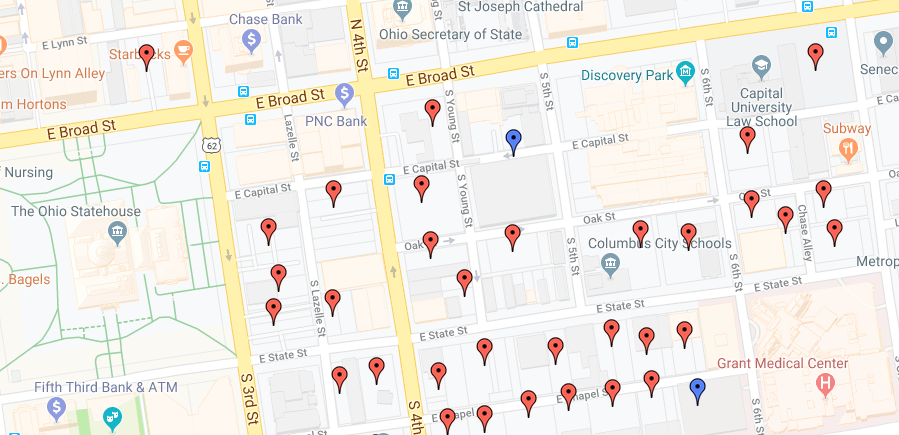
Parking Lots and Garages
This map, last updated in 2015, documents all existing parking garages and surfaces lots throughout Downtown.