This link is continuously being updated because there are thousands and thousands of historic buildings in the Columbus area. I am focusing on just those within I-270. Information includes the address or name of the building, the year or approximate time built, height in stories, original and current uses, as well as whether or not it is on the National Register of Historic Buildings. If so, I included the year that it was added to the Register.
The buildings on the map go all the way back to 1804 and run through 1925.
Because this map is a work in progress, the link will be permanent under the City Resources links on the home page. Keep checking back to see more places being added over time.
Downtown Columbus parking is a problem… in that there is far too much of it. It’s long been common knowledge that Downtown had an abundance of parking lots and garages, but I’ve never seen it actually mapped or counted before. The following Google map shows what’s long been known in a bit more graphic detail.
Red pins are surface parking lots and blue pins are parking garages. I only tried to count surface lots with 10 spaces or more, and they could be city, business or other types of lots. Lots currently being developed were not counted, nor were underground garages.
The final tally? 310 surface lots and 27 garages! Remember that the next time someone says they can’t find somewhere to park Downtown.
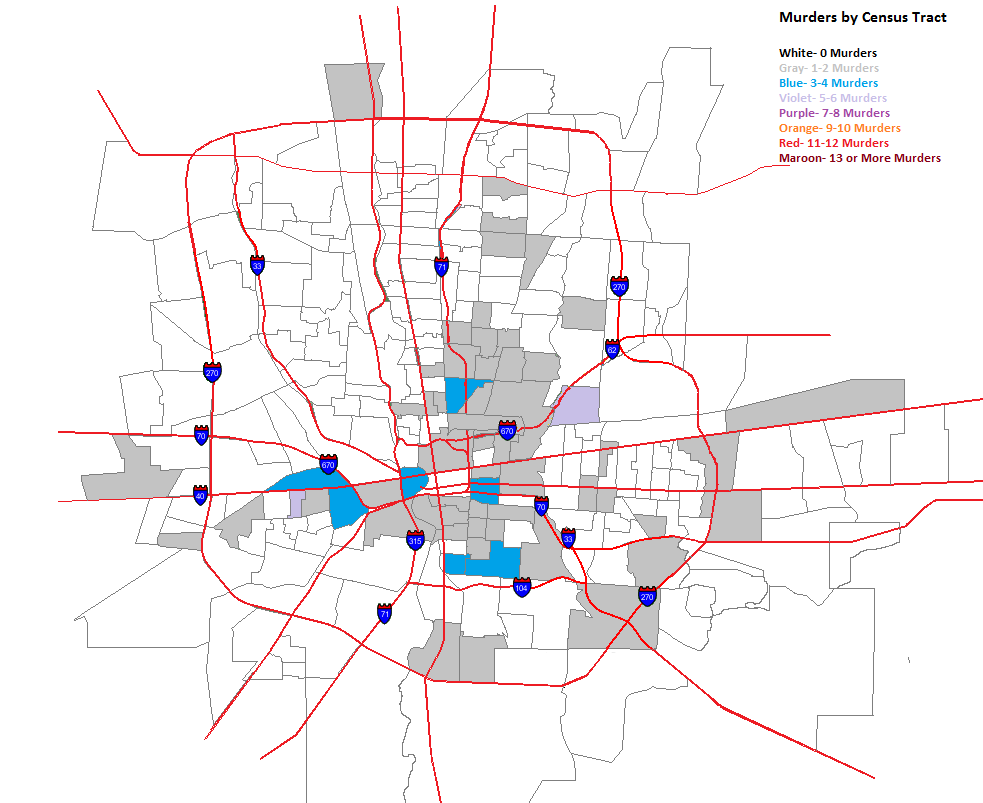
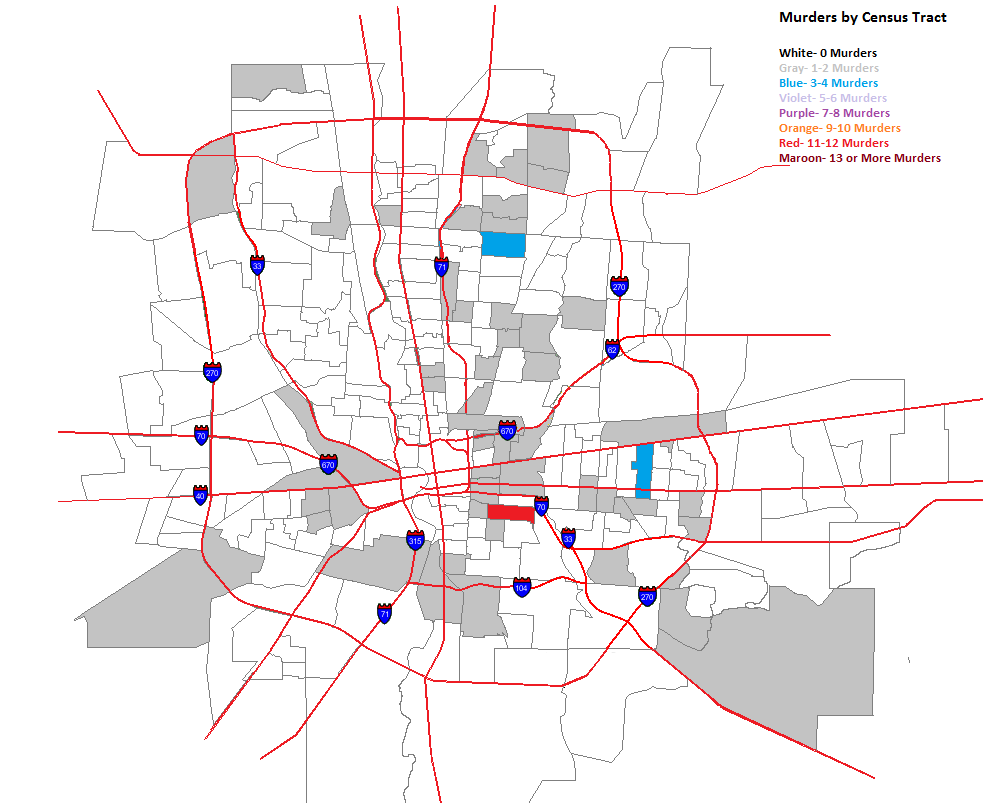
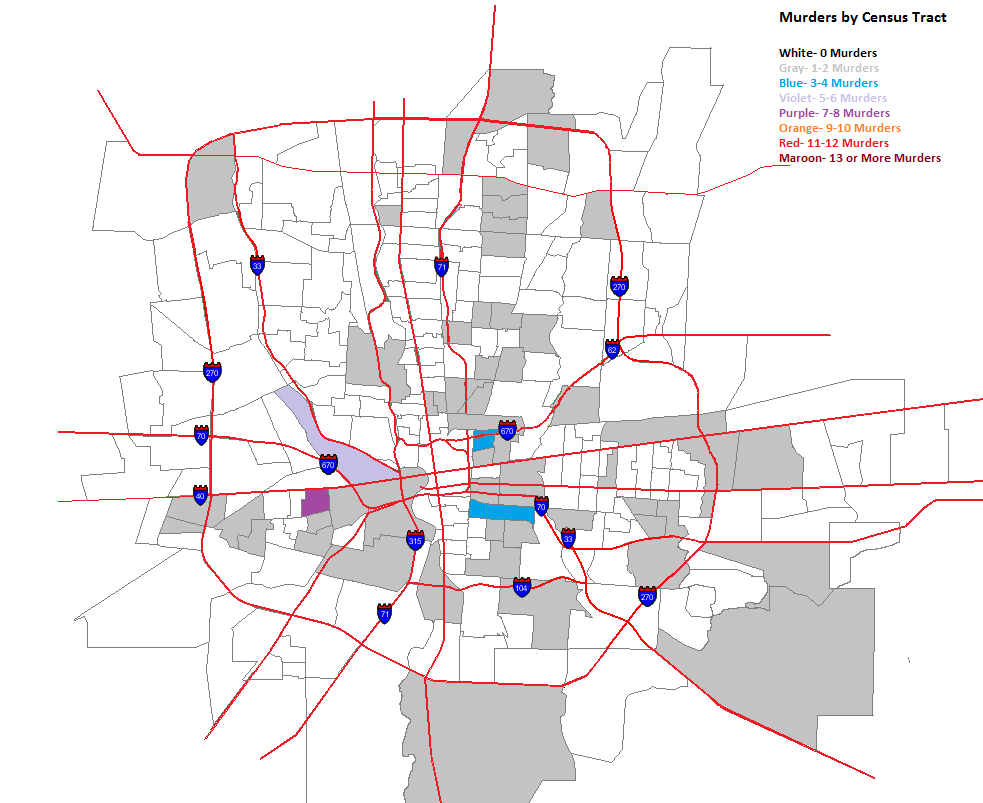
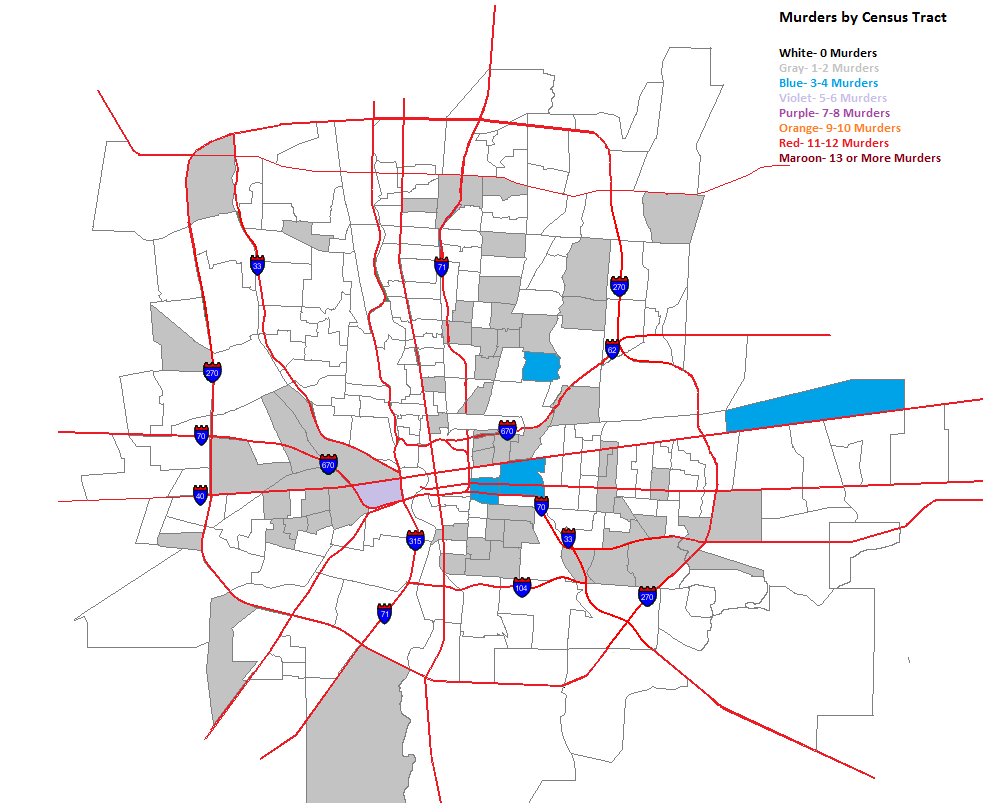
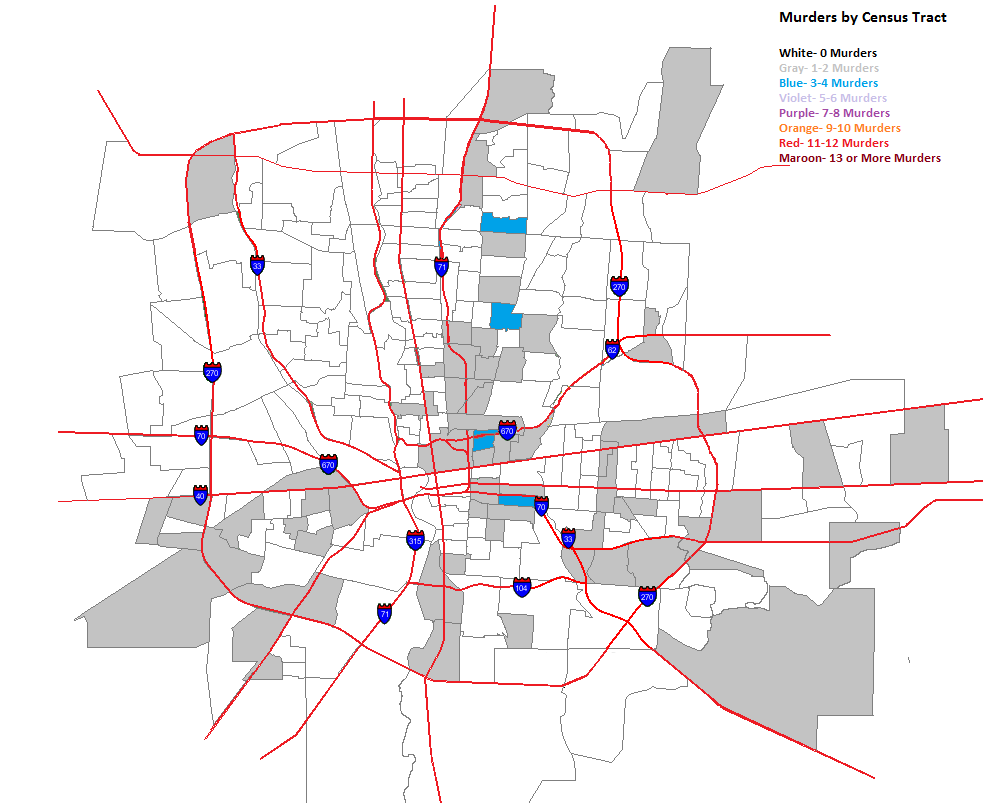
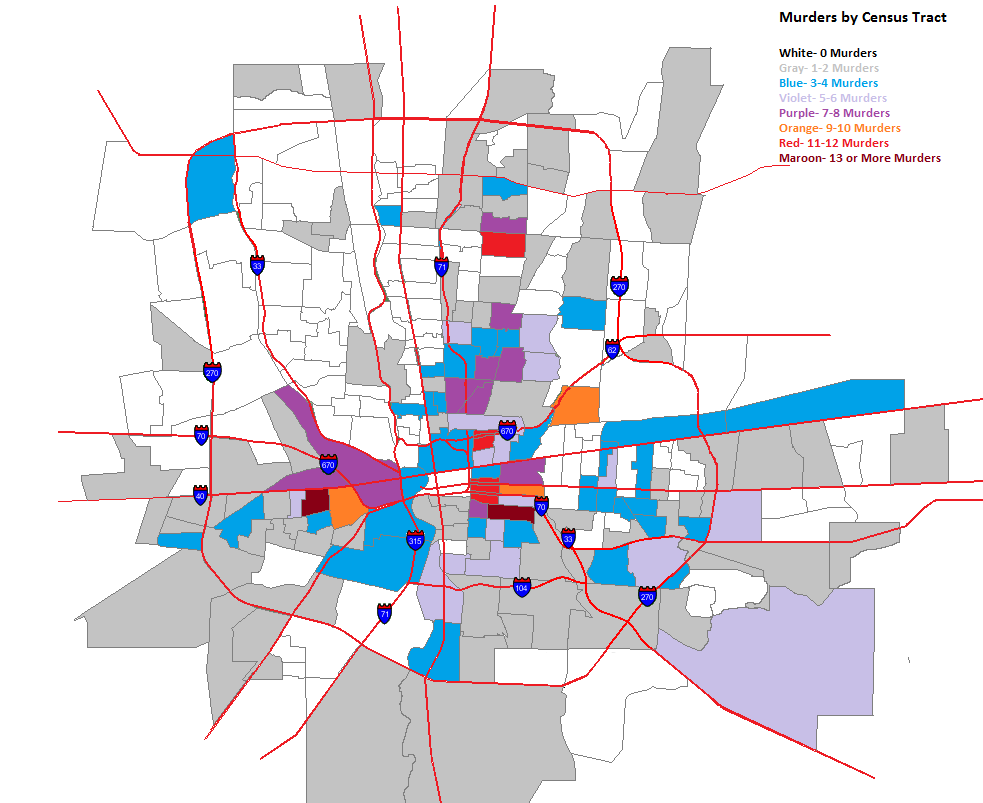
A few days ago, I posted maps for murders by zip code. Because zip codes encompass such large areas, they aren’t as accurate in showing where murders are taking place within them. To help show this more, I broke the maps down into Columbus murders by census tract. While the tracts can include large areas also, they are much smaller than zip codes and allow us to see more at the neighborhood level.
So here they are.
The same forces spreading murder further out into the suburbs in the zip codes seems to be at play in tracts as well. Here are the totals for the entire period.
The High Street corridor from Merion Village up through Worthington has very low or non-existent murder rates. This is also true for most of Whitehall, surprisingly, Bexley, most of the Northwest Side and much of the North Side, apart from the Tamarack Circle area.
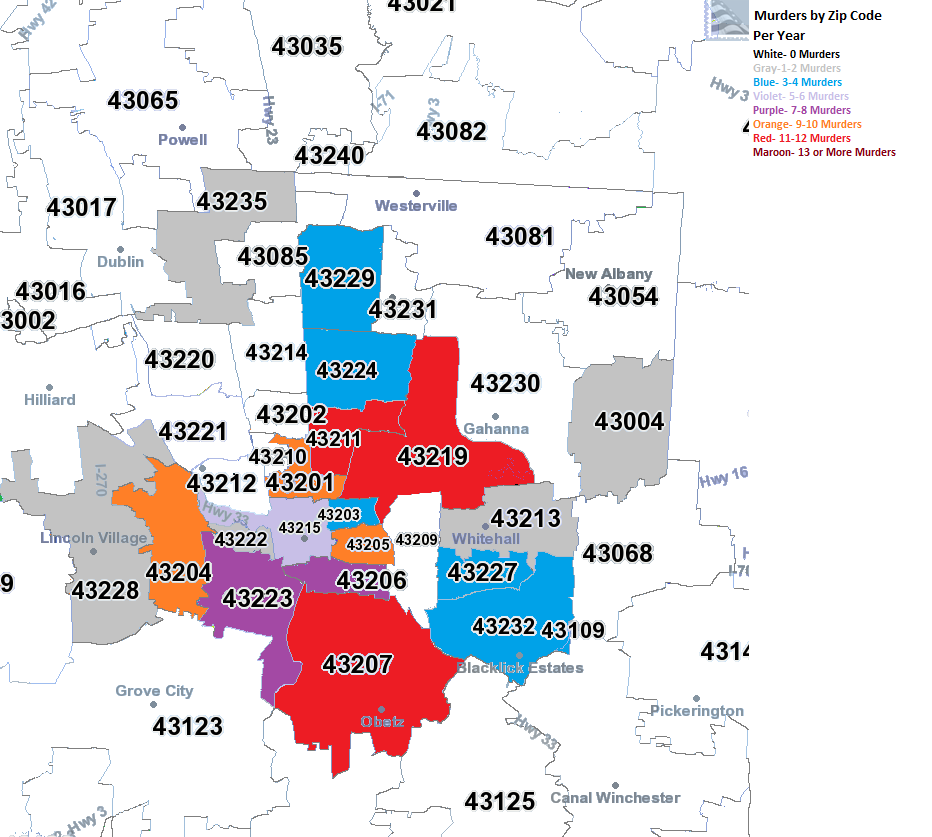
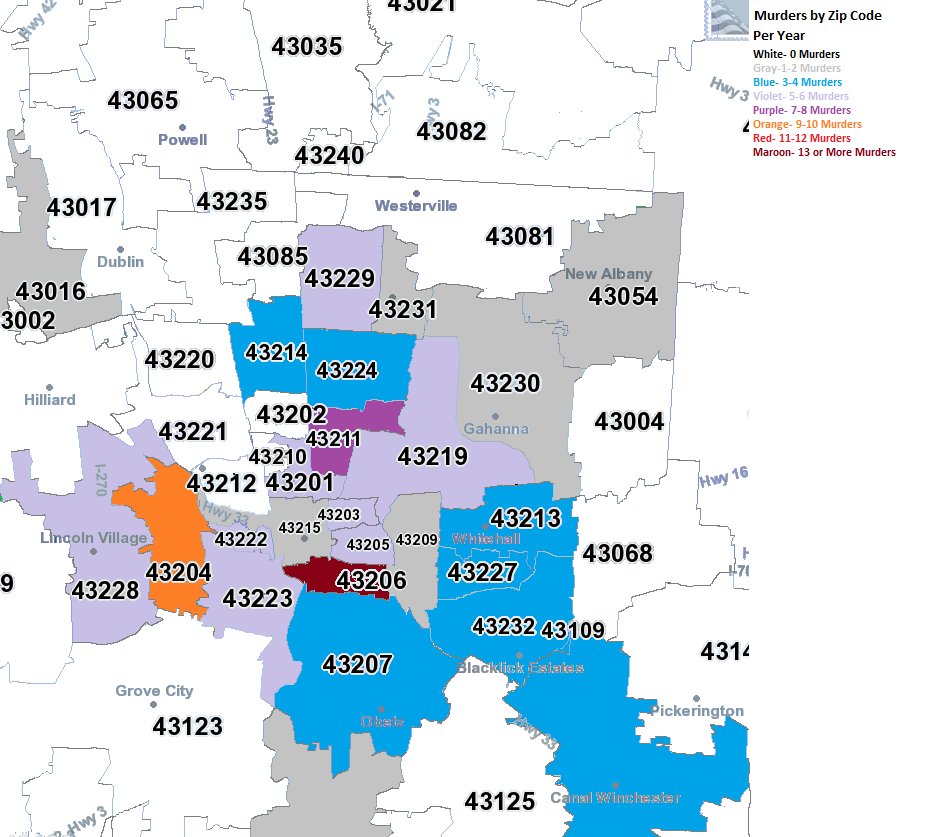
I have been wanting to do these maps for awhile now, as there have been several searches on the site for them and they weren’t available. The maps look at Columbus murders by zip code 2008-2012, highlighting which zip codes have seen the most murders by year and across the period as a whole.
2008 In 2008, almost all murders were contained within the I-270 boundaries. The East and South Sides were the worst areas.
2009 In 2009, there began to be a bit of diffusion on where murder was taking place. While parts of the urban core remained the worst areas, suburban areas also saw the occasional murder.
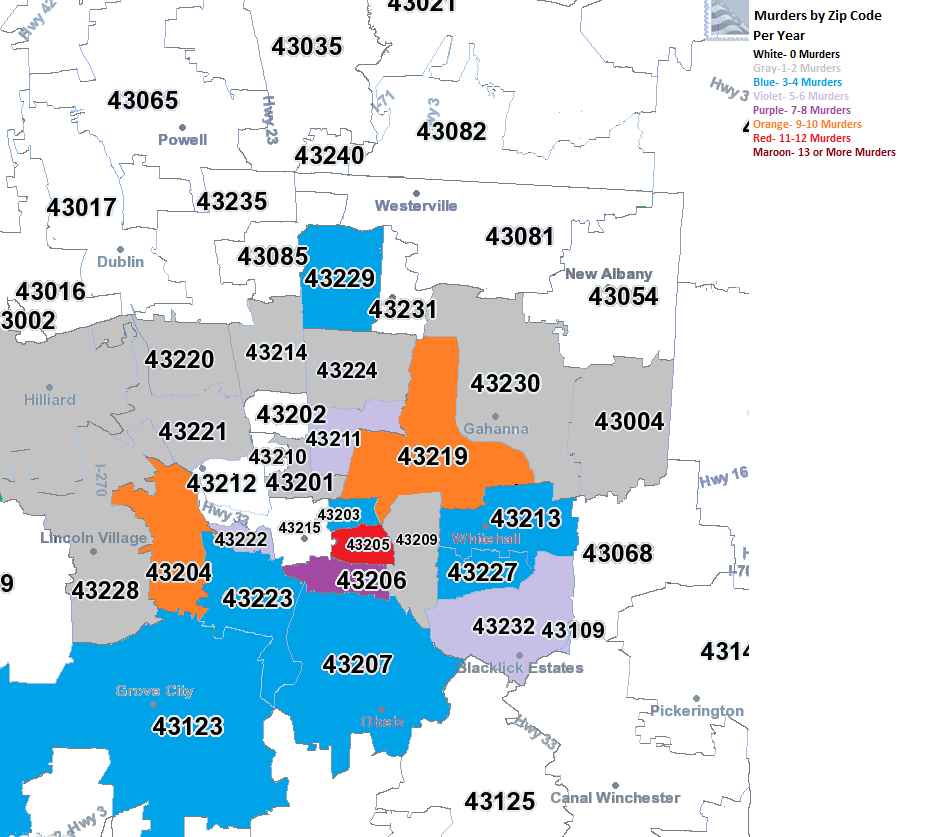
2010 The diffusion continued in 2010.
2011 And in 2011.
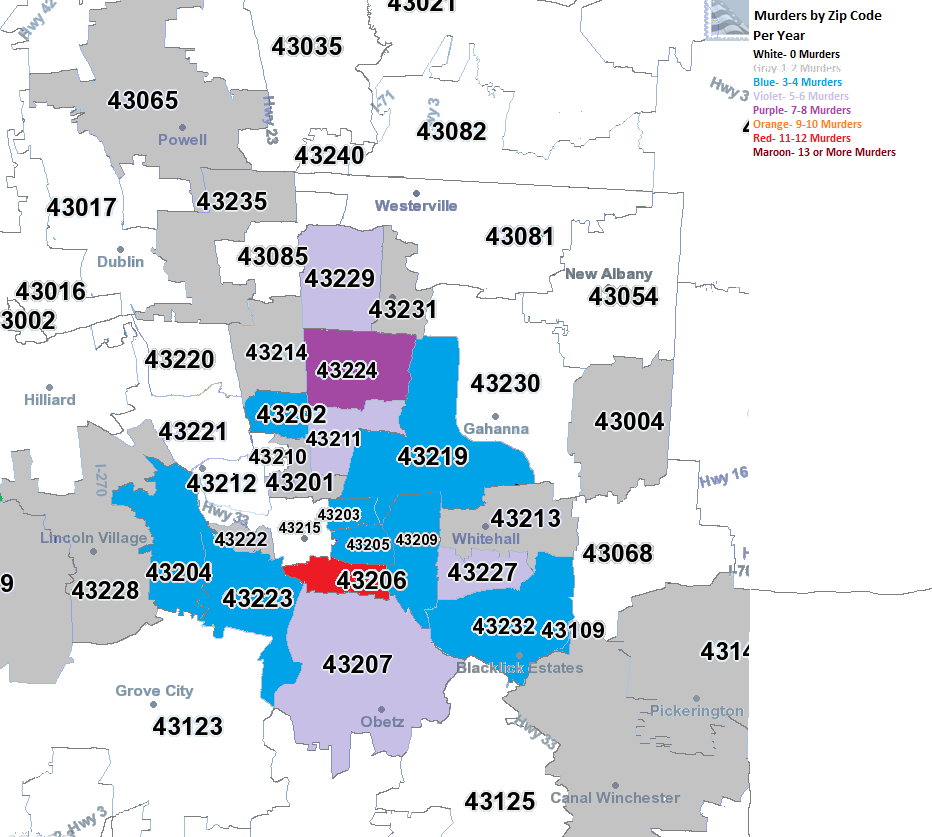
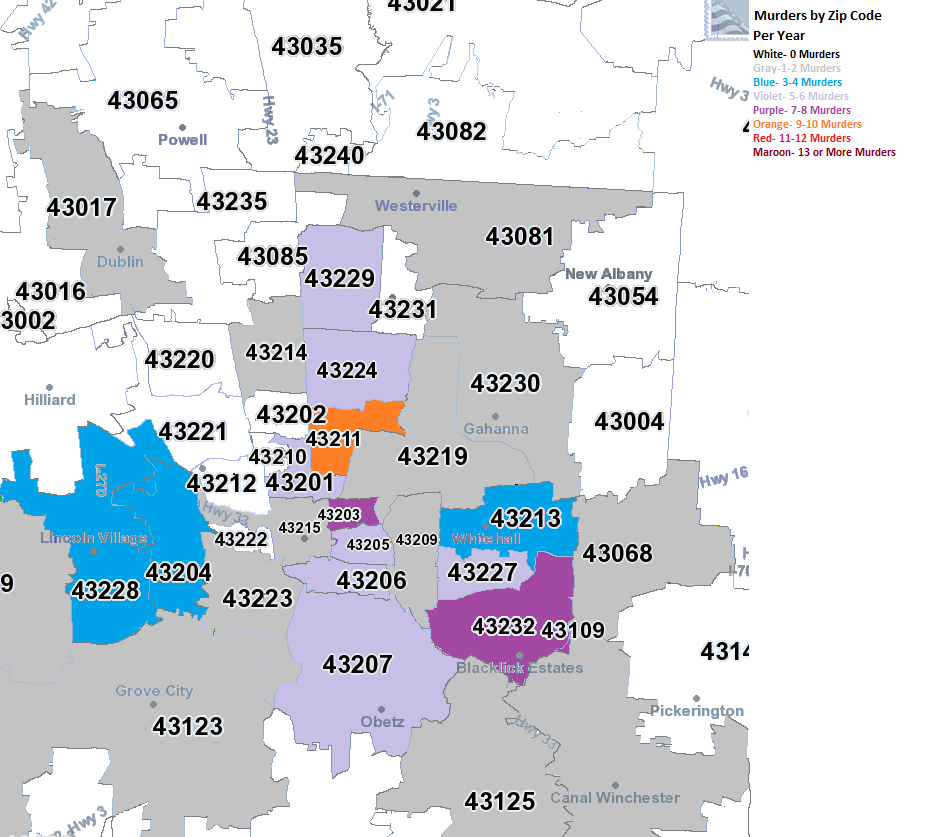
2012 2012 was the most diffuse of all the years, with no heavily concentrated areas, even in the urban core as much. Meanwhile, most of the suburban zip codes within Franklin County saw at least 1 murder.
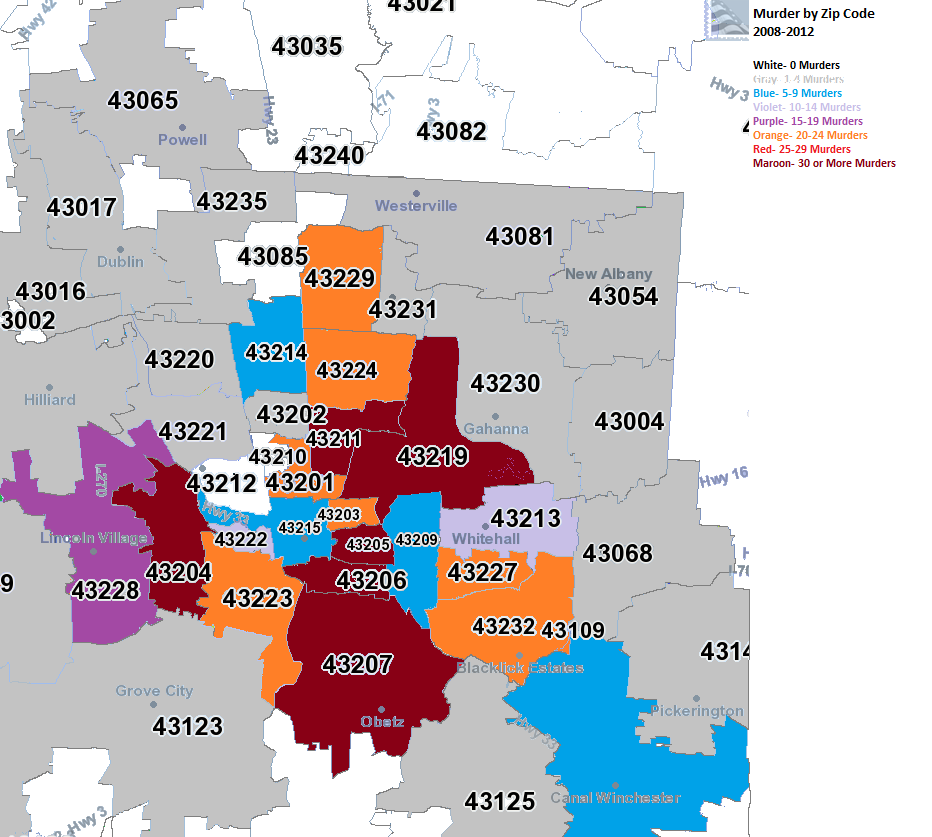
The question is, what do we make of this? This is only a 5-year data set, but it may be supporting evidence for current urban trends. The first trend being that the urban core is rapidly gentrifying in many areas. The second being that poverty is, through economic and development trends, is spreading further out from the core. Concentrated poverty and crime go hand in hand, so while the suburbs may see a bit of increase in crime, the urban core is starting to see less. Something to watch over time to see if such trends continue.
2008-2012 What strikes me about the 5-year map is that Grandview/Upper Arlington have been entirely murder free while every zip around them have had at least one. Also, Downtown is also relatively murder free, as is Bexley and the Clintonville areas.
Of course, zip codes include large areas. What are the neighborhoods that are actually seeing murders and which ones are not? To find out, we’ll have to go down to the tract level. Over the next few days, I’ll post those maps.
This map shows the location of every bike share system in the world. The map gives data on system size, bike availability at stations, station totals and locations. You can even pull up ridership reports and run animations! Columbus will be getting a bike share system that opens in July, so expect it to show up on this map in the coming months!