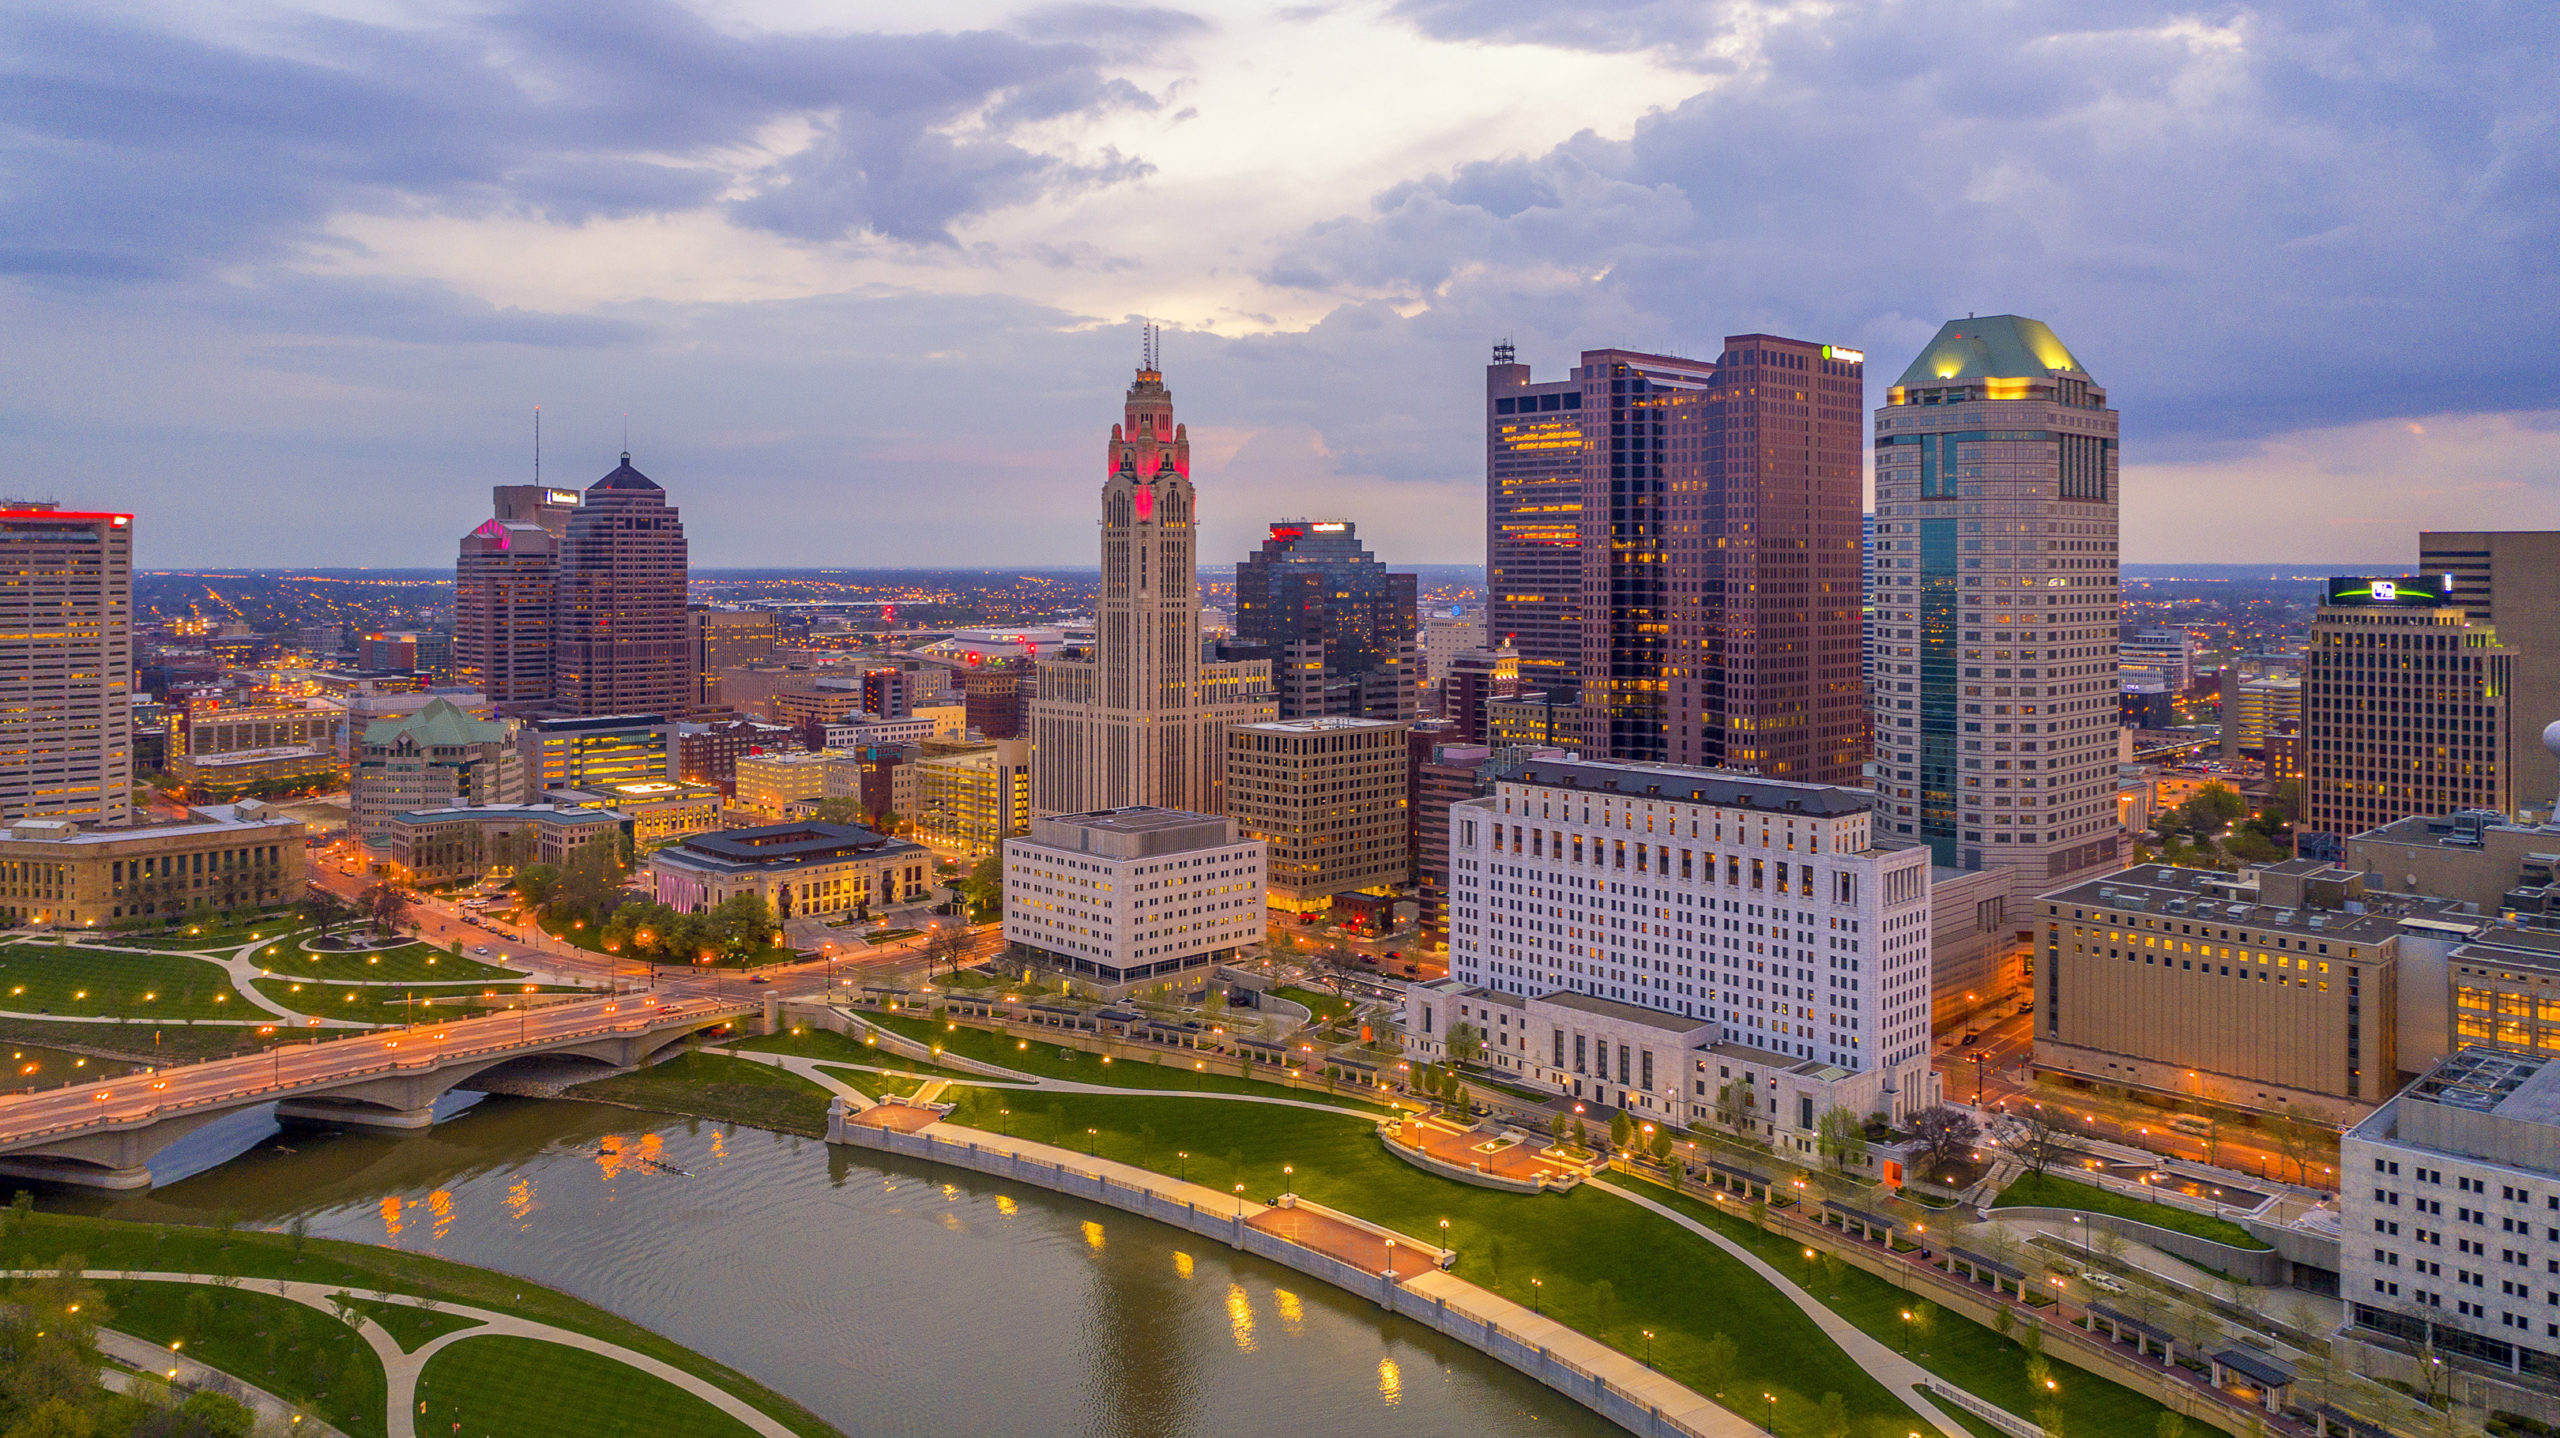
With the latest US Census data for 2020, we can once again take a closer look at how the Downtown area is doing.
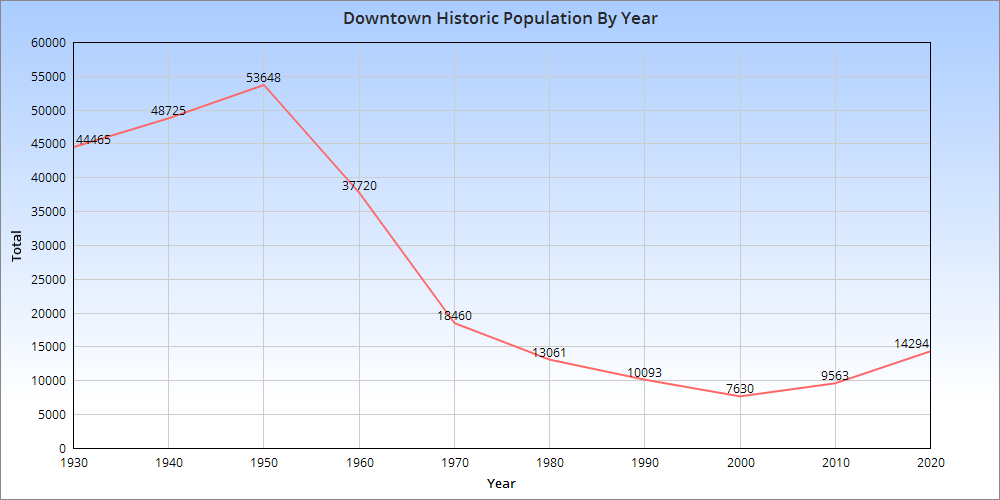
Looking at the graph above, we can see that the Downtown population peaked in 1950 and declined through 2000. The last 20 years have seen accelerating growth and the population was the highest in 2020 since 1970. One caveat with this is that the census tract boundaries that are used to make up this graph have changed some over the years. They haven’t changed significantly, but the area that’s being covered in 2020 is slightly different than it was in 1950. As such, it’s more of an approximation per year rather than exact figures based on the exact same area. Still, the rapid decline after 1950 is well-documented. Highways were either being planned or already under construction through the neighborhood during the 1950s, and this also helped the beginning stages of the suburban flight from the urban core.
The urban core of the city overall reached its population peak in 1950, and the 1950 boundaries represent the oldest, arguably most urban part of the city today. Let’s examine how the population within that boundary changed over the same time.
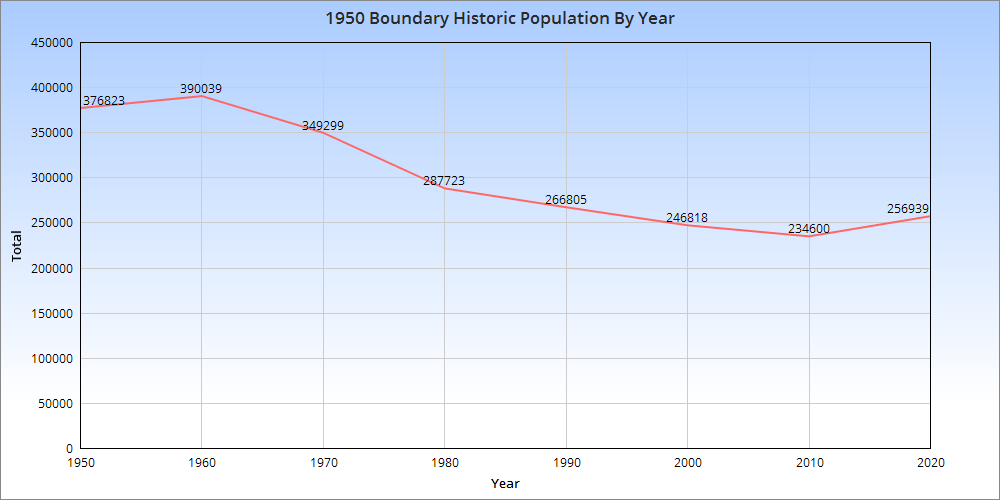
The 1950 boundary peaked in 1960 and then declined through 2010. Between 2010-2020, the 1950 boundary area gained more than 22,000 new residents, a significant increase which puts the area back to where it was around 1995.
So in both cases, the urban core of Columbus is in recovery, though it is unlikely to ever regain its 1950 population. Average household size is much smaller now than it was 70 years ago, so it would require a massive amount of infill that would be far denser than much of what is getting built in recent years. Outdated zoning codes, among other reasons, have been limiting many projects in the urban core from reaching their potential.
Breaking things down a bit further, let’s look at the census tracts that made up the 1950 boundary in 2020 and rank them for population and growth.
1950 Boundary Census Tracts by Population Rank 2010 and 2020
2010————————————2020
1. 1121: 7,300——————–1. 1121: 12,131
2. 13: 6,583———————–2. 49: 5,686
3. 10: 5,830———————–3. 10: 5,613
4. 49: 5,651———————–4. 12: 5,201
5. 43: 5,613———————–5. 47: 5,138
6. 50: 5,205———————–6. 45: 5,048
7. 45: 5,154———————–7. 1810: 4,324
8. 47: 4,971———————–8. 22: 4,279
9. 12: 4,822———————–9. 4002: 4,245
10. 1810: 4,434—————–10. 30: 4,189
11. 55: 4,228———————11. 5: 4,187
12. 5: 4,057———————–12. 220: 4,186
13. 26: 4,028———————13. 1902: 4,063
14. 6: 3,780———————–14. 55: 4,062
15. 220: 3,727——————–15. 1901: 4,059
16. 1110: 3,688——————-16. 17: 3,994
17. 57: 3,629———————-17. 26: 3,920
18. 1902: 3,410——————-18. 6: 3,839
19. 910: 3,409———————19. 1110: 3,751
20. 4610: 3,368——————-20. 57: 3,715
21. 110: 3,344———————21. 910: 3,693
22. 37: 3,303———————-22. 730: 3,629
23. 20: 3,252———————-23: 32: 3,500
24. 120: 3,162———————24. 4301: 3,532
25. 1122: 3,159——————–25. 110: 3,489
26. 310: 3,147———————-26. 37: 3,389
27. 420: 3,139———————-27. 310: 3,377
28. 820: 3,121———————-28. 710: 3,339
29. 30: 3,105———————–29. 2760: 3,331
30. 710: 3,102———————30. 420: 3,316
31. 730: 3,090———————31. 4610: 3,298
32. 2760: 3,066——————-32. 1122: 3,268
33. 53: 3,054———————–33. 20: 3,259
34. 40: 2,941———————–34. 120: 3,220
35: 210: 2,935———————35. 820: 3,193
36. 4810: 2,891——————-36. 2510: 3,144
37. 2510: 2,856——————-37. 52: 3,125
38. 17: 2,704———————–38. 5002: 3,095
39. 4620: 2,659——————–39. 210: 3,049
40. 2520: 2,648——————–40. 1302: 3,039
41. 28: 2,629————————41. 4810: 2,929
42. 4820: 2,589———————42. 1301: 2,903
43. 810: 2,540———————–43. 29: 2,887
44. 410: 2,419———————–44. 2520: 2,784
45. 320: 2,390———————–45. 810: 2,747
46. 720: 2,384———————–46. 5810: 2,719
47. 330: 2,314———————–47. 4820: 2,685
48. 1820: 2,598———————-48. 53: 2,676
49. 52: 2,584————————-49. 4620: 2,609
50. 5810: 2,548———————-50. 720: 2,583
51. 59: 2,546————————-51. 2750: 2,554
52. 2780: 2,423———————-52. 51: 2,548
53. 61: 2,398————————-53. 61: 2,534
54. 29: 2,368————————-54. 320: 2,505
55. 2750: 2,349———————-55. 1820: 2,478
56. 60: 2,345————————-56. 28: 2,461
57. 2740: 2,316———————-57. 21: 2,456
58. 5820: 2,230———————-58. 2740: 2,447
59. 5420: 2,151———————-59. 410: 2,439
60. 32: 2,147————————-60. 330: 2,427
61. 2730: 2,104———————-61. 5620: 2,422
62. 920: 2,069————————62. 16: 2,399
63. 15: 2,031————————-63. 59: 2,365
64. 1901: 2,031———————-64. 2780: 2,353
65. 2770: 1,995———————-65. 2770: 2,300
66. 51: 1,928————————–66. 60: 2,224
67. 38: 1,896————————–67. 920: 2,209
68. 2710: 1,858———————-68. 2730: 2,183
69. 22: 1,851————————-69. 5820: 2,127
70. 21: 1,808————————-70. 38: 2,105
71. 5610: 1,784———————-71. 15: 2,092
72. 16: 1,682————————-72. 5420: 2,082
73. 14: 1,543————————-73. 36: 2,039
74. 23: 1,453————————-74. 2710: 1,908
75. 36: 1,442————————-75. 4302: 1,740
76. 42: 1,370————————-76. 5001: 1,647
77. 5410: 1,362———————-77. 5610: 1,646 ———————————————78. 14: 1,531
——————————————79. 23: 1,503
——————————————80. 5410: 1,418
——————————————81. 4001: 1,253
——————————————82. 42: 1,107
The color coding is Green: Growing since 2010, Red: Declining since 2010, and Pink: New Tracts that did not exist in 2010. New tracts: 13 became 1301 and 1302, 40 became 4001 and 4002, 43 became 4301 and 4302, 50 became 5001 and 5002.
Top 10 Fastest-Growing 1950 Boundary Census Tracts by Total 2010-2020
1. 1121: +4,831
The tract is the main OSU Campus. The explosive growth is mostly due to the recent requirement that sophomores also have to now live on Campus, prompting thousands of students to move to the tract from nearby neighborhoods.
2. 4002: +2,592
This new tract was split off of Tract 40 and includes the southwest area of Downtown, including RiverSouth.
3. 22: +2,428
This tract is the heart of Italian Village and includes the large, new Jeffrey Park development.
4. 1901: +2,028
Includes the 5th Avenue corridor to just east of 5thxNW.
5. 32: +1,353
This tract covers the southern part of Victorian Village/Harrison West, as well as the far western sections of the Arena District where the new White Castle HQ complex is.
6. 17: +1,290
Western Weinland Park, which has seen rapid revitalization in recent years.
7. 30: +1,084
This area includes all of the norther half of Downtown north of Broad Street and west to Neil Avenue in the Arena District.
8. 16: +717
Eastern Weinland Park, which has seen hundreds of new housing units constructed along and near Grant Avenue.
9. 1902: +653
Includes the 5th Avenue corridor through 5thxNW.
10. 21: +648
The heart of the High Street strip in the Short North continued to add people. It reached its highest population in 60 years.
Top 10 Tracts with the Highest Population Densities in 2020
1. 1121: 34,888.8
2. 1810: 28,351.1
3. 1302: 24,740.7
4. 1301: 20,549.1
5. 17: 20,158.6
6. 12: 20,069.6
7. 1110: 18,353.2
8. 10: 16,260.2
9. 16: 12,675.6
10. 21: 12,196.7
All of these tracts are either in the Short North or surrounding Ohio State’s campus. They include the highest densities anywhere in Ohio.
So there you have it. The urban core of Columbus is clearly on a positive path. So long as infill development continues, population growth should also continue to increase. Perhaps someday, this increasing population and density may facilitate the construction of more amenities, including rail lines, BRT and more biking infrastructure, all of which lags in the area.
To see Census Tract data in map form, the Census Tract Maps page provides it.