A severe 1913 hailstorm hit parts of the South Side on that Wednesday afternoon. In an issue of The Democratic Banner out of Mt. Vernon, the headline on July 11th read “Streets Covered with Ice Boulders: Destruction Wrought by Hail Storm at Columbus.”
The article went on: This city was visited by probably the most disastrous hailstorm in its history. The damage to crops and buildings in this immediate vicinity is estimated conservatively at $125,000. (About $3.1 million today). South Side florists alone report losses of approximately $50,000. In hundreds of houses practically every window was broken. The ground on the South Side was covered by a thick layer of “ice boulders” for an hour or two afterwards. As a midsummer phenomenon it probably was without a parallel in this state.
Accompanied by 45 mph winds, the hail that fell was reported to be about 3″ in diameter. The hail was large enough to hit and fracture the wrist of J.W. Sprouse, a teamster, and shattered glass from a greenhouse was driven through the arm of William Bernard, a florist.
For this update, I’m going to do things a bit differently. In previous updates, I have done long ranking lists and it got to be a bit overwhelming. So starting with this update, I’m going to do more charts instead.
In any case, August continued the year-long trend of home sales being down, with the month coming in at more than 11% off from the same time last year. Prices, however, were up more than 6% to reach a monthly record. There continues to be a supply problem, which is the main mechanism driving both lower sales and higher prices.
June’s housing data for the Columbus region was just released. The month continued the same story as the previous 5 months, with home sales down due to a lack of inventory. Prices continued to rise and the number of days to sell a home continued to fall in relation to this problem. As always, I looked at 21 major areas of the Columbus region, both urban and suburban. Here is how those areas performed.
Top 10 June 2014 Sales Totals 1. Columbus: 1,045 2. Upper Arlington: 109 3. Dublin: 108 4. Clintonville: 83 5. Westerville: 77 6. Gahanna: 63 7. Grove City: 62 8. Reynoldsburg: 59 9. New Albany: 38
Top 10 June 2014 Sales Increases over June 2013 1. Downtown: +72.0% 2. Grove City: +14.5% 3. Gahanna: +12.7% 4. German Village: +10.5% 5. Grandview Heights: +6.3% 6. Canal Winchester: +3.8% 7. Hilliard: 0.0% 8. Minerva Park: 0.0% 9. Columbus: -1.8% 10. Reynoldsburg: -5.1%
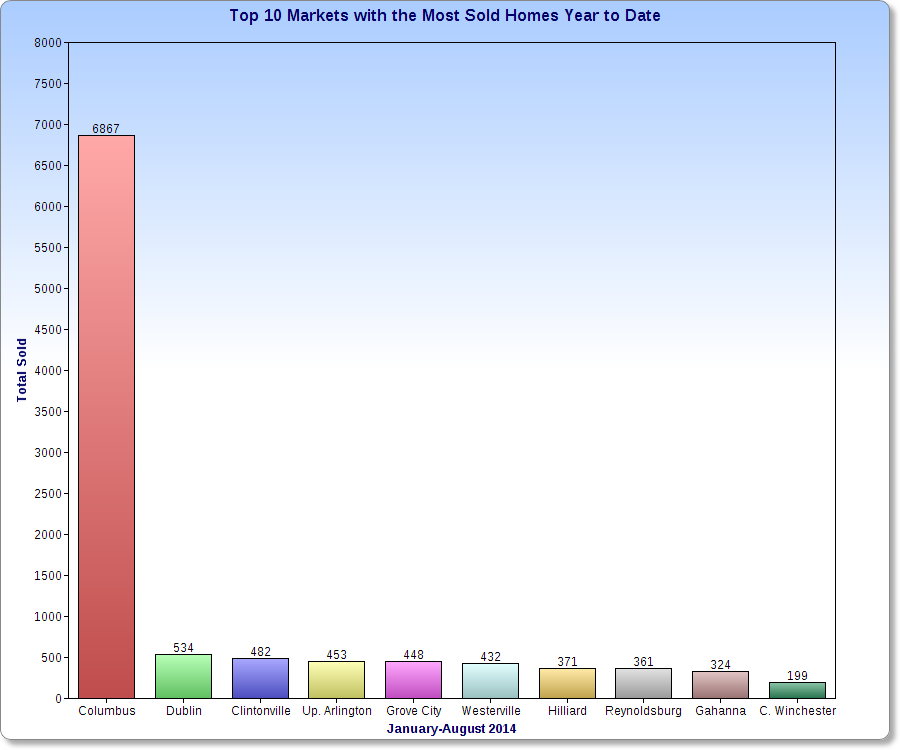
Top 10 Year-to-Date Sales Through June 2014 1. Columbus: 4,803 2. Dublin: 362 3. Grove City: 332 4. Clintonville: 323 5. Westerville: 299 6. Upper Arlington: 294 7. Reynoldsburg: 265 8. Hilliard: 258 9. Gahanna: 221 10. Pickerington: 136
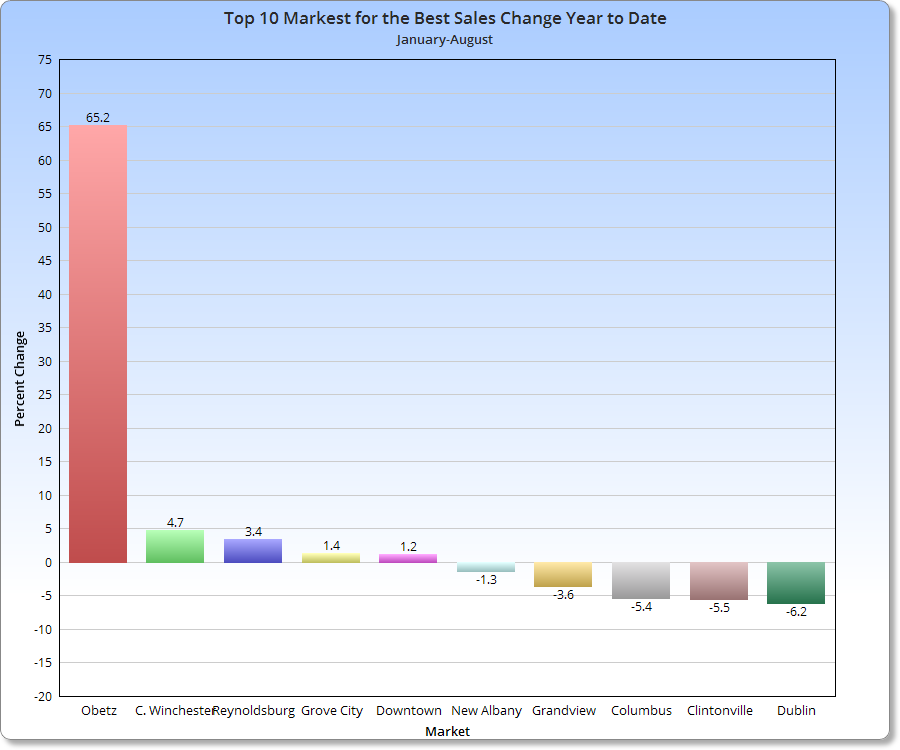
Top 10 Year-to-Date Increases Through June 2014 Over 2013 1. Obetz: +42.1% 2. Downtown: +13.4% 3. Grove City: +11.0% 4. New Albany: +2.8% 5. Reynoldsburg: -0.4% 6. Westerville: -3.2% 7. Pataskala: -3.4% 8. German Village: -3.9% 9. Columbus: -5.3% 10. Clintonville: -5.8%
Average Sales June 2014 Urban: 122.3 Suburban: 55.1 Urban without Columbus: 30
Average % Change June 2014 vs. June 2013 Urban: -5.8% Suburban: -5.1% Urban without Columbus: -6.0%
Average YTD Sales Through June 2014 Urban: 545 Suburban: 222.6 Urban without Columbus: 119.2
Average YTD % Change YTD Through June 2014 Urban: -4.8% Suburban: -5.3% Urban without Columbus: -4.7%
Top 10 Average Sales Price June 2014 1. New Albany: $659,186 2. Upper Arlington: $389,575 3. Bexley: $382,496 4. Dublin: $377,541 5. German Village: $307,753 6. Downtown: $300,582 7. Worthington: $283,209 8. Grandview Heights: $246,271 9. Hilliard: $230,396 10. Gahanna: $229,845
Top 10 Average Sales Price % Change June 2014 vs. June 2013 1. Whitehall: +55.6% 2. Worthington: +17.7% 3. New Albany: +15.8% 4. Bexley: +15.6% 5. Columbus: +12.2% 6. Clintonville: +9.3% 7. Hilliard: +8.5% 8. Canal Winchester: +7.4% 9. Pickerington: +6.7% 10. Gahanna: +6.4%
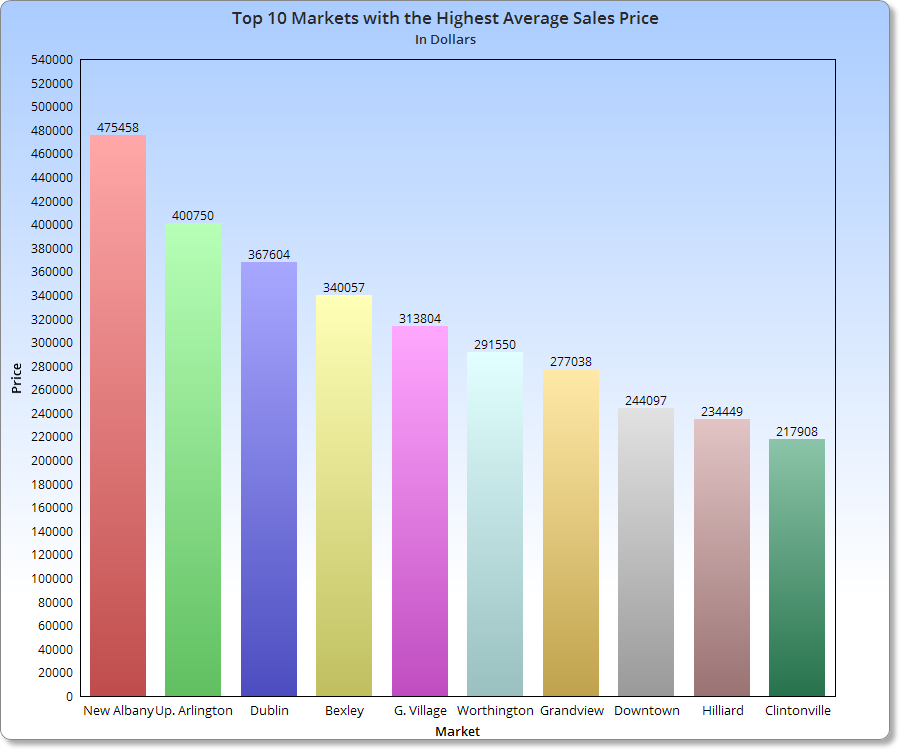
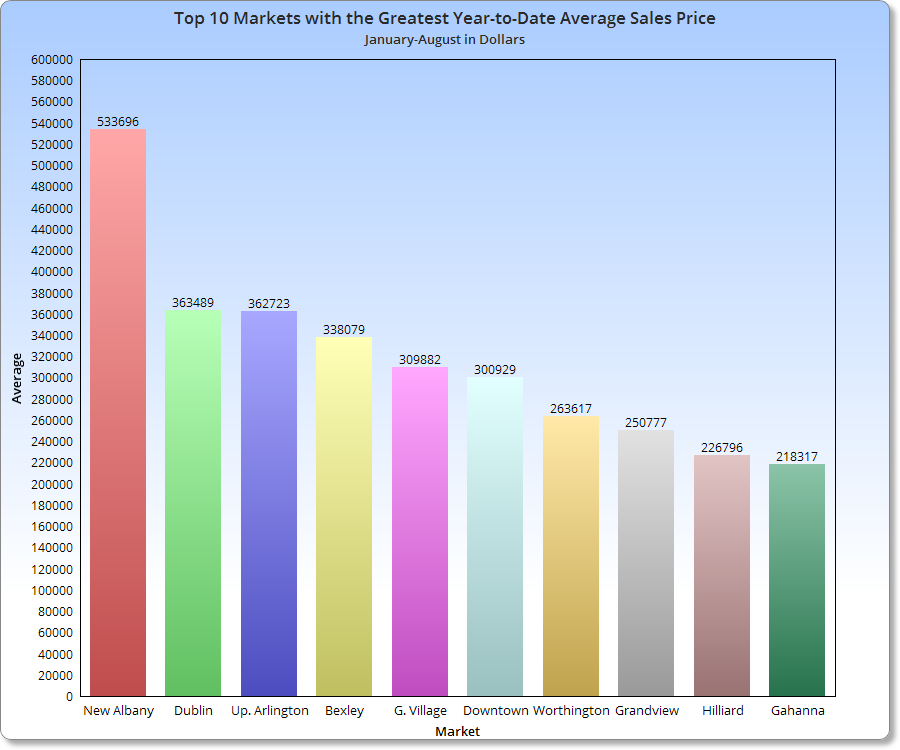
Top 10 Average Sales Prices YTD Through June 2014 1. New Albany: $541,077 2. Dublin: $360,202 3. Upper Arlington: $348,160 4. Bexley: $334,491 5. Downtown: $305,215 6. German Village: $302,117 7. Worthington: $261,659 8. Grandview Heights: $245,946 9. Hilliard: $225,849 10. Gahanna: $213,782
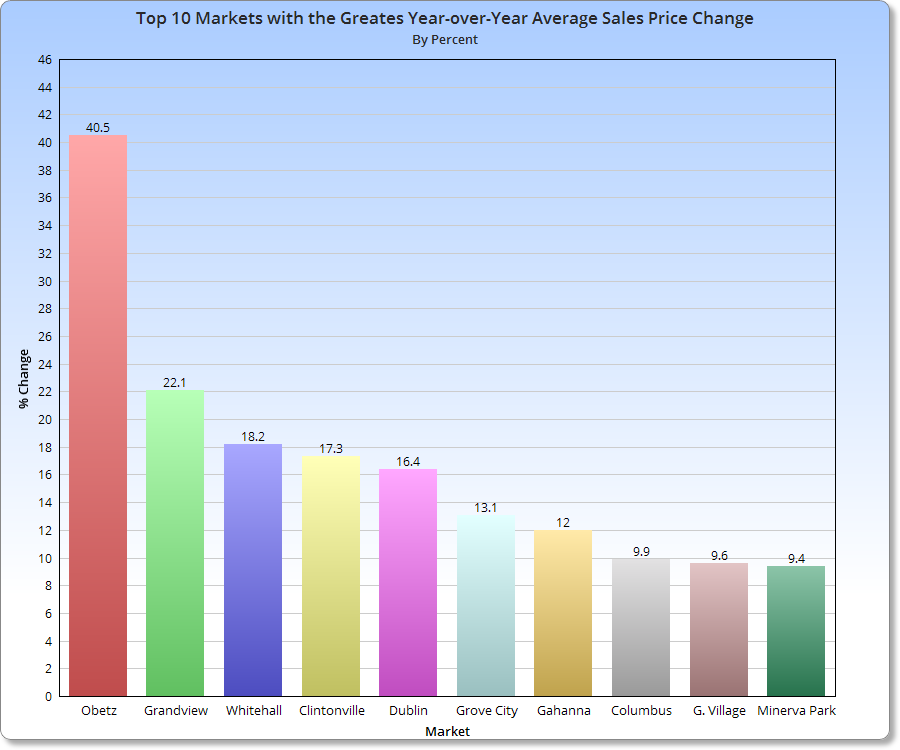
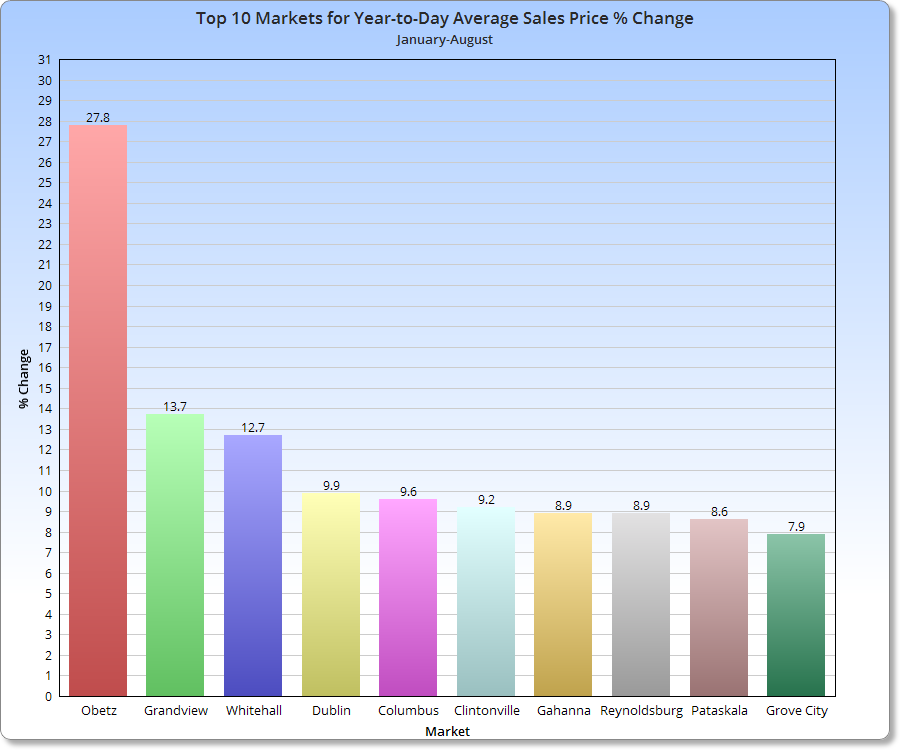
Top 10 Average YTD Sales Price % Change Through June 2014 vs. 2013 1. Obetz: +24.7% 2. Grandview Heights: +15.5% 3. Worthington: +11.3% 4. Pataskala: +10.8% 5. Columbus: +10.6% 6. Pickerington: +9.9% 7. Canal Winchester: +9.5% 8. Downtown: +9.5% 9. Dublin: +9.2% 10. Westerville: +8.5%
Average Sales Price June 2014 Urban: $232,965 Suburban: $253,488 Urban without Columbus: $240,917
Average Sales Price Change June 2014 vs. June 2013 Urban: +7.6% Suburban: +5.0% Urban without Columbus: +7.1%
Average Sales Price YTD Through June 2014 Urban: $220,893 Suburban: $234,492 Urban without Columbus: $229,327
Average Sales Price % Change YTD Through June 2014 Urban: +6.6% Suburban: +7.5% Urban without Columbus: +6.2%
Top 10 Fastest Selling Markets June 2014 (Based on Average # of Days for Listings to Sell) 1. Worthington: 21 2. Upper Arlington: 36 3. Clintonville: 38 4. Gahanna: 39 5. Hilliard: 39 6. Dublin: 40 7. German Village: 42 8. Obetz: 45 9. Bexley: 46 10. Pataskala, Westerville: 47
Average # of Days Before Sale, June 2014 Urban: 47.8 Suburban: 54.3 Urban without Columbus: 47.3
Average # of Days Before Sale YTD Through June 2014 Urban: 58.6 Suburban: 67.8 Urban without Columbus: 57.4
Top 10 Lowest Market Housing Supplies June 2014 (Based on # of Months to Sell all Listings) 1. Grandview Heights: 1.0 2. Worthington: 1.4 3. Westerville: 2.0 4. Clintonville: 2.1 5. German Village: 2.1 6. Gahanna: 2.3 7. Hilliard: 2.5 8. Minerva Park: 2.7 9. Obetz: 2.7 10. Upper Arlington: 2.7
A healthy housing supply is considered to be around 5-6 months. Anything less than 3 months is considered very low. Grandview’s 1 month is ridiculously low and the lowest reading I’ve seen for any area.
Average # of Months to Sell All Listings, June 2014 Urban: 2.7 Suburban: 3.5 Urban without Columbus: 2.6
Average % Change of Single-Family Home Sales June 2014 vs. June 2013 Urban: +33.2% Suburban: -5.4% Urban without Columbus: +36.8%
Average % Change of Single-Family Home Sales YTD Through June 2014 vs. YTD 2013 Urban: -8.8% Suburban: -5.4% Urban without Columbus: -8.9%
Average % Change of Condo Sales June 2014 vs. June 2013 Urban: -4.0% Suburban: +41.0% Urban without Columbus: -5.0%
Average % Change of Condo Sales YTD Through June 2014 vs. YTD 2013 Urban: +19.3% Suburban: +7.0% Urban without Columbus: +21.0%
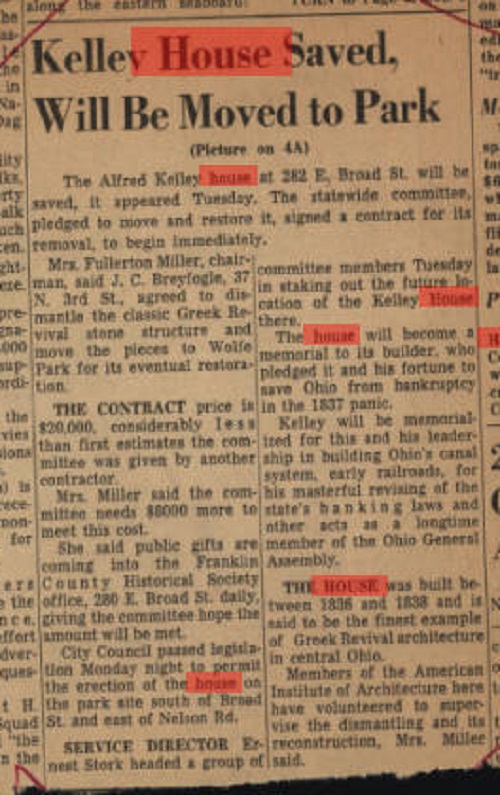
In my research into finding photos and information on historic buildings in Columbus, I have come across some interesting documents related to why some buildings were demolished and how 1960s preservation efforts were often failtures. Take the Alfred E. Kelley House, which once stood at 282 E. Broad Street. Built over the course of about a year between 1837-1838, the house was a classic Greek Revival. Over the many years of its existence, the house functioned in multiple capacities, including as a school. During those other uses, the architecture was drastically altered, and by 1960, the year the house was proposed to be demolished to build the Christopher Inn, the historic nature had been “severely damaged”. Still, the house had survived 122 years by then, and a history-minded group of people got together to try and save it with the intent of restoration and operating a period museum.
Photo taken in 1898.
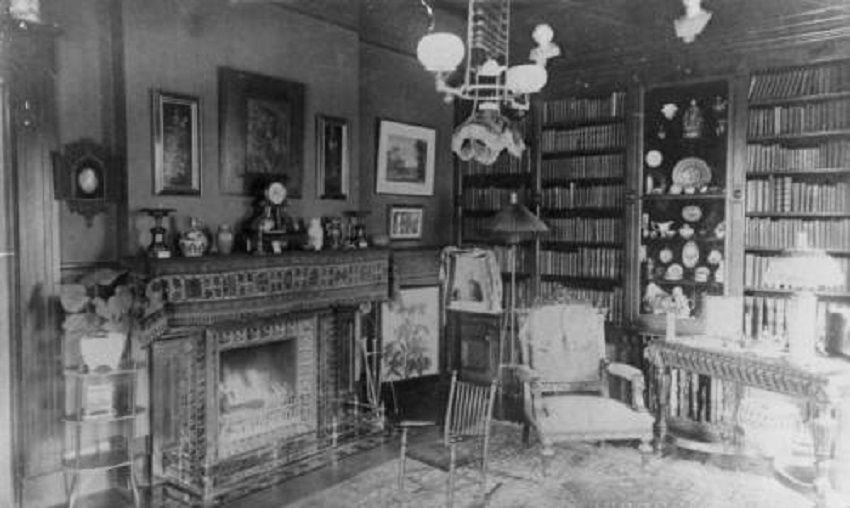
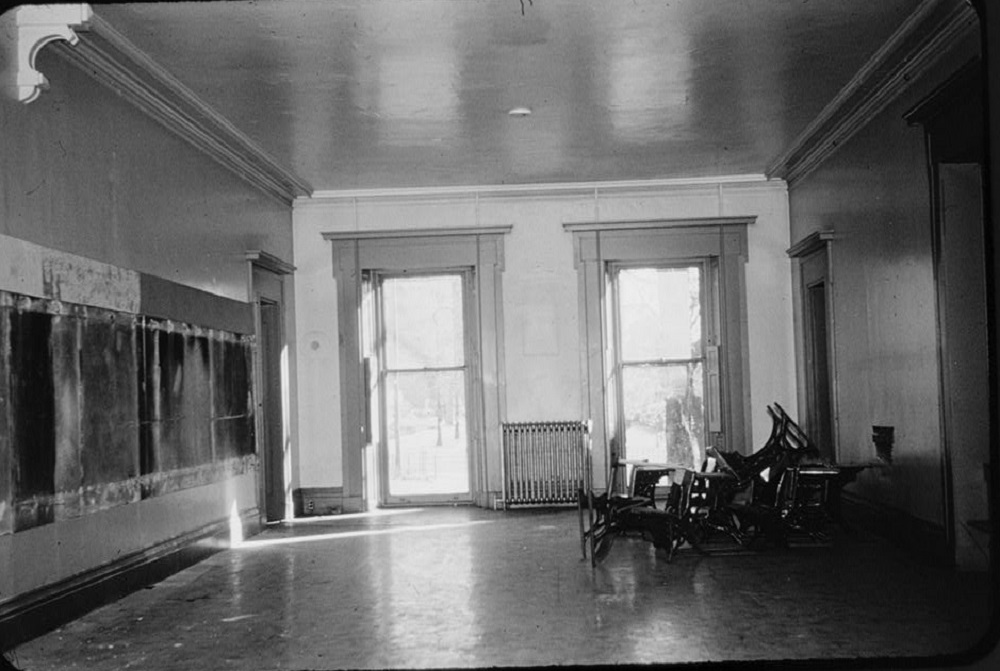
The library in the Kelley House, circa 1900.
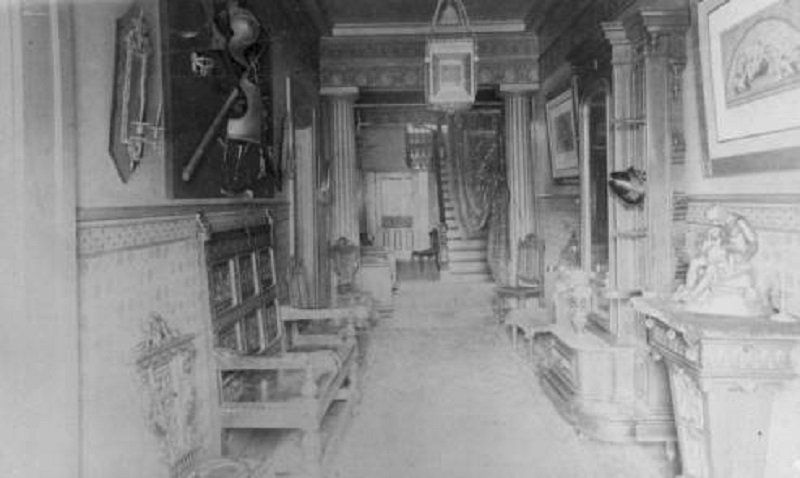
An elaborately decorated hallway in the Kelley House circa 1900.
The gutted house in 1958.
In early January 1962, the efforts to save the house during the previous year were detailed by one Dixie Sayre Miller, chairman of the Kelley House Committee, which had been formed on March 24th, 1961. The goal of the committee was as follows:
“Considering the time element and the importance of Kelley to the State**, the committee decided to ask the legislature for money for which to move the house intact. We, later, would seek private money with which to restore it.”
The Committee had some powerful allies at the time. State Rep. Chris McNamara and John Vorys, former delegate to the UN, were both in leadership roles. Given this, even during a time when preservation efforts took a clear backseat to development, the Committee did meet with some initial success. The Kelley House legislative subcommittee was able to pass an appropriations bill in July 1961 for the amount of $95,000. The governor vetoed the bill, calling the appropriation “frivolous”. In August, a member of the Committee, Lee Skilken, had the idea to solicit local contractors to volunteer in taking down the house in order for it to be moved. When the idea was presented to the property owners on September 5th, it was rejected because it could not be guaranteed that the property would be clear in time for construction to begin. Instead, the owners wanted a paid contractor to do the work so that the timeline could be met. The land had to be cleared by October 15th, 1961, and the Committee had to have the money to pay the contractor by September 15th.
Here is where the story becomes a bit shady and political. On September 6th, members of the committee went to the Governor for advice on how to proceed. He recommended that they go to the Emergency Board, which would be able to issue a grant towards the project. The Governor promised he would “not object, would not fight it and would not make a political issue of it”. On September 15th, the money deadline, the Committee had raised only $11,000 towards the $35,000 cost of the paid contractor. However, the following day, they caught a break. Another contractor came forward offering to take down the house for just $20,000 and would begin immediately. Further, even though the Committee did not have the full $20,000, the contractor trusted that the Committee would have raised the amount by the time the work was completed. I’m not sure if such deals would ever occur in today’s environment, but they still happened 53 years ago. Only 2 days after the contractor began to take down the house, the Emergency Board awarded a $20,000 grant to the Committee and the house was fully dismantled before the deadline of October 15th. Stonework and foundations of the house were moved to a holding site at Franklin Park, while interior detailing was stored “in a city building”, all waiting for funding to be assembled and restored at a new site. This new site was listed as being in Wolfe Park on “East Broad at Nelson Road”.
So, why isn’t the Alfred E. Kelley house at Wolfe Park today? Two things happened after October 15th. First, the Governor lied. On the very day that the Committee was supposed to pay the contractor, they received a call stating that the Governor had deemed the Emergency Board grant unconstitutional and was withholding the money, despite being his recommendation that the Committee seek the grant from it in the first place. This also after a promise that he would not interfere or stand in the way. The Committee considered legal action, but decided a costly court process was not “advisable”.
Without the $20,000, the Committee was only able to pay the contractor $6,000, who then threatened legal action for the full amount. Since the Committee had neglected to be incorporated, each member was personally responsible for a share of what was owed. By December 1961, the Committee had become incorporated and had managed to pay an additional $2,000, but still owed the majority of the contract.
That concluded the events through January 1962. After that time, there are mysteries that remain unknown (at least as far as I can tell). First, what happened to the Committee? Did it end up raising the amount to pay off the contractor or did they end up in court? Why had the Governor decided to prevent the Committee from getting the grant? Did he have a political axe to grind with members of the Committee? Finally, and far more importantly, what happened to the Kelley House? The materials were in storage in early 1962, but the house was never rebuilt. Were they destroyed? Did the contractor take possession of them if the Committee was unable to pay? Are they still sitting in some warehouse somewhere covered in half a century’s worth of dust? We may never know, though I suspect that someone out there has the answers.
An ironic article in 1961.
**Kelley helped save the state from bankruptcy during the Panic of 1837 by offering up his house, possessions and business interests as collateral.
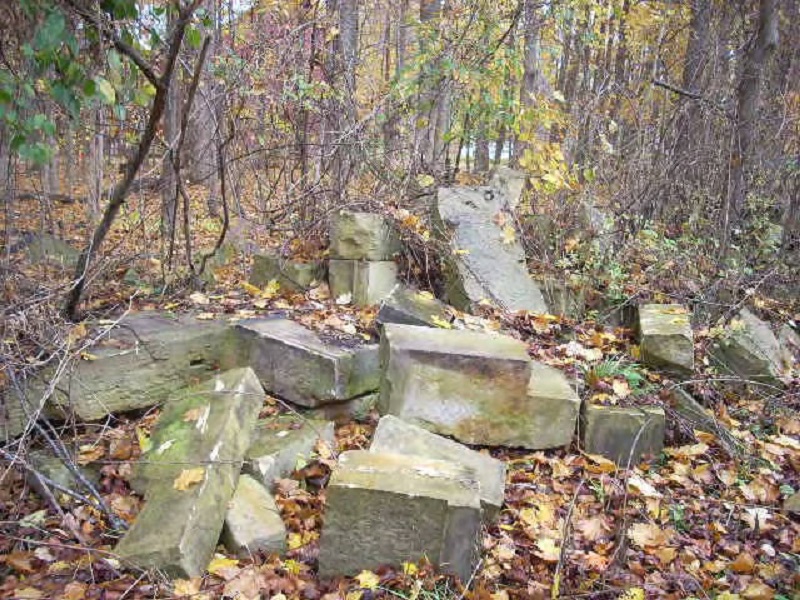
Edit 7/18/2014: I guess research pays off, and now, at least some of the mystery is solved, as contacts through readers led me to part of the answer. As mentioned above, part of the house’s remains, particularly the stone and brick portions, were stored at Franklin Park after the demolition in 1961. Five years later in 1966, these were moved to the Ohio Exposition Center at the Ohio State Fairgrounds. By then, the plans no longer called for putting the house back together and restoring it. Instead, the stone materials were planned to be incorporated into a new Ohio Historical Center in the late 1960s, presumably the one that now sits adjacent to the fairgrounds today. But that plan also fell through for unknown reasons. The stone materials were eventually gifted to the Western Reserve Historic Society in Cleveland. Some of the stone was used in the restoration of the Hale Farm, but much of it now sits tossed around outside in the elements, slowly being worn away. This still leaves many questions unanswered, such as where the interior portions of the house ended up and why none of the material was ever reused in Columbus despite preservation interests eventually securing the funds to do so.
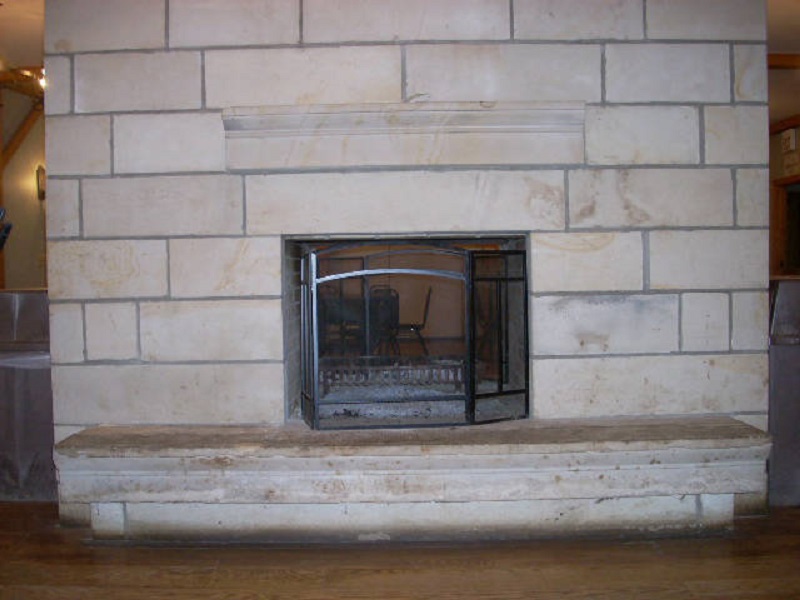
A fireplace at the Hale Farm rebuilt with Kelley House stones.
Kelley House stones in the elements at Hale Farm near Cleveland.
The Before and After July 2014 edition shows a few famous Downtown buildings and what ultimately happened to them.
The Hippodrome Theater Operated from October 26th, 1914 to December 31st, 1933. Address: 77 N. High Street, Downtown Seats: 300+ First movie shown: “The Nightingale” with Ethel Barrymore Last movie shown: Unknown Opening Admission: 10 cents
Photo of the entrance to the Hippodrome Theater, 1915.
The silent-era Hippodrome Theater was developed by G.E. Overton, who took over the Bonnett Jewelry store that occupied the building previously. News articles at the time of its opening described the décor in this way:
The little theater, which seats over 300, is neatly decorated in yellow. The lobby is attractive in white marble and the foyer is in yellow and gold. There is no stage; the picture being projected against a large screen as in most picture theaters.
The Hipp, as it was referred by, had a 6-piece orchestra under the direction of W.H. Claspill. It was the first movie theater in Columbus to have an orchestra.
There seems to be a bit of confusion on just when this theater opened. The official first movie shown there was in 1914, but by some accounts, the theater actually opened in April, 1910. Also, there is some mystery on the lone photograph above. Some list it as having been originally taken in 1915, but others have it listed from 1934, after the theater had closed.
The Park Theater Operated until November 24, 1893. The date it opened is unknown. Address: 217 N. High Street, Downtown Seats: Unknown
The Park Theater began operations sometime in the 1880s or very early 1890s, and may have operated long after 1893 if not for a disaster from the building just to its south, the Chittenden Hotel. In 1889, Henry Chittenden purchased the office building of the B&O Railroad, added 2 floors and spent $400,000 (an enormous sum at the time) converting and renovating the building into a luxury hotel. In 1890, a fire broke out and gutted the entire building, but spared neighboring businesses like the Park Theater.
The second Chittenden Hotel. The Park Theater building can be seen on the very right. The photo is from 1892.
Chittenden decided to rebuild, and the 2nd Chittenden Hotel was completed in 1892. This second hotel had its own theater, the Henrietta, which was still partially under construction on November 24th, 1893. That evening at around 8pm, a fire started during a performance there. The fire originated in the auditorium, in an area that was still under construction and spread into the seating area itself. Once the flames breached the theater, strong winds quickly spread the fire and began to burn the hotel as well as surrounding buildings, including the one that housed the Park Theater. By the time the fire burned itself out just the next morning, both theaters, the hotel, a drug store, saloon, shoe house and clothing shop were all completely destroyed.
The second Chittenden and Park Theater, November 1893.
The Park Theater, November 25th, 1893.
Improbably, despite 2 hotels in the same locating burning down, Chittenden rebuilt for yet a 3rd time, with the largest and grandest version of all- not to mention with far better fire-resistant construction. The third time, it seems, was the charm, and the hotel survived from its completion in 1895 to its final demolition in 1973.
The unlucky Park Theater itself never rebuilt, though the lot had a new commercial building in its spot by 1895. That building also faced the wrecking ball in 1973.
The current location of where the Chittenden and Park Theater once stood.