**2018 Update: The Crew was saved and Confluence Village, a new development with a new Crew Stadium, will be built at the Arena District site.
Last week, it was announced that the owner of the Columbus Crew MLS team- Anthony Precourt- was considering moving the team. His reasons, whether one believes them to be true, include the idea that the current home stadium- Mapre- is outdated and in a bad location to attract the needed attendance to make the team financially viable. The stadium, which was the first soccer-specific stadium of its kind in the United States, is just 18 years old. However, being still relatively young, it is currently one of the most bare-bones professional soccer stadiums in the country, and it’s location at the Ohio State Fairgrounds is not particularly good. The stadium itself is surrounded by vacant and parking lots as well as a mish-mash of development that leaves the area feeling rather desolate. For years, there has been talk about building a new stadium closer to or in Downtown itself. The city, according to officials, have tried to talk with Precourt about either buying the team or trying to come up with a stadium plan, but were apparently rebuffed. This may be because Precourt had long-established plans to move the team to Austin, Texas, an out clause that he intentionally added to the contract when he purchased the team. So while the Mayor and others discuss the future of the team, there’s a practical matter to solve.
I don’t want to go too much more into the debate about Precourt, his motives or how likely it is that the Crew will stay in Columbus even with the promise of a new arena. Those subjects are already being debated on other sites, including the Dispatch and Reddit and other forums. So, what I want to do is to look at where a potential new stadium could even go. Let’s look at the potential options.
Scioto Peninsula
The Scioto Peninsula has long been underutilized and empty since its old manufacturing buildings were torn down between the 1970s and the early 2000s.
Pros: More than enough room for a new stadium as well as surrounding mixed-use development. Great location Downtown on the Riverfront.
Cons: This site has an existing mixed-use development plan already in place, and an Indianapolis company has recently been chosen to develop the Peninsula, with a potential construction start in Spring 2018. It would seem unlikely that those plans would be scrapped at the last minute.

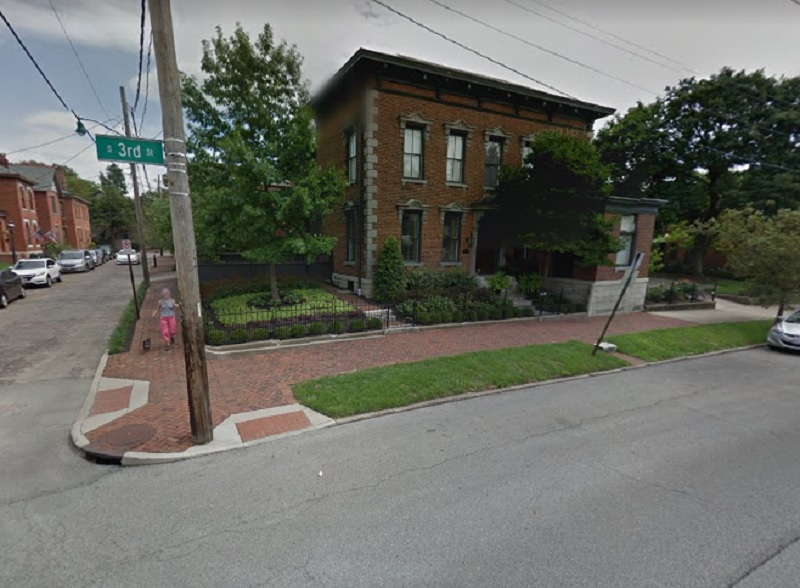
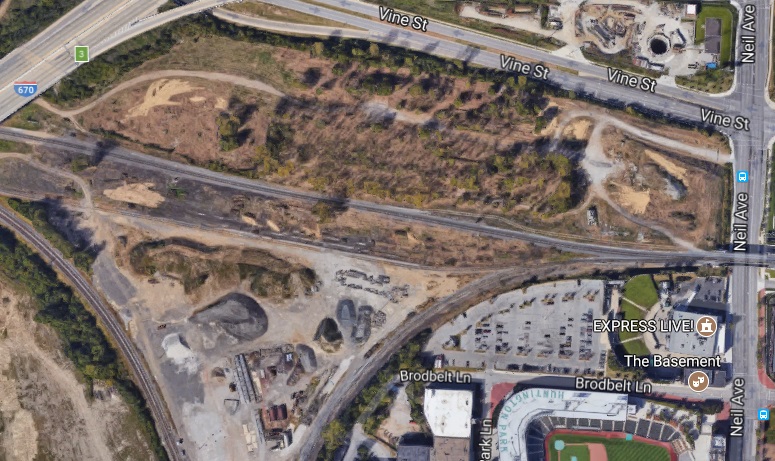
Arena District Site #1
The Arena District is a thriving neighborhood that would be a perfect fit for a new stadium.
Pros: Already an established entertainment and sports neighborhood with stadiums for the Clippers and Blue Jackets, lots of local bars and restaurants, great location, enough space for a new stadium development.
Cons: As with the Scioto Peninsula, this site already has plans. Perhaps a new stadium could be incorporated, especially when the plan left a lot of open space with parking lots and retention ponds. The site is also split in half by railroad tracks that are still active. This would take some creative development to accommodate a stadium and any required infrastructure.
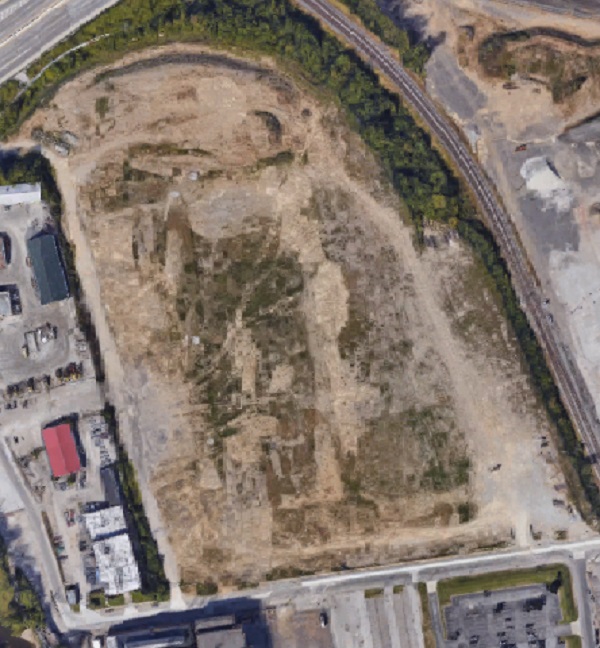
Arena District Site #2
Pros: Good location, enough space for a stadium, near bars, restaurants and other entertainment venues.
Cons: This site is owned by Nationwide. While no specific plans have been announced as of yet, they have stated for a few years now that they want to eventually do some kind of mixed-use development. Whether they would be willing to incorporate a stadium into those plans is unknown. The site is also somewhat separated from the rest of the AD by the railroad tracks on the east side. Another problem may be infrastructure. There is really only a single road- Nationwide Boulevard- in and out of this site. During games, this could be an issue unless it’s resolved or some kind of shuttle system is provided.
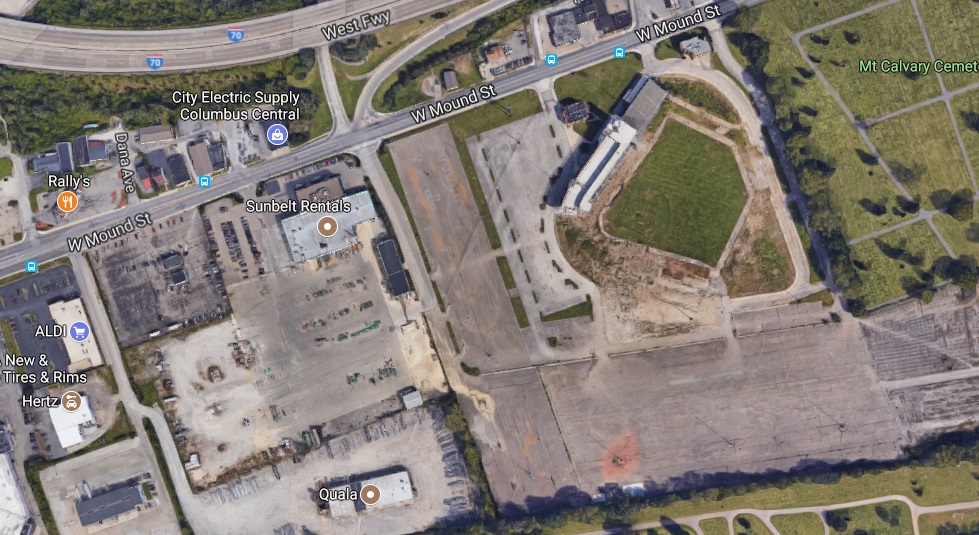
Cooper Stadium
Cooper Stadium, the original home of the Columbus Clippers before they moved to the Arena District, has sat empty and rotting since 2010. The surrounding area, while not exactly great, is a perfect candidate for revitalization.
Pros: Enough room for a stadium, and with the potential purchase of nearby properties, enough to create a mixed-use development around it. Still close to Downtown.
Cons: This site is owned by Arshot, a development company that has long planned a race track development here called SPARC. However, there has been no movement on this development whatsoever, and most now believe that the project is dead. Would Arshot be willing to develop a soccer stadium there instead? Also, given that the site is surrounded by a cemetery on 2 sides affect the possible development?
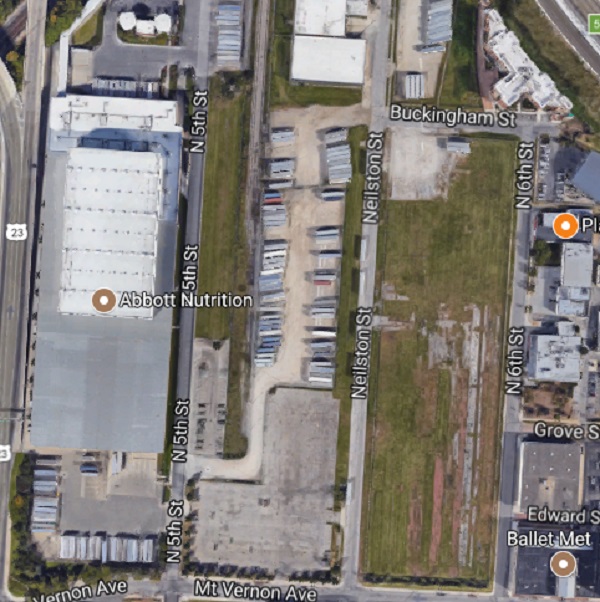
Abbott Labs
On the north end of the Central Business District, this site has very large empty lots that are mostly used to store semi trailers, when they’re used at all.
Pros: Plenty of space, as Downtown as Downtown gets, plenty of nearby restaurant and bar options to create a neighborhood experience.
Cons: Abbott Labs owns the land. While much of it is only lightly used at best, they may not be willing to sell it.
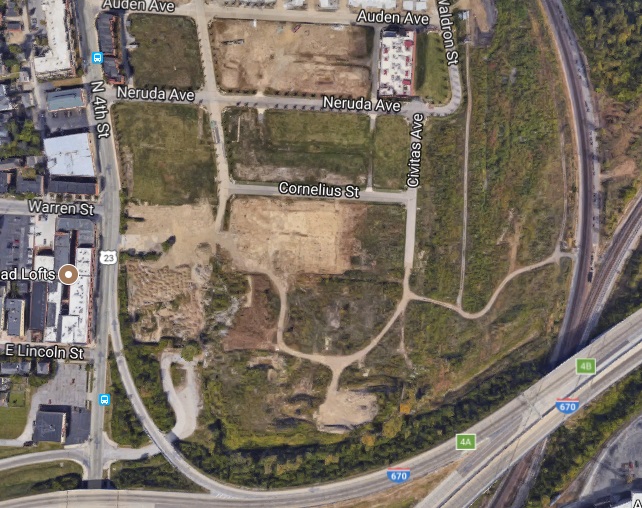
Jeffrey Manufacturing
The old site of the Jeffrey Manufacturing Plant, these vacant lots are in one of the most prime locations in the entire city.
Pros: Great location in the Short North/Italian Village, high levels of bars and restaurants nearby.
Cons: Most of the site north of Neruda Avenue has already been developed with housing. I’m not sure if there is enough space to the south for a new stadium and some kind of parking garage (parking is already very tight in the area). Again, this could be potentially solved with a shuttle or transit system from existing lots/garages Downtown, though. I’m also not sure if the current developers would be willing to sell it, and NIMBYism would likely be fierce from local residents.
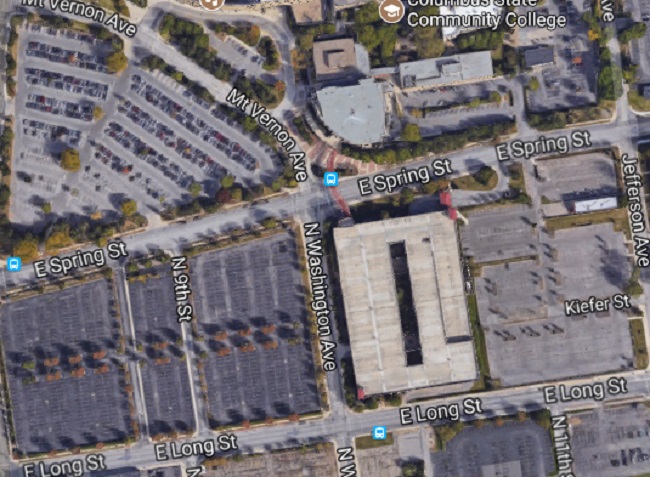
Columbus State Parking Lots
On the northeast side of the Central Business District, Columbus State Community College’s land includes one of the largest areas of surface parking lots anywhere in the city.
Pros: Great location, plenty of space to develop.
Cons: Columbus State owns the land and has long-term plans to develop these. It’s doubtful that they’d be willing to incorporate a stadium here and lose valuable expansion space.
Unconventional Possibilities
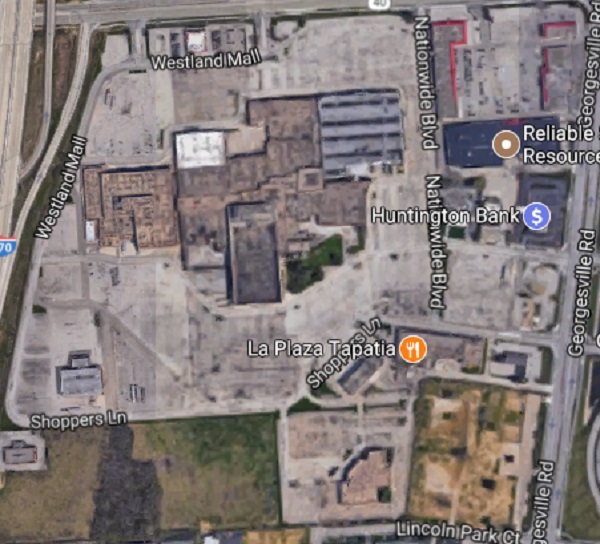
Westland Mall
Westland Mall hasn’t been functional for many years, and its last and original tenant- Sears- recently abandoned the site as well. There have been no plans announced for the mall and it otherwise rots and prevents the improvement of the Far West Side.
Pros: The defunct mall site is enormous. A new stadium and new mixed-use neighborhood could basically be built from scratch. It also has excellent access to the Outerbelt.
Cons: Not Downtown or even close to it, so it wouldn’t solve the complaint about being too far from the core of the city. This area is also not particularly nice, and may suffer the same perception problems that the current stadium site has.
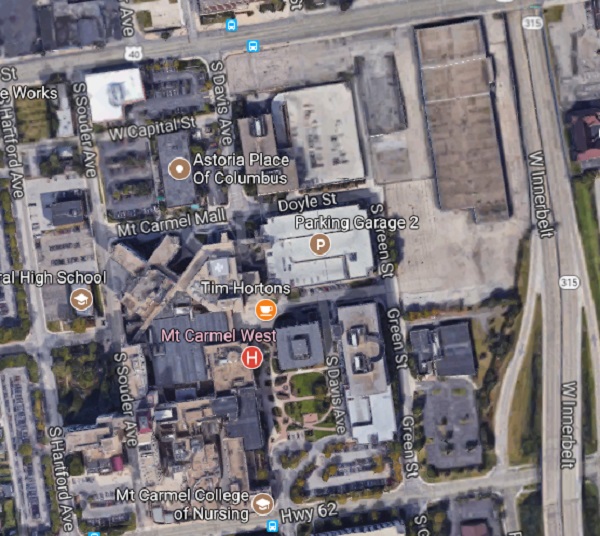
Mt. Carmel West
Mt. Carmel West, a long-time hospital in Franklinton, will be moving most of its operations to Grove City.
Pros: Close to Downtown, potential to create new entertainment district.
Cons: The site has many existing buildings that would have to be torn down or repurposed to fit a stadium and mixed-use development. Mt. Carmel has plans to create a mixed-use development eventually, anyway, but this would be one of the most difficult to remake.
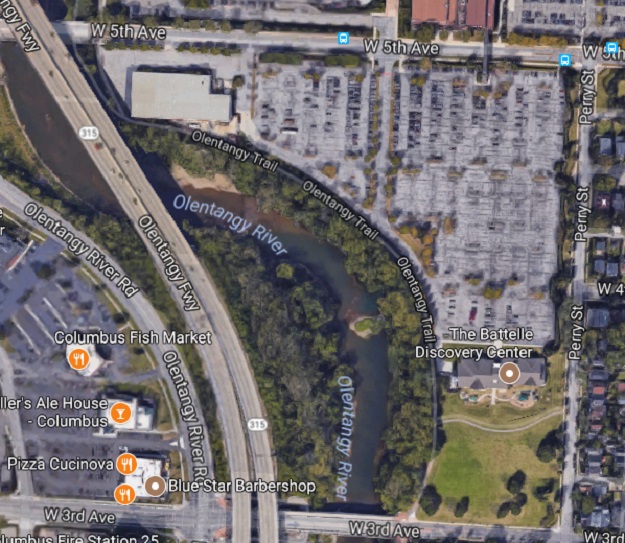
Harrison West
Part of the Short North, Harrison West is a largely residential neighborhood. Off of 5th Avenue is a large parking lot and empty land that Battelle is selling off for redevelopment.
Pros: Great location, should be enough space.
Cons: There is little extra room for mixed-use development, and neighbors would pull the same kind of strong NIMBYism that the Jeffrey Manufacturing site would face. There are also already tentative development plans, and it’s unknown if a stadium would work.
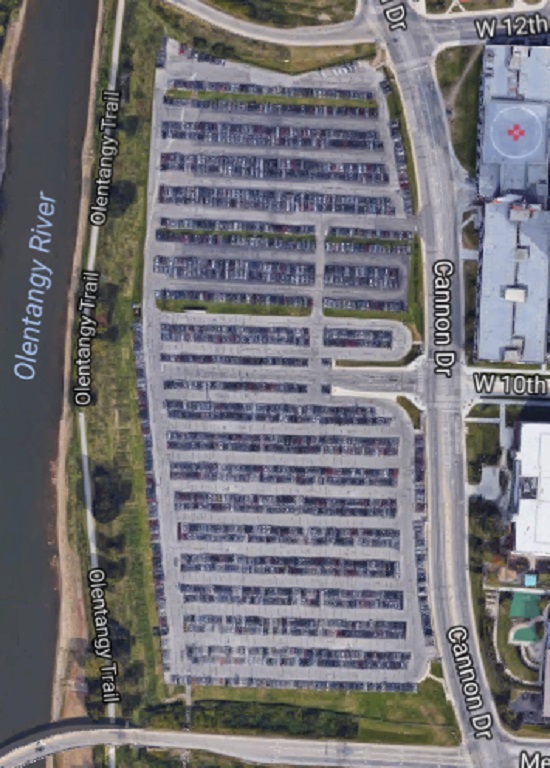
Ohio State Campus
Pros: While not exactly Downtown, Ohio State is already a destination in many ways- certainly for sports. There is land available, and the surrounding neighborhoods are much nicer than the current stadium location.
Cons: Ohio State has long-term plans for practically every square inch of land it owns. Would they be willing to part with enough for a stadium? And could an attached mixed-use development come into play?
So there you have it, my list of potential Crew Stadium locations. What do you think? Am I missing any good ones?