The Housing Market Update October 2022 data from Columbus Realtors showed a significant slowdown in home sales, but that it didn’t mean homes got cheaper in the process.
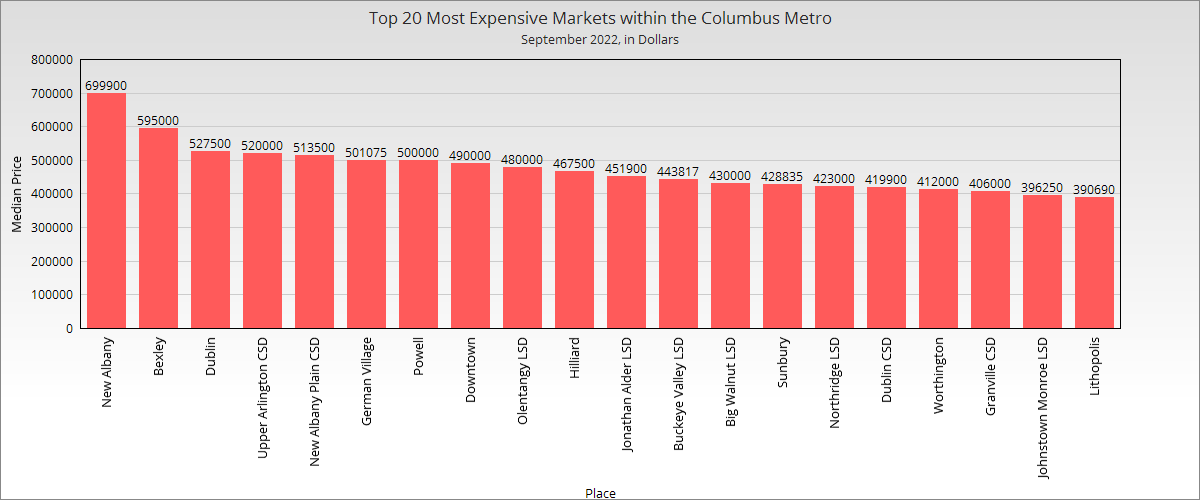
Note: LSD= Local School District, CSD= City School District. In both cases, school district boundaries differ from city boundaries.


Closed sales are those sales that were completed during the month. They dropped significantly in most counties year-over-year as rising interest rates slowed the white-hot market.
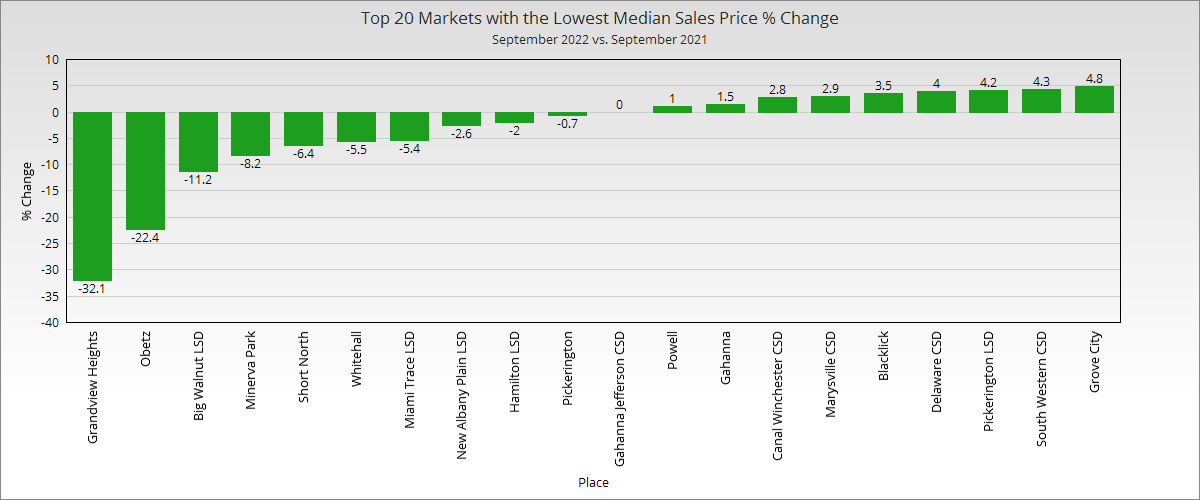
But what markets slowed down the most?
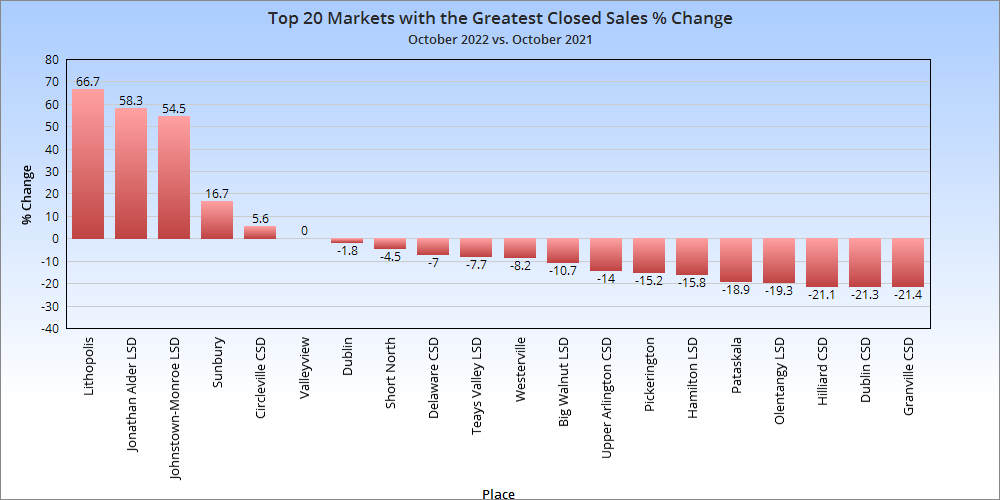
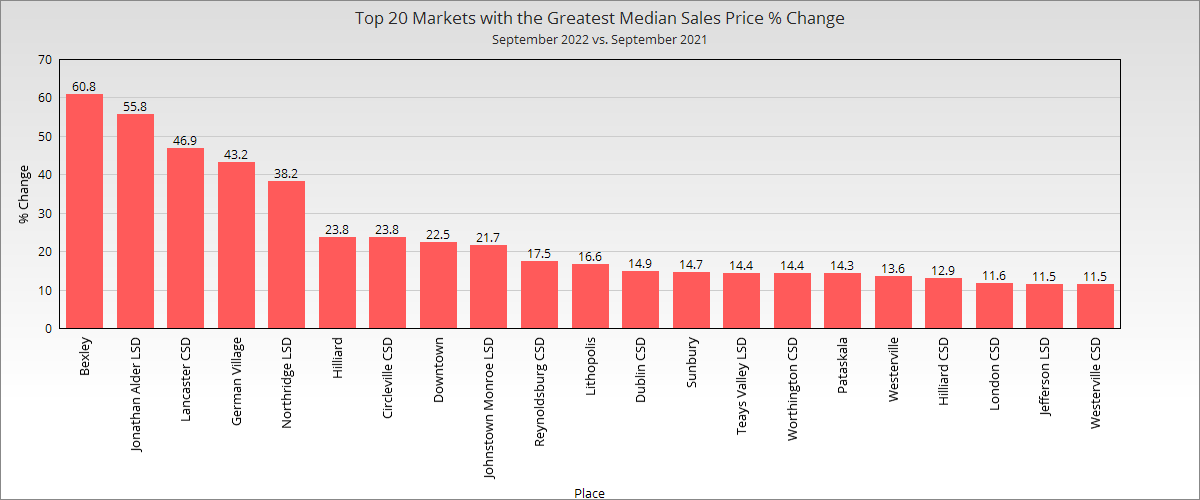
Only a handful of markets saw an increase, including Johnstown, which is presumably seeing movement due to the Intel project.
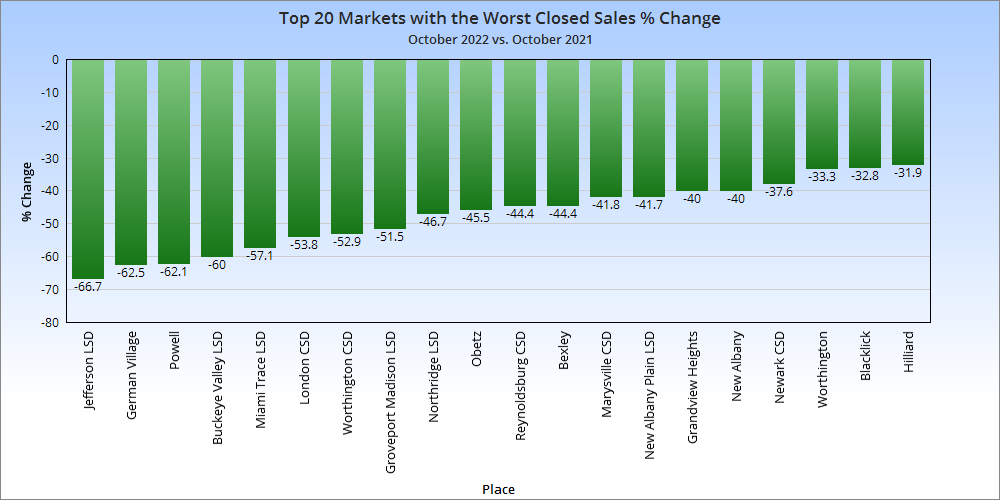
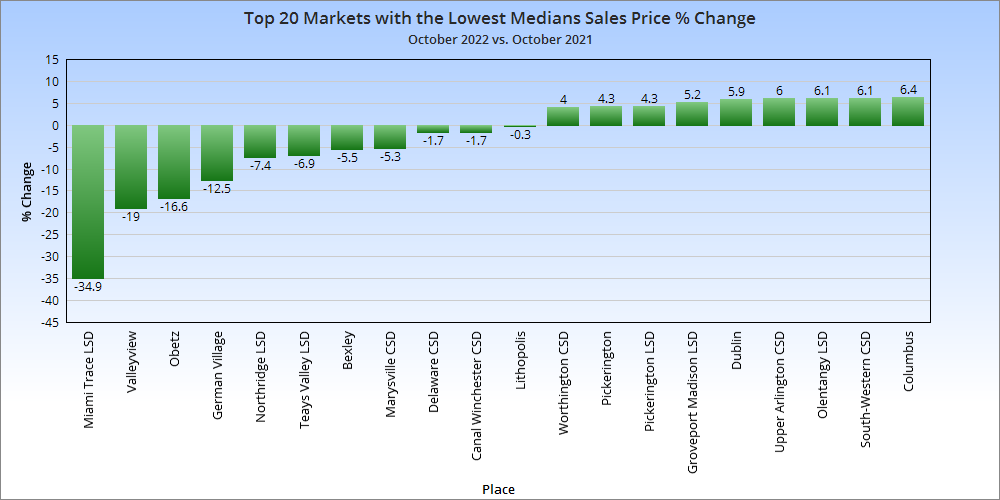
Most places on this list tended to be among the most expensive local markets, but not all.
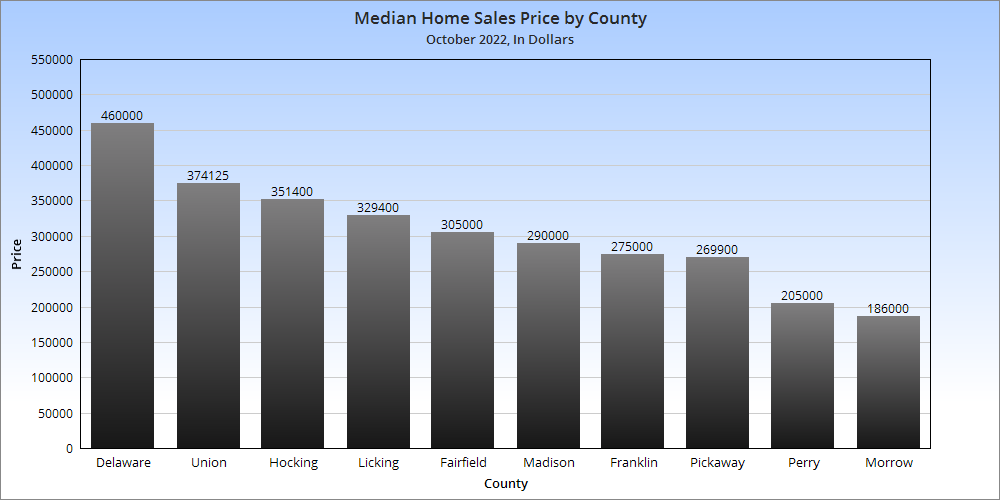
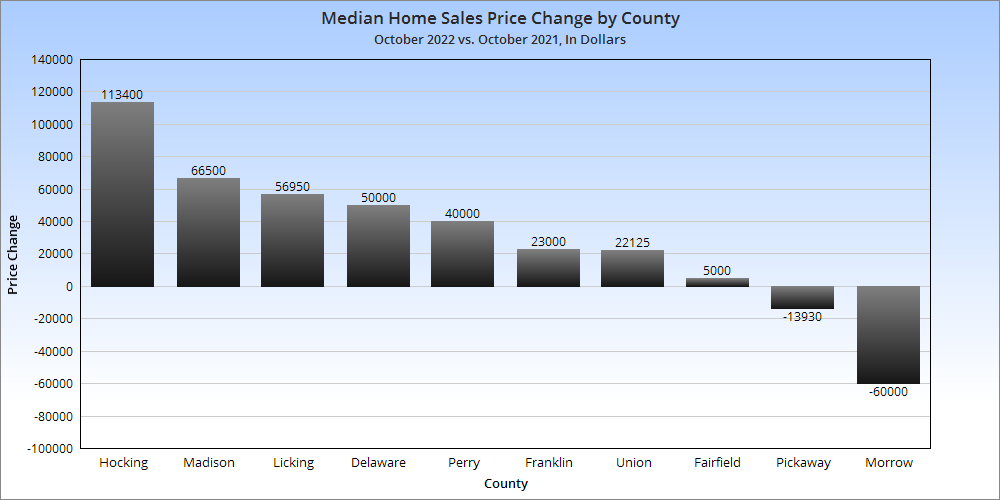
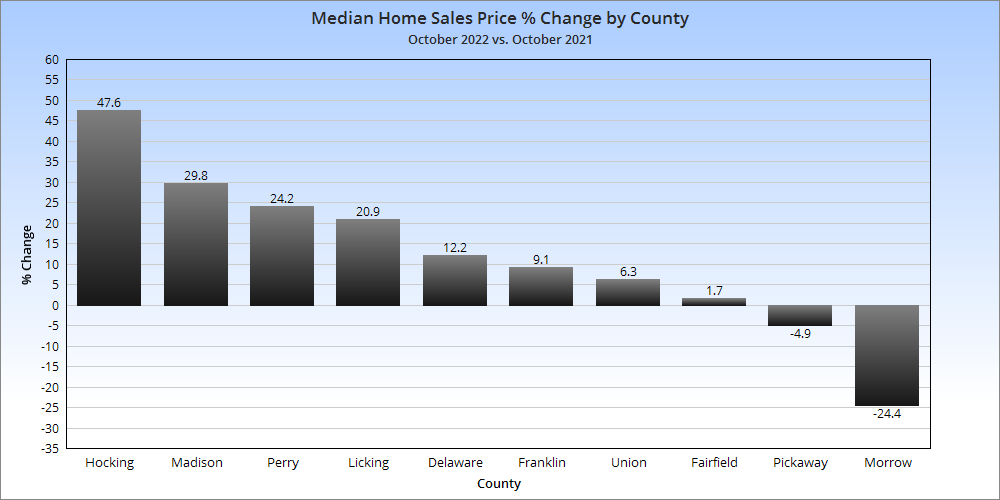
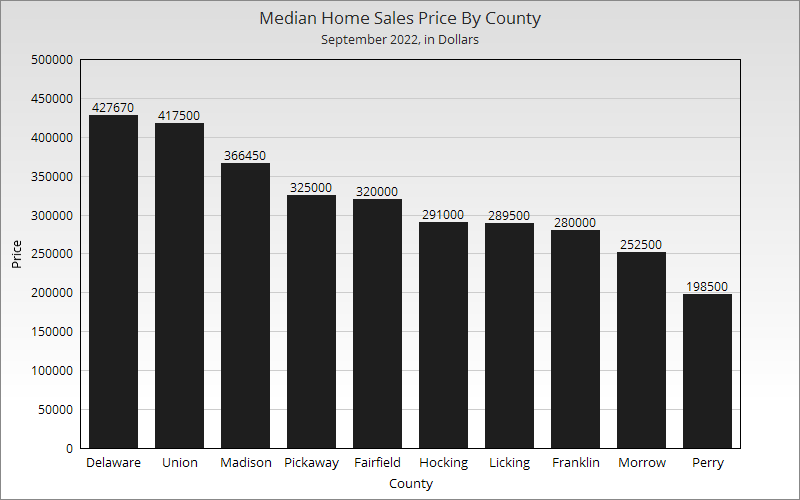
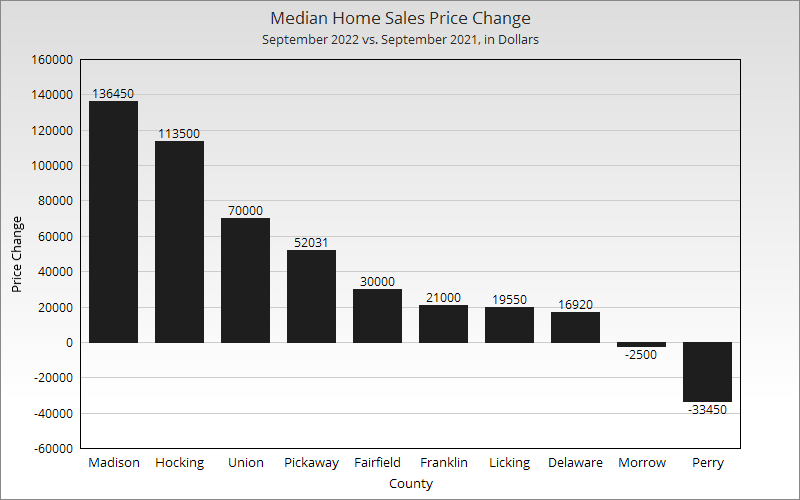
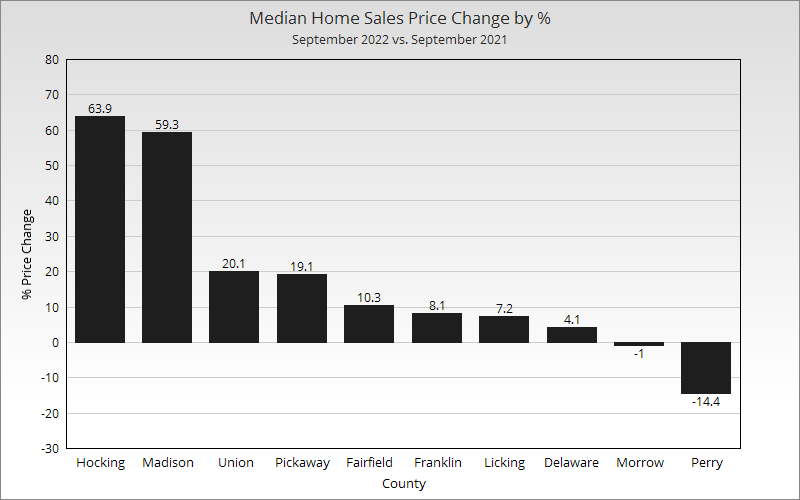
Most counties continued to see price increases, though some were much more modest than others. Franklin County was in the middle of the pack.
Overall Market Median Sales Price in October 2022: $304,583
Based on the 10 Columbus Metro Area counties, the metro price saw about a $12,000 increase vs September, 2022 and a more than $30,000 increase over October, 2021.
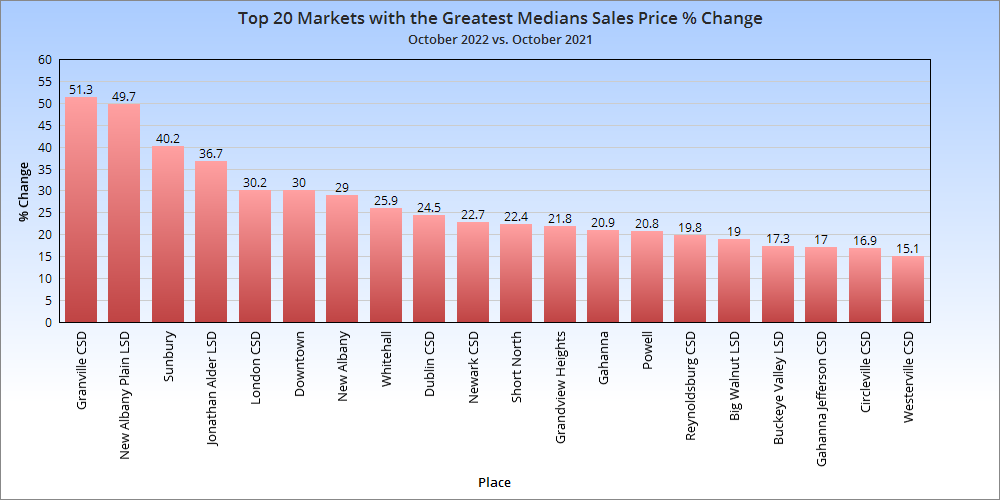
Overall Market Median Sales Price % Change in October, 2022 versus October, 2021: +10.6%
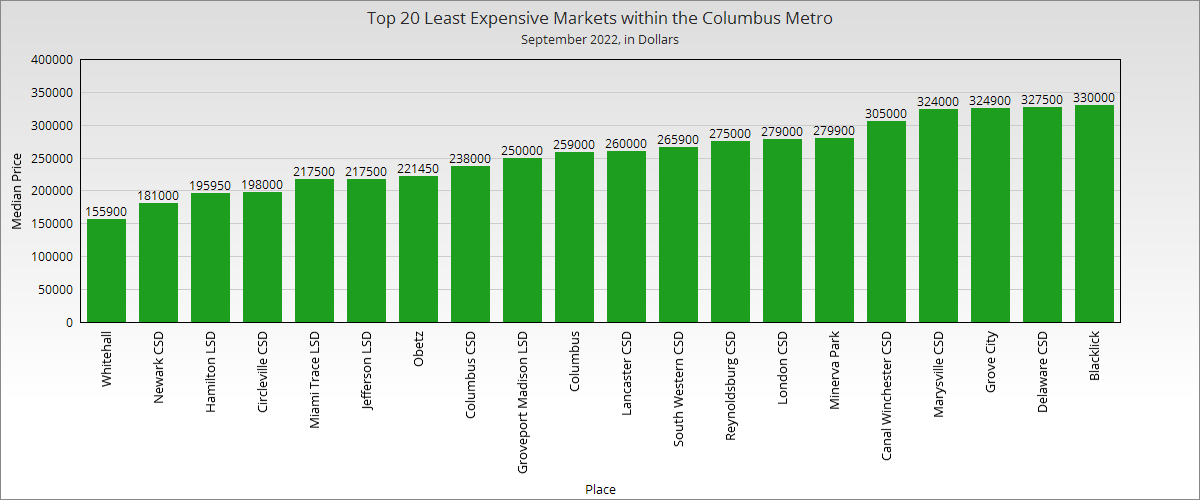
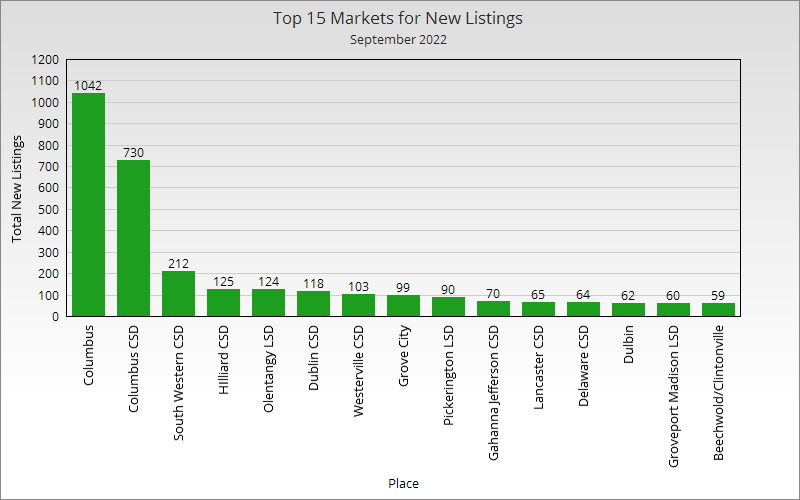
Now let’s take a look at individual neighborhoods and places within the metro area.
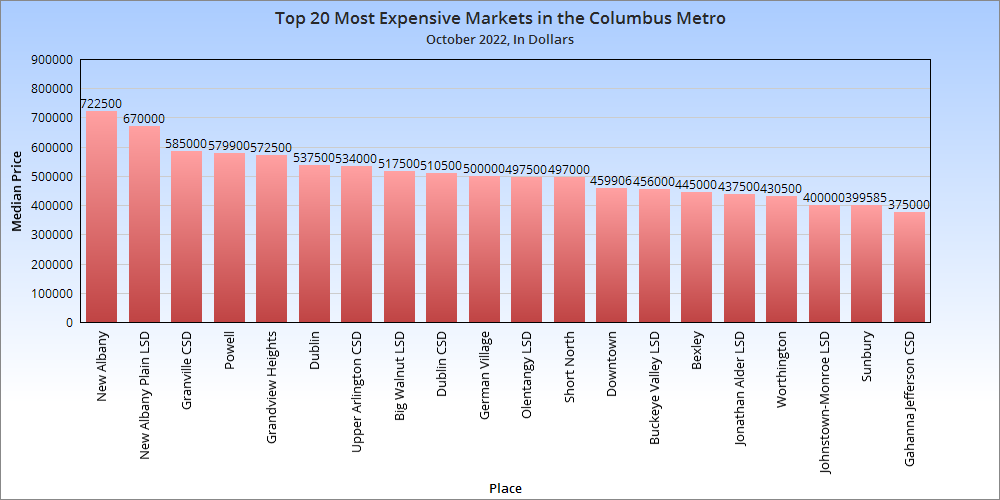
There are few surprises on this chart.
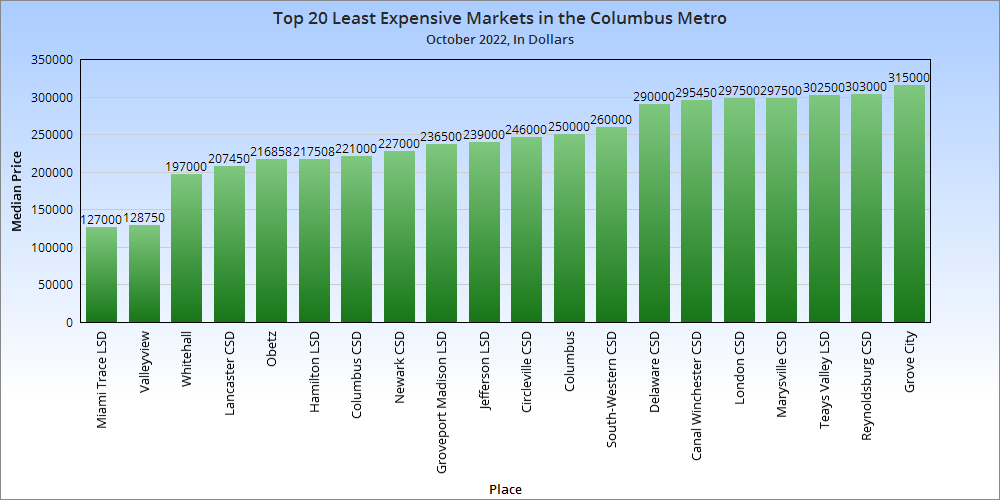
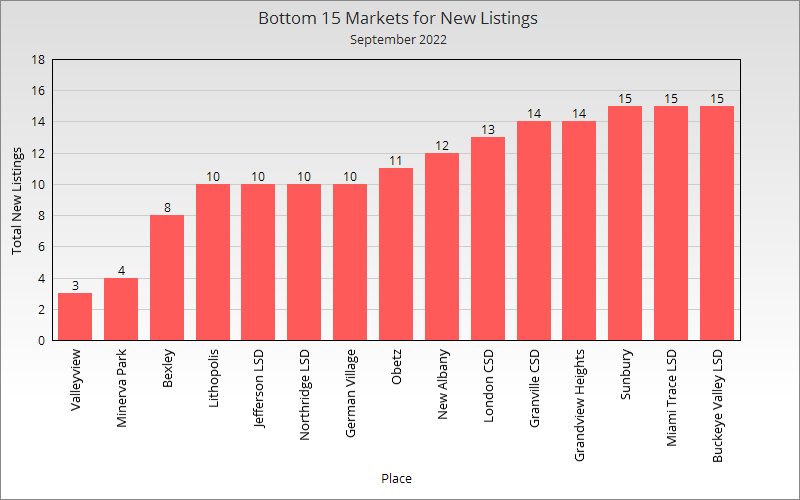
Only 3 markets had a median price below $200,000, 2 of which were within I-270.


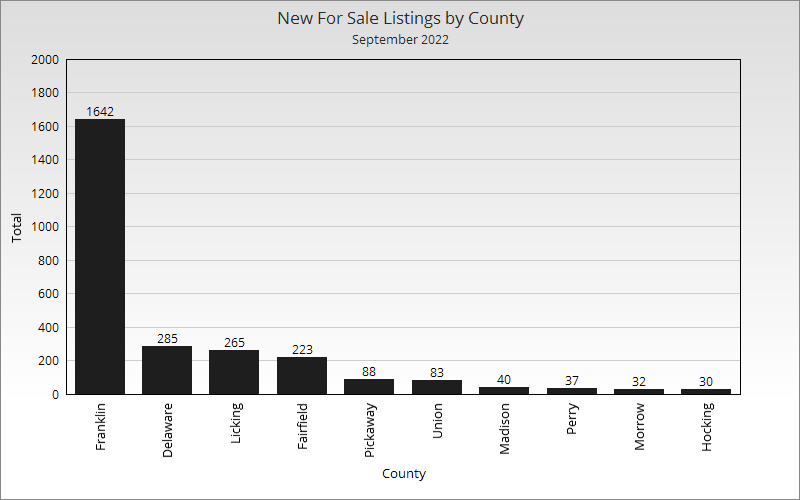
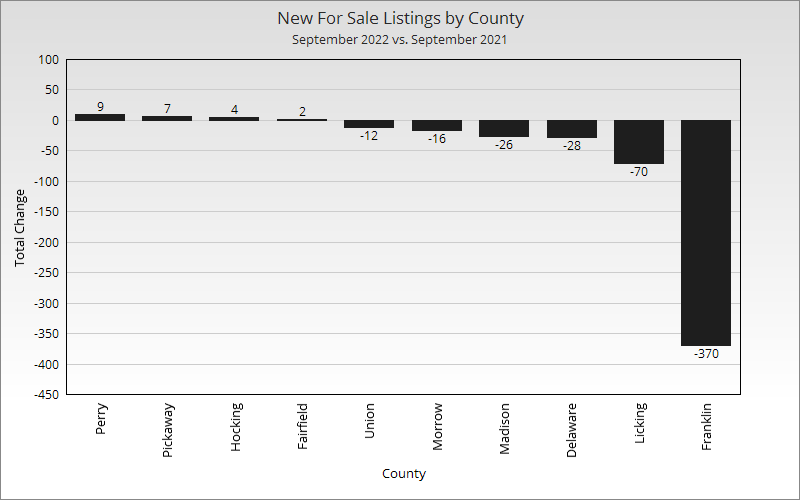
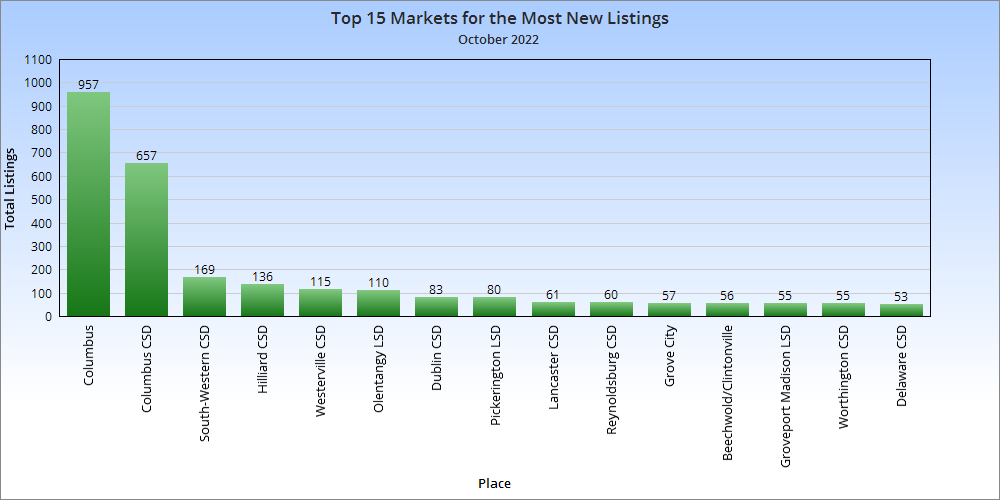
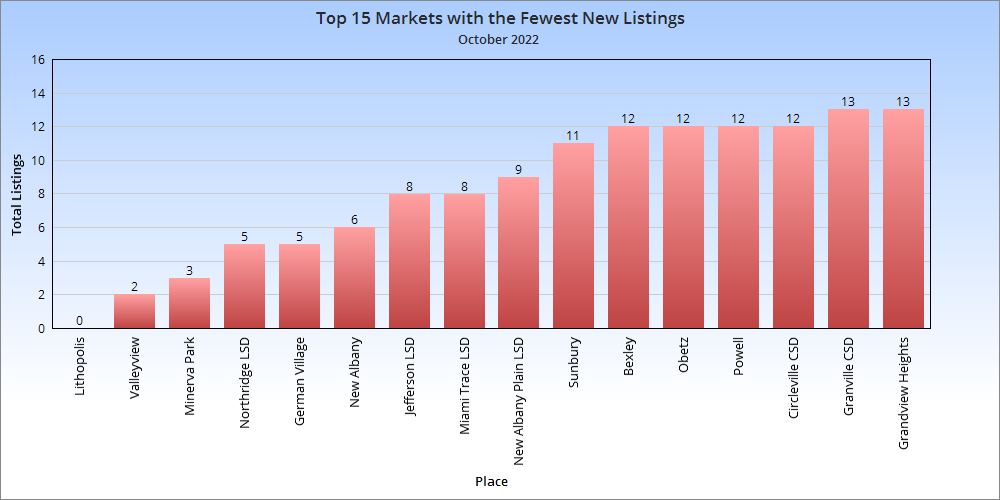
Most counties saw new listing totals drop year-over-year. This is one of the reasons prices remained higher despite large sales drops.
Total Metro New Listings in October, 2022: 2,401
Total Metro New Listings Change from October, 2021 to October, 2022: -497
Year-over-year, new listings were down yet again.
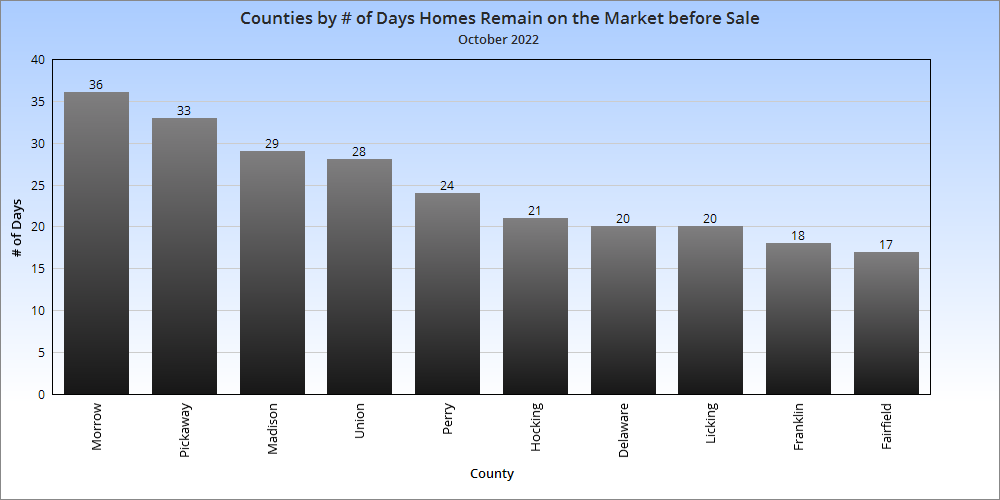
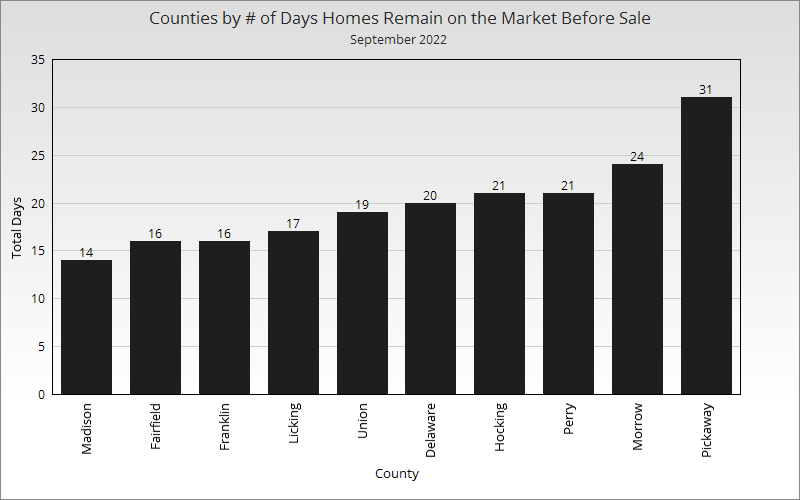
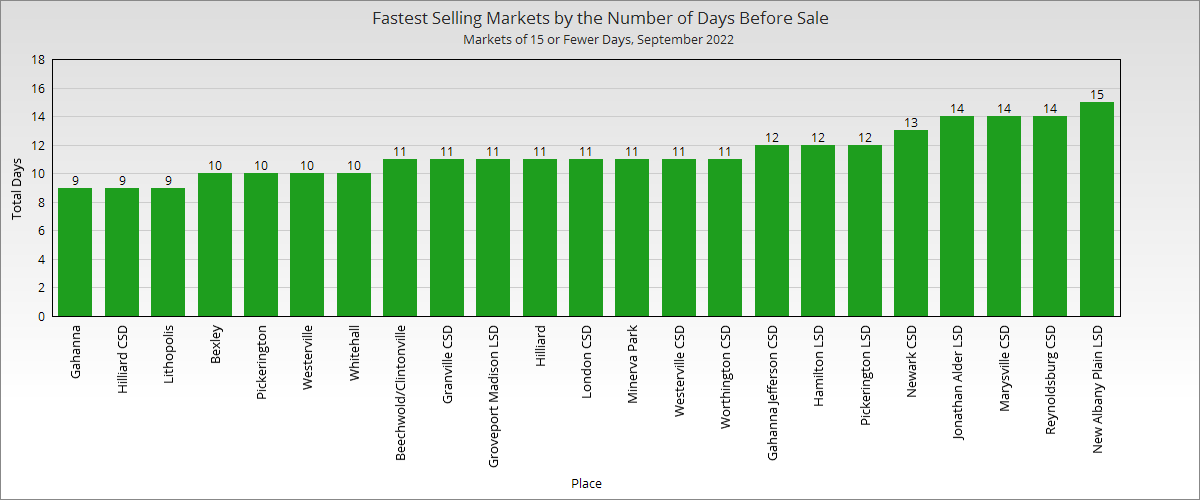
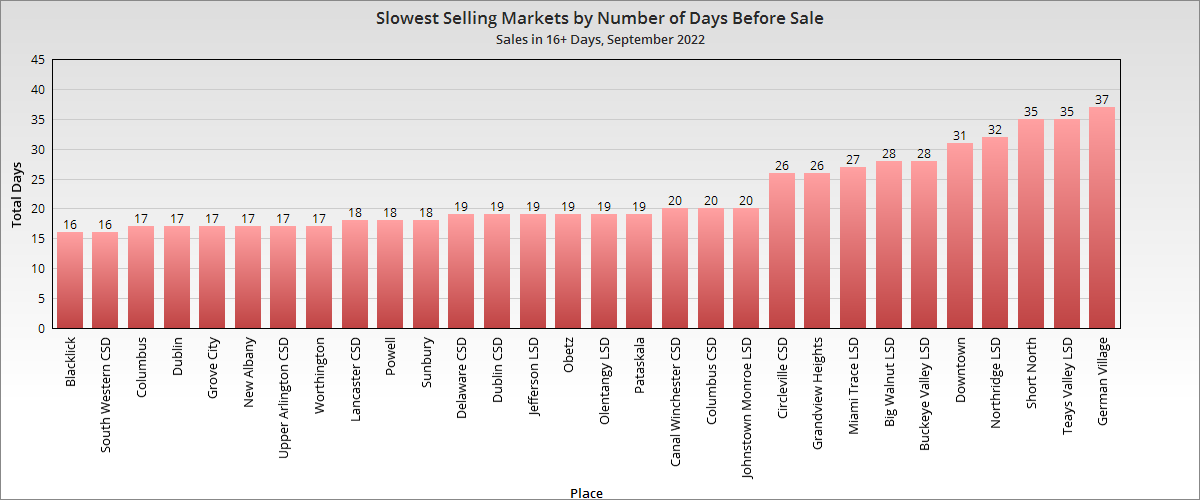
Average # of Days Homes Remain on the Market Before Sale for the Metro Overall in October, 2022: 24.6
# of Days Homes Remain on the Market Before Sale for the Metro October, 2021 vs. October, 2022: +8.2
Homes across the market sold more than a week more slowly year-over year in October.


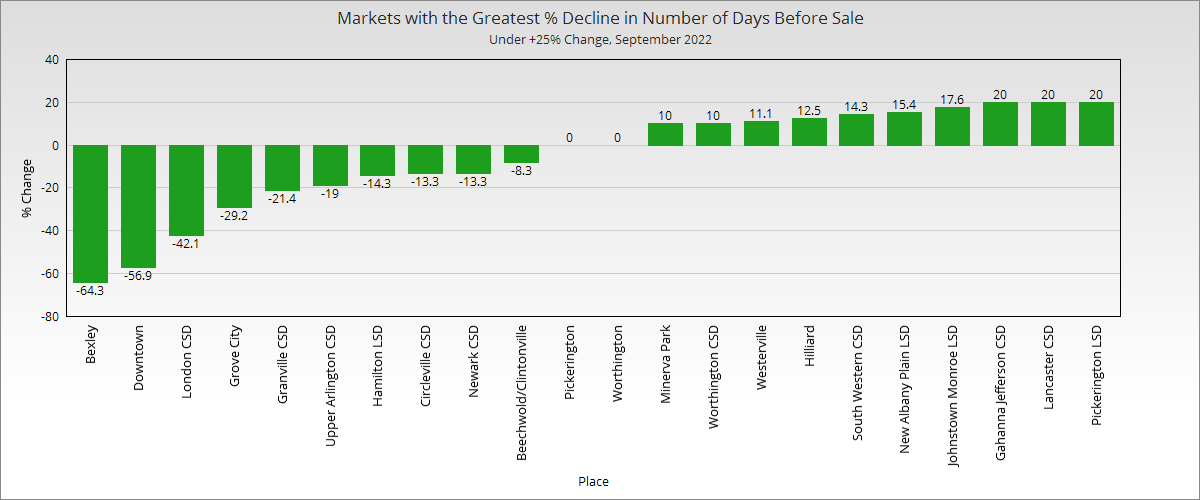
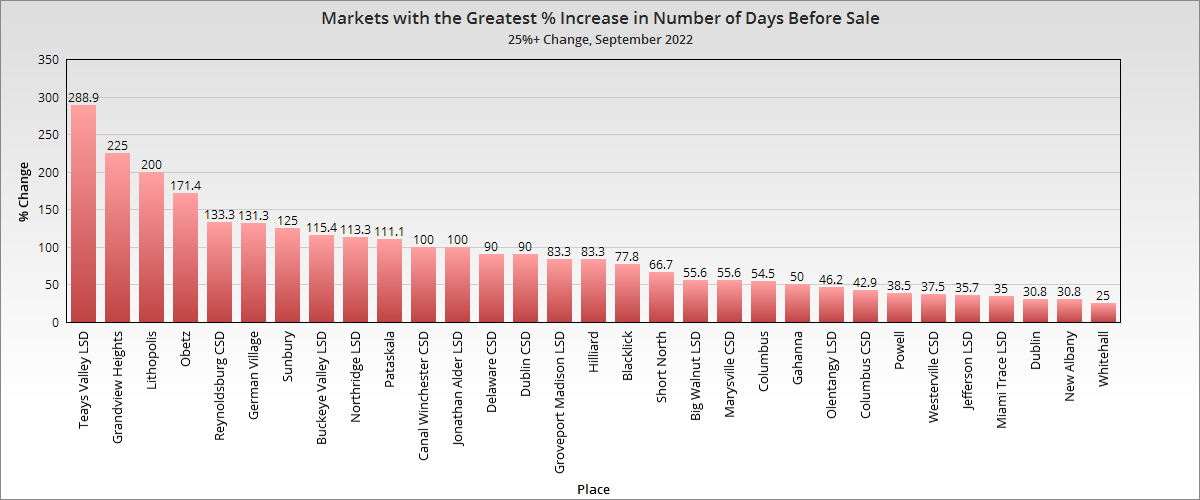
Aside from the half-dozen markets that saw declines, most saw fairly significantly increases in the number of days before sale year-over year.
Overall, the October housing market showed strong signs of a slowdown, but so far, this hasn’t prevented further price increases. Demand for homes seems to be continuing to outpace supply, but perhaps not quite to the level it was earlier in the year.