Housing Market Update September 2022


Housing market update September 2022

The Housing Market Update September 2022 data from Columbus Realtors continued to support that the local housing shortage is as bad as ever, with low supplies and rising prices.

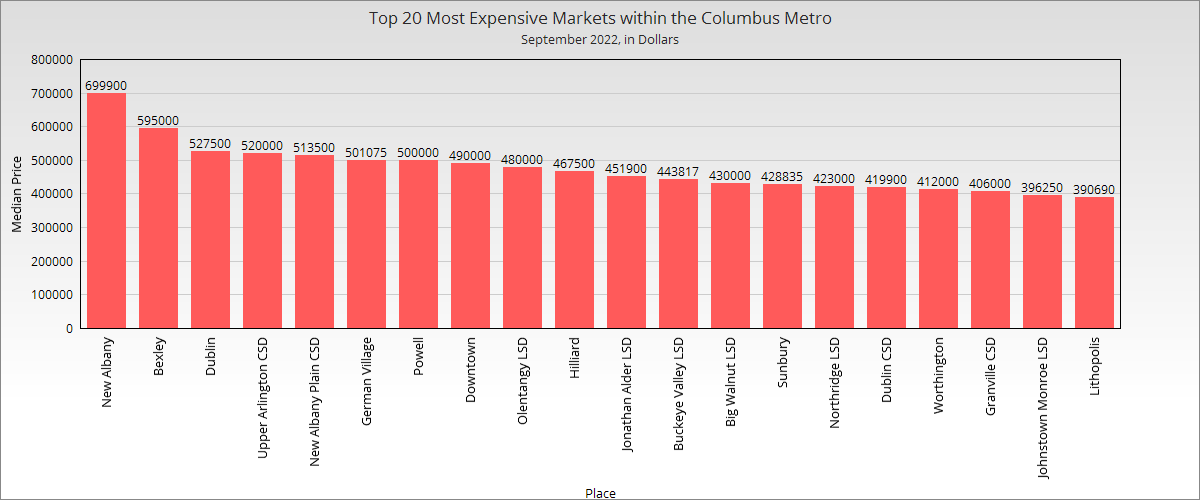
Note: LSD= Local School District, CSD= City School District. In both cases, school district boundaries differ from city boundaries.

Housing market update September 2022 median price by county

Housing market update September 2022 county median price change

Housing market update September 2022 county median price % change
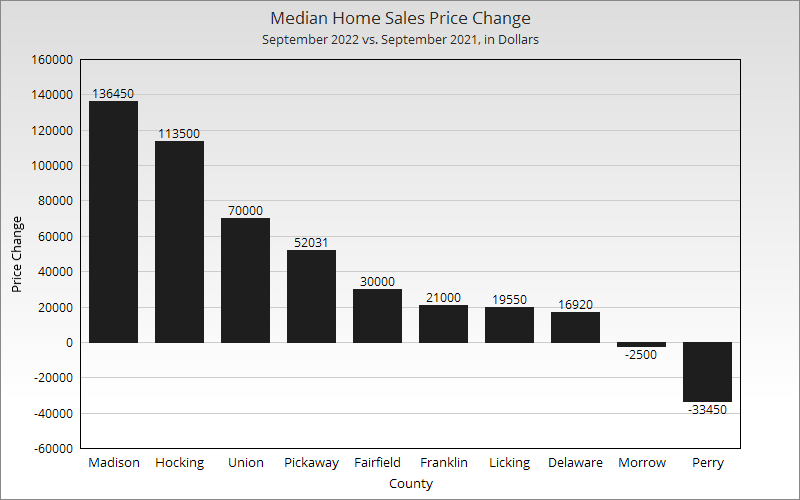
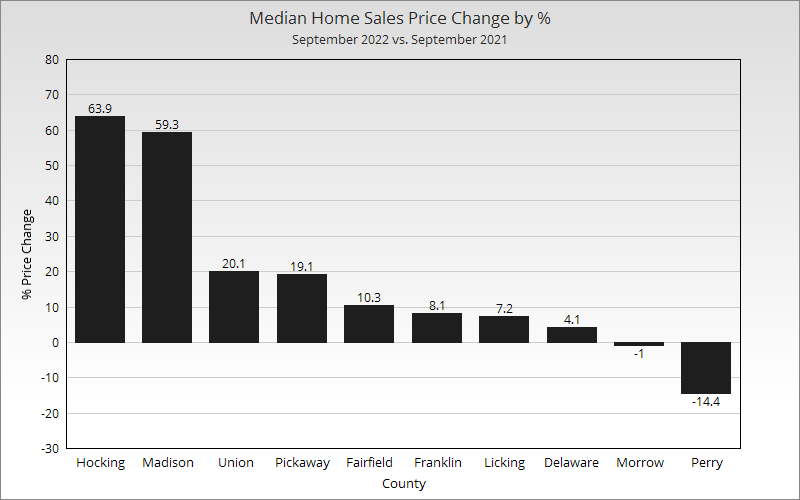
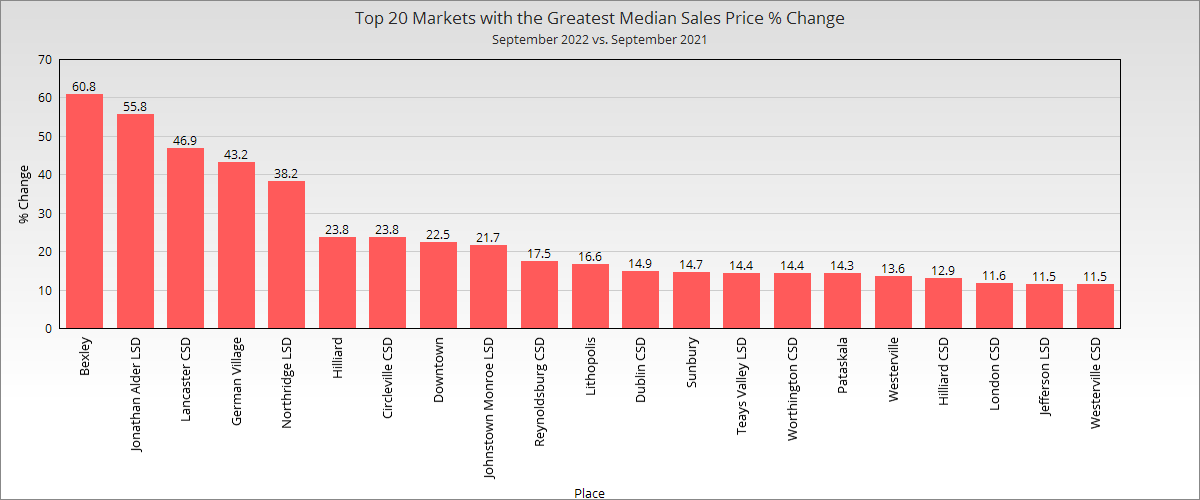
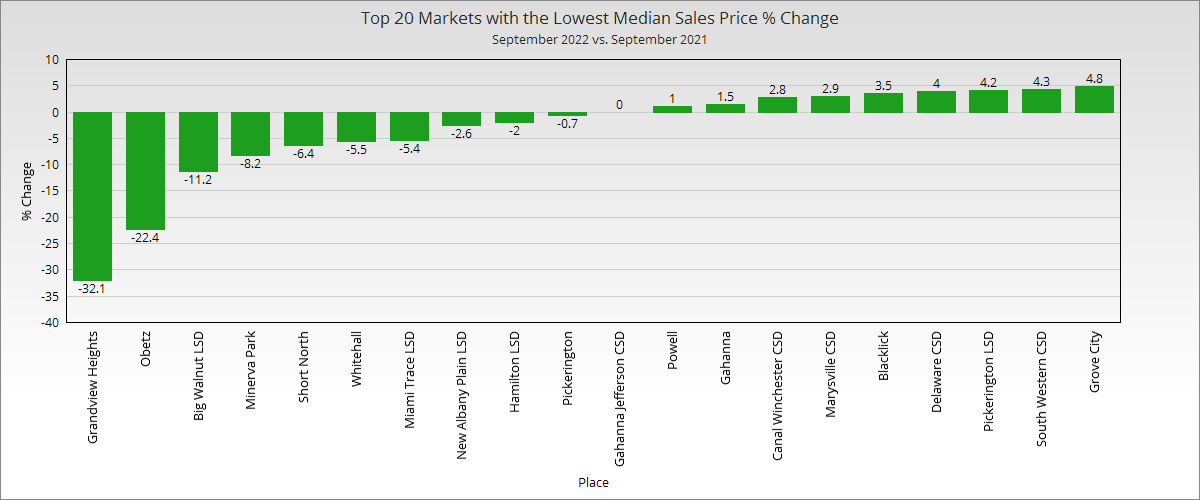
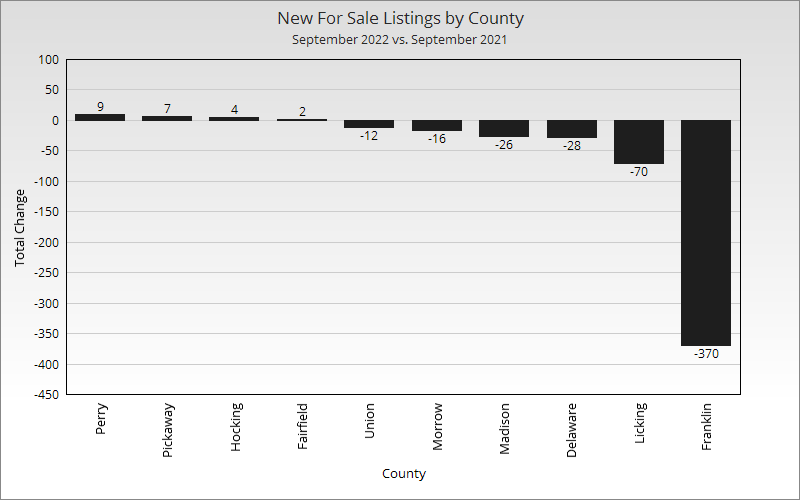
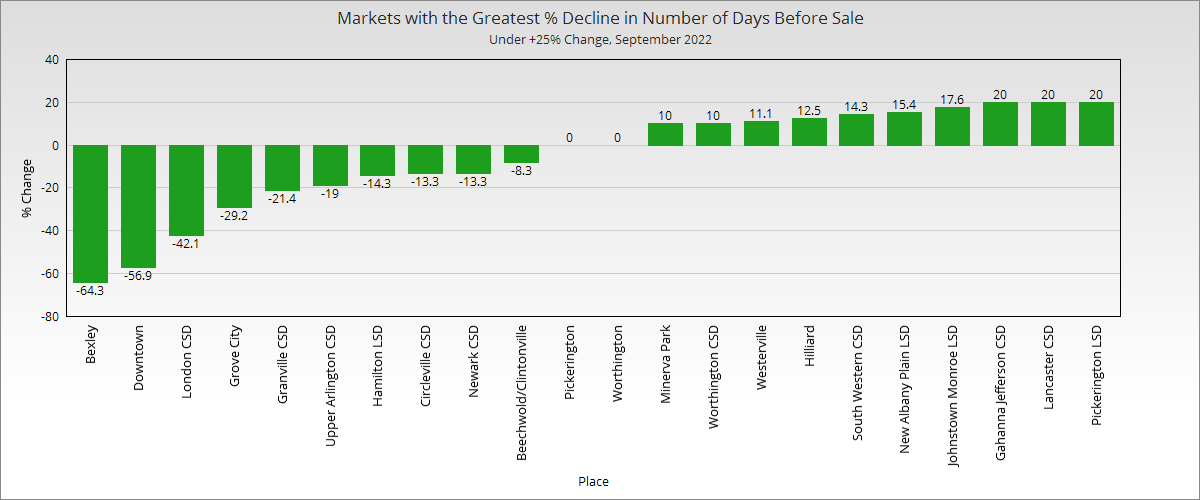
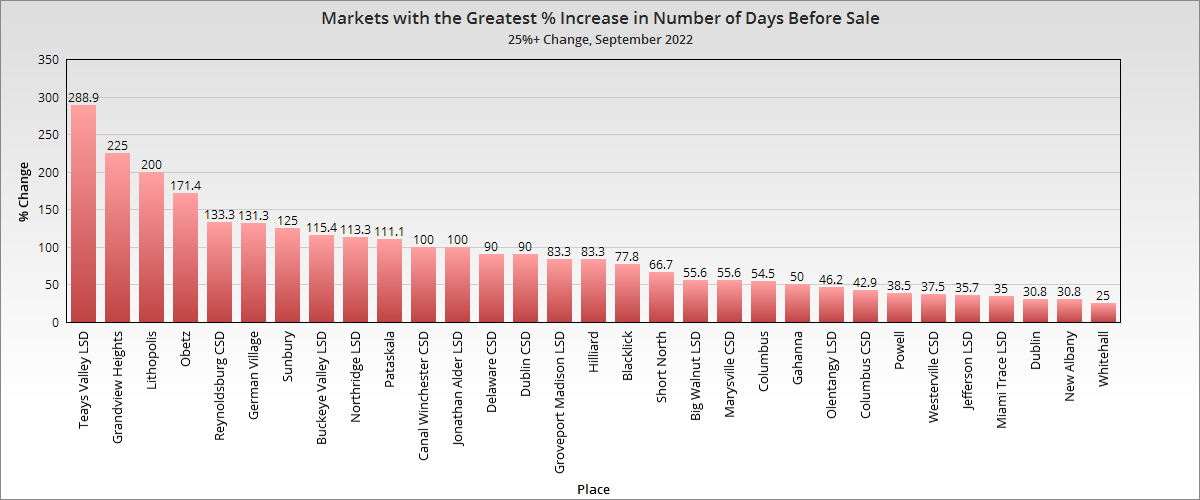
The least populated counties saw some of the largest swings either positively or negatively, which is typically the case given that prices can be determined by a much smaller number of home sales.

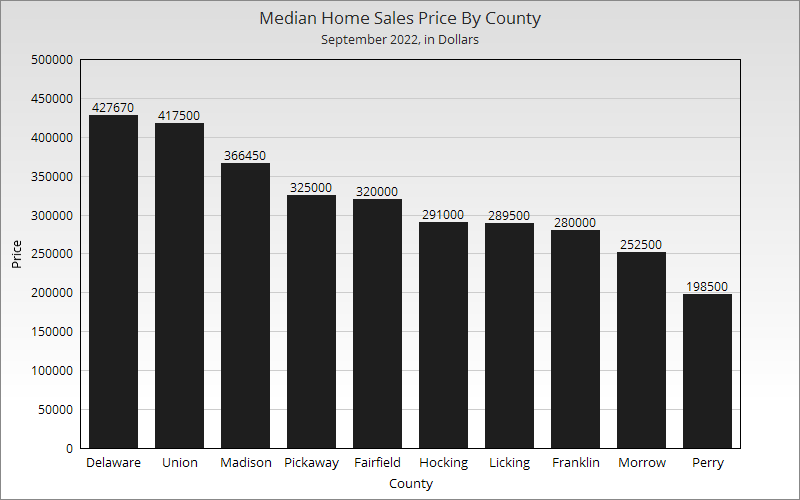
Overall Market Median Sales Price in September 2022: $316,812
Based on the 10 Columbus Metro Area counties, the metro price saw about a $10,000 increase over August 2022 and a more than $42,000 increase versus September 2021.
Overall Market Median Sales Price % Change in September 2022 versus September 2021: +15.4%

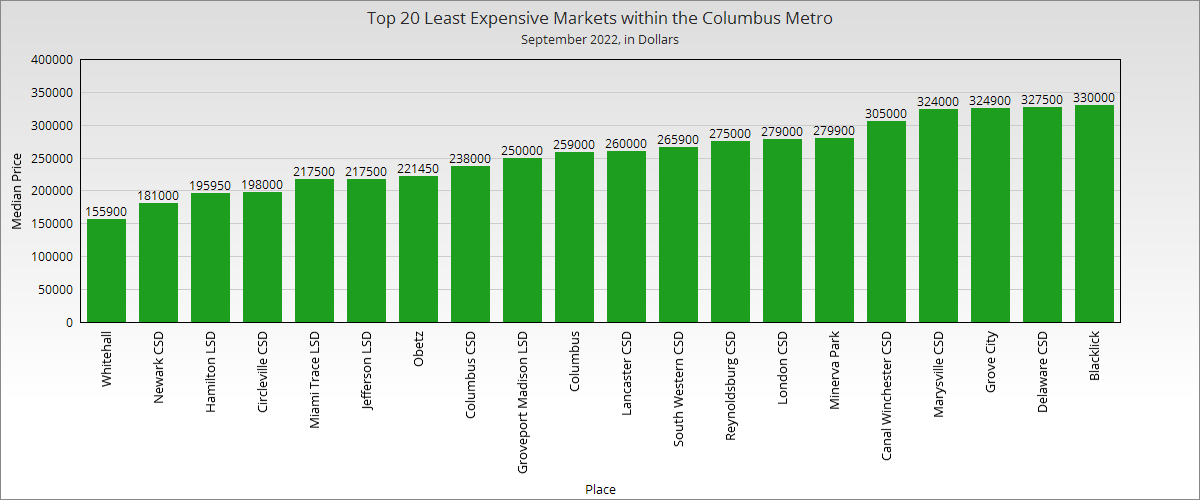
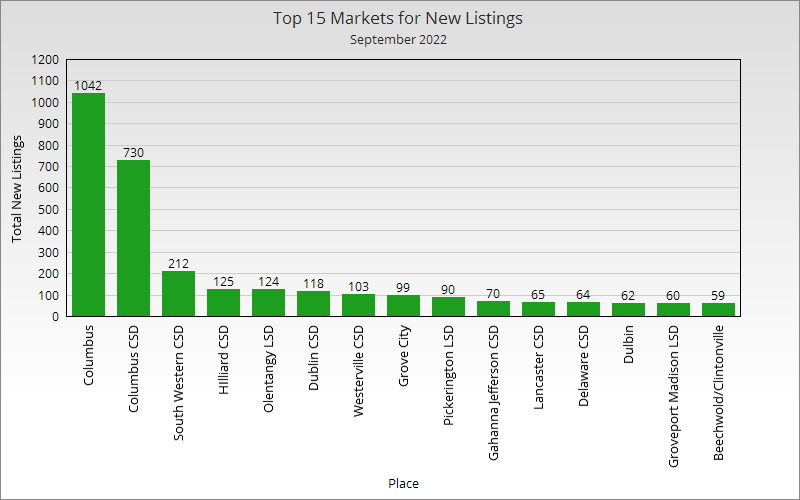
Now let’s take a look at individual neighborhoods and places within the metro area.

Housing market update September 2022 most expensive markets
New Albany and some of the other expected suburbs continued to top the charts, but with prices not quite as high as over the summer.

Housing market update September 2022 cheapest markets
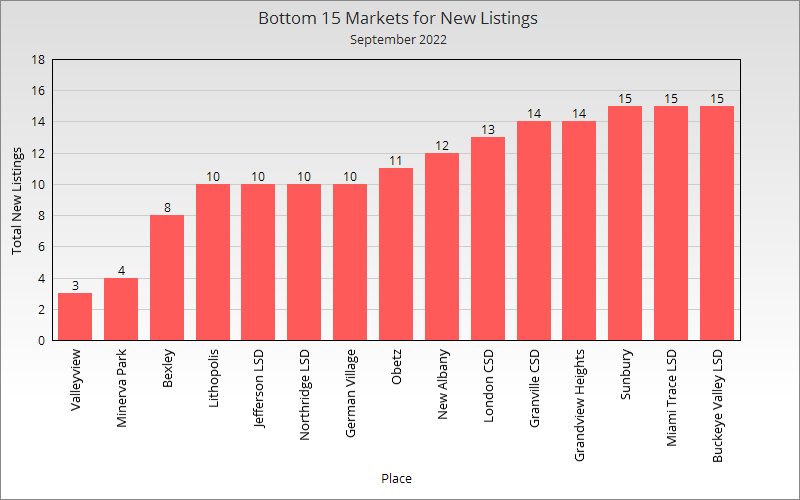
Just 4 local markets out of more than 50 remained below the $200K market in September. Columbus itself was in it usual spot closer to the *relatively* more affordable bottom.

Housing market update September 2022greatest market price percent change

Housing market update September 2022 lowest market sales price % change

Housing market update September 2022 new listings

Housing market update September 2022 county new listings change

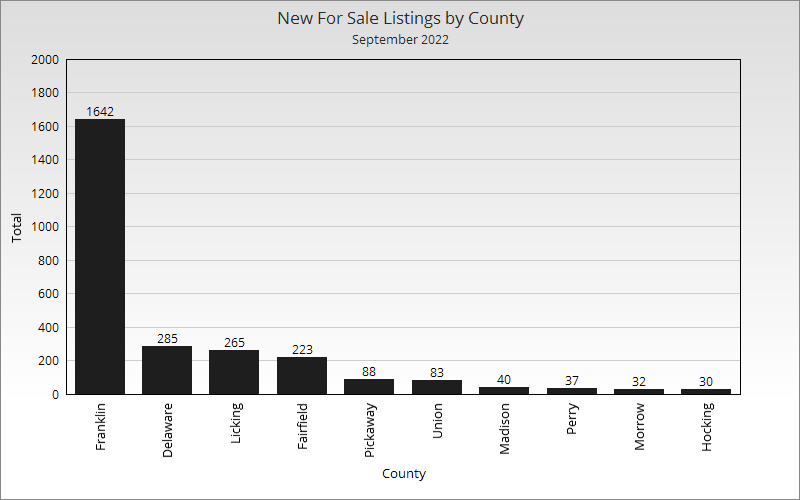
Total Metro New Listings in September 2022: 2,725
Total Metro New Listings Change from September 2021 to September 2022: -500
Year-over-year, new listings were down significantly across the metro area, but especially in Franklin County.

Housing market update September 2022 market listings

Housing market update September 2022 fewest market listings


Housing market update September 2022 county average days on market

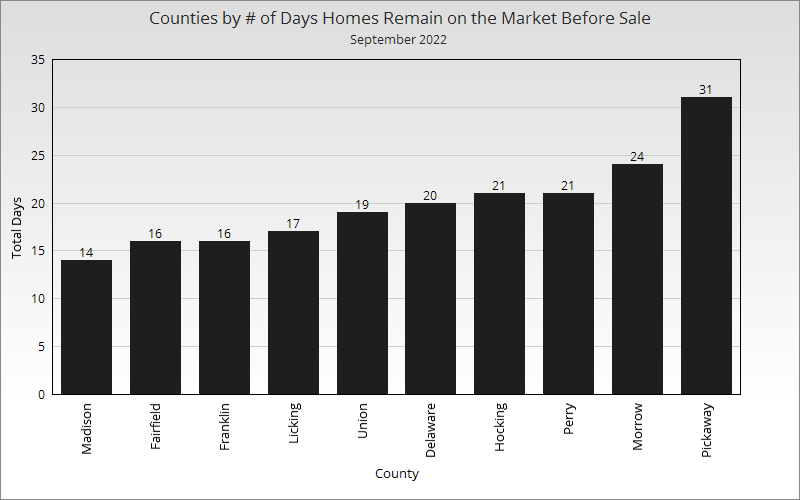
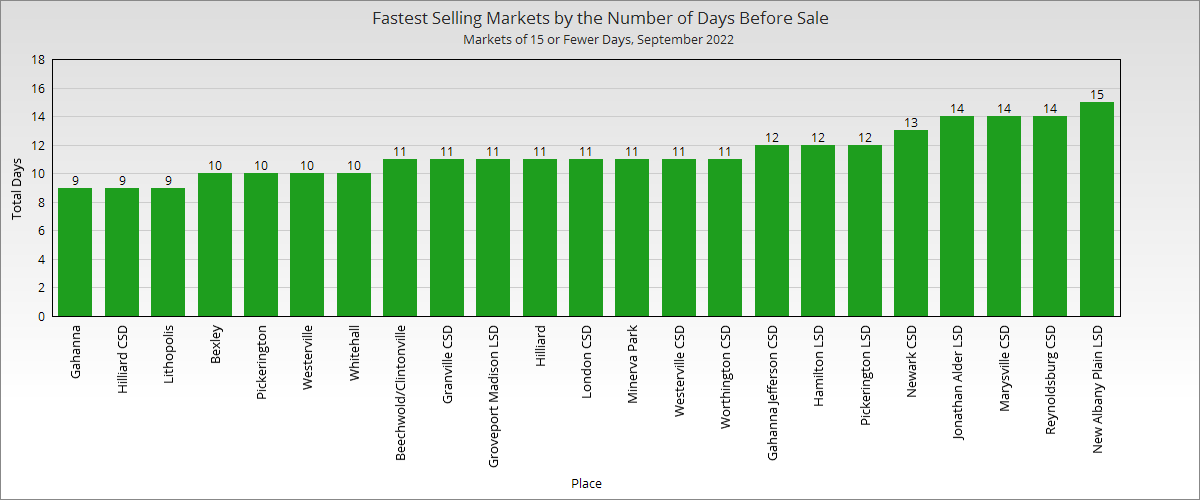
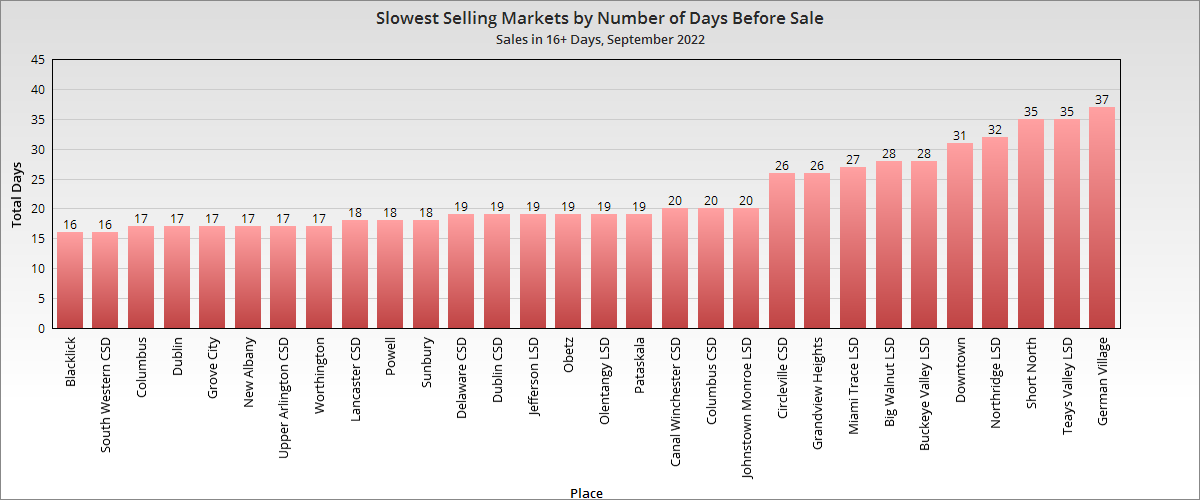
Average # of Days Homes Remain on the Market Before Sale for the Metro Overall in September 2022: 19.9
# of Days Homes Remain on the Market Before Sale for the Metro September 2021 vs. September 2022: -0.3

Homes across the market sold slightly faster than a year ago, but largely due to significant drops in a few rural counties. Most counties saw small increases.

Housing market update September 2022 fastest selling markets

Housing market update September 2022 slowest selling markets

Housing market update September 2022 fewest days before sale
Housing market update September 2022 most days before sale
The vast majority of local markets saw substantial increases in the number of days before sale, which is pretty much the only measurement indicating the seller’s market may finally be showing some signs of weakness.


Housing Market Update November 2013


housing market update November 2013 Columbus, Ohio

November home sales were down in Central Ohio for the 2nd straight month according to the Housing Market Update November 2013 data from Columbus Realtors. One main reason seems to be the culprit: There just aren’t enough houses to go around. Hot urban markets simply have a limited stock of homes with very few going up for sale at any one time, and builders still have not been building very much since the recession. Combined, the total number of homes for sale has declined to levels not seen since the early 2000s. This explains why most markets are still seeing gains in home prices while overall sales have fallen from the year before.

The bottom line is that demand is outpacing supply, and that situation doesn’t look to change anytime soon, especially in the urban core.

Here are the stats for the 21 major areas of Franklin County that I look at housing stats for.

Top 10 November 2013 Sales Totals
1. Columbus: 701
2. Dublin: 52
3. Clintonville: 49
4. Gahanna: 38
5. Upper Arlington: 38
6. Hilliard: 36
7. Reynoldsburg: 36
8. Grove City: 35
9. Westerville: 31
10. Canal Winchester: 20

Top 10 November 2013 Sales Increases over November 2012
1. Downtown: +50.0%
2. Grandview Heights: +14.3%
3. Clintonville: +6.5%
4. Hilliard: +5.9%
5. Minerva Park: +0.0%
6. New Albany: +0.0%
7. Obetz: +0.0%
8. Gahanna: -2.6%
9. Reynoldsburg: -5.3%
10. Grove City: -5.4%

Top 10 Year-to-Date Sales Through November 2013
1. Columbus: 9,561
2. Dublin: 747
3. Upper Arlington: 678
4. Clintonville: 656
5. Westerville: 580
6. Grove City: 568
7. Hilliard: 533
8. Gahanna: 494
9. Reynoldsburg: 466
10. Pickerington: 291

Top 10 Year-to-Date Increases Through November 2013 Over 2012
1. Minerva Park: +46.2%
2. Pataskala: +31.3%
3. Gahanna: +30.3%
4. Reynoldsburg: +28.0%
5. Whitehall: +27.3%
6. Hilliard: +27.2%
7. Clintonville: +24.2%
8. Grove City: +23.7%
9. Westerville: +23.4%
10. Bexley: +22.5%
10. Downtown: +22.5%

Average Sales November 2013
Urban: 79
Suburban: 28.7
Urban without Columbus: 16.8

Average % Change November 2013 vs. November 2012
Urban: -7.1%
Suburban: -11.6%
Urban without Columbus: -6.5%

Average YTD Sales Through November 2013
Urban: 1,097.7
Suburban: 435.9
Urban without Columbus: 251.4

Average YTD % Change YTD Through November 2013
Urban: +14.9%
Suburban: +19.9%
Urban without Columbus: +14.4%

Top 10 Average Sales Price November 2013
1. New Albany: $614,687
2. Bexley: $456,365
3. Dublin: $344,341
4. Upper Arlington: $326,913
5. Downtown: $302,464
6. Worthington: $296,328
7. German Village: $271,656
8. Grandview Heights: $257,001
9. Pataskala: $196,158
10. Hilliard: $193,756

Top 10 Average Sales Price % Change November 2013 Over November 2012
1. Worthington: +59.6%
2. Pataskala: +38.0%
3. Downtown: +36.7%
4. Bexley: +32.5%
5. Obetz: +30.8%
6. New Albany: +28.6%
7. Dublin: +21.6%
8. Whitehall: +10.1%
9. Minerva Park: +10.0%
10. Pickerington: +10.0%

Top 10 Average Sales Prices YTD Through November 2013
1. New Albany: $541,931
2. Upper Arlington: $364,369
3. Bexley: $351,282
4. Dublin: $335,164
5. German Village: $297,832
6. Downtown: $286,470
7. Worthington: $249,979
8. Grandview Heights: $226,458
9. Hilliard: $215,966
10. Gahanna: $198,612

Top 10 Average YTD Sales Price % Change Through November 2013 vs. 2012
1. Whitehall: +17.2%
2. Minerva Park: +17.1%
3. Downtown: +15.5%
4. Upper Arlington: +13.0%
5. Obetz: +12.3%
6. Gahanna: +11.6%
7. Reynoldsburg: +8.5%
8. New Albany: +8.3%
9. Worthington: +8.1%
10. Bexley: +4.9%

Average Sales Price November 2013
Urban: $227,811
Suburban: $229,942
Urban without Columbus: $238,166

Average Sales Price Change November 2012 vs. November 2012
Urban: +12.5%
Suburban: +6.0%
Urban without Columbus: +13.7%

Average Sales Price YTD
Urban: $217,072
Suburban: $223,394
Urban without Columbus: $226,041

Average Sales Price % Change YTD
Urban: +6.3%
Suburban: +4.9%
Urban without Columbus: +6.6%

Top 10 Fastest Selling Markets November 2013 (Based on Average # of Days for Listings to Sell)
1. Grandview Heights: 15
2. Westerville: 38
3. Clintonville: 40
4. Upper Arlington: 44
5. Hilliard: 47
6. Bexley: 49
7. Worthington: 57
8. Whitehall: 61
9. Dublin: 62
10. Minerva Park: 65
10. Obetz: 65

Top 10 Fastest Selling Markets YTD
1. Worthington: 40
2. Grandview Heights: 44
3. Upper Arlington: 45
4. Clintonville: 50
5. Westerville: 52
6. Hilliard: 54
7. Bexley: 58
8. Gahanna: 59
9. Dublin: 62
10. Grove City: 64

Average # of Days Before Sale, November 2013
Urban: 57.4
Suburban: 89.4
Urban without Columbus: 56.3

Average # of Days Before Sale YTD
Urban: 60.6
Suburban: 62.7
Urban without Columbus: 60.2

Top 10 Lowest Market Housing Supplies (Based on # of Months to Sell all Listings)
1. Worthington: 1.6
2. Upper Arlington: 2.1
3. Hilliard: 2.2
4. Minerva Park: 2.2
5. Bexley: 2.3
6. Clintonville: 2.4
7. Westerville: 2.4
8. Gahanna: 2.6
9. German Village: 2.6
10. Grandview Heights: 2.6

A healthy housing supply is considered to be around 5 months. Anything less than 3 months is considered very low. All of the 21 areas I looked at were below 5 months, indicating a county-wide shortage.

Average # of Months to Sell All Listings, November 2013
Urban: 2.8
Suburban: 3.6
Urban without Columbus: 2.7

Average % Change of Single-Family Home Sales November 2013 vs. November 2012
Urban: -1.7%
Suburban: -12.6%
Urban without Columbus: -0.5%

Average % Change of Single-Family Home Sales YTD vs. YTD 2012
Urban: +9.3%
Suburban: +19.4%
Urban without Columbus: +8.2%

Average % Change of Condo Sales November 2013 vs. November 2012
Urban: +23.3%
Suburban: +52.8%
Urban without Columbus: +26.6%

Average % Change of Condo Sales YTD vs. YTD 2012
Urban: +27.6%
Suburban: +26.4%
Urban without Columbus: +28.3%