The city and area may have its first accumulating snow this evening into Sunday, according to the Wilmington National Weather Service. Some may think that it’s a bit early for this to be happening, but in fact, there have been many years with far earlier first snowfalls. So what exactly were the earliest first snows in Columbus?
The earliest recorded measurable snowfall in Columbus occurred on October 10, 1906. A strong cold front brought rain on the 9th that changed to snow showers during the early morning hours of the 10th. The snow only amounted to 0.1″, but it was enough to be counted as officially the earliest measurable snowfall on record.
So the first traces of snow have occurred nearly a full month and a half prior to today’s date. In 2014, the first trace of snow occurred just a few weeks after the end of summer!
The average first snow in Columbus is typically between the 2nd and 3rd week of November, so really, this year’s first snow is arriving more or less right on schedule. Accumulations are predicted to be 1″ or less. Historic climatology records are available for all periods.
What are the worst heat waves in history? The climate in Ohio is gradually getting warmer and wetter, and persistent record heat is becoming ever more common, but do recent heatwaves compare to those of the past? Let’s find out.
To find out what the worst heatwaves were, I looked at average temperatures for different consecutive time periods- 2 days, 3 days, 7 days, 10 days, 14 days and 30 days. Unsurprisingly, some historically hot summers popped up, particularly from the 1930s.
Top 10 2-Day Periods with the Warmest Average High Temperature 1. 7/21-7/22/1934: 104.5 2. 7/20-7/21/1934, 7/8-7/9/1936, 7/11-7/12/1936, 7/13-7/14/1936: 103.5 3. 7/24-7/25/1934, 7/25-7/26/1934, 7/9-7/10/1936: 103.0 4. 7/3-7/4/1911, 8/5-8/6/1918, 7/10-7/11/1936: 102.5 5. 7/9-7/10/1881, 7/12-7/13/1936: 102.0 6. 7/3-7/4/1897, 7/21-7/22/1901, 6/27-6/28/1944: 101.5 7. 7/6-7/7/2012: 101.0 8. 7/8-7/9/1881, 7/4-7/5/1911, 6/28-6/29/1934, 7/14-7/15/1936: 100.5 9. 7/7-7/8/1881, 8/6-8/7/1918, 7/20-7/21/1930, 7/26-7/27/1941, 7/7-7/8/1988, 7/8-7/9/1988, 7/15-7/16/1988: 100.0 10. 7/10-7/11/1881, 7/17-7/18/1887, 7/2-7/3/1911, 8/4-8/5/1918, 7/19-7/20/1930, 7/26-7/27/1936, 9/1-9/2/1953, 9/2-9/3/1953, 7/13-7/14/1954, 8/3-8/4/1955, 7/5-7/6/2012: 99.5
Top 10 3-Day Periods with the Warmest Average High Temperature 1. 7/20-7/22/1934, 7/9-7/11/1936, 7/12-7/14/1936: 103.3 2. 7/24-7/26/1934, 7/8-7/10/1936, 7/10-7/12/1936, 7/11-7/13/1936: 102.7 3. 7/8-7/10/1881: 101.3 4. 7/2-7/4/1911, 8/5-8/7/1918, 7/21-7/23/1934, 7/7-7/9/1936: 101.0 5. 7/3-7/5/1911, 7/13-7/15/1936: 100.7 6. 7/7-7/9/1881, 7/10-7/12/1881, 8/4-8/6/1918: 100.3 7. 7/9-7/11/1881, 7/23-7/25/1934, 7/7-7/9/1988, 7/5-7/7/2012: 100.0 8. 7/3-7/5/1897, 7/19-7/21/1934, 7/22-7/24/1934, 7/4-7/6/2012: 99.7 9. 7/6-7/8/1881, 7/19-7/21/1930, 9/1-9/3/1953: 99.3 10. 7/26-7/28/1941, 6/26-6/28/1944, 8/30-9/1/1953, 8/31-9/2/1953, 8/2-8/4/1955, 7/6-7/8/1988: 99.0
Top 10 7-Day Periods with the Warmest Average High Temperature 1. 7/8-7/14/1936: 103.1 2. 7/9-7/15/1936: 102.1 3. 7/20-7/26/1934, 7/7-7/13/1936: 101.7 4. 7/10-7/16/1936: 100.7 5. 7/19-7/25/1934, 7/11-7/17/1936: 100.3 6. 7/6-7/12/1881, 7/6-7/12/1936: 100.0 7. 7/21-7/27/1934: 99.4 8. 7/7-7/13/1881: 99.1 9. 7/5-7/11/1881: 99.0 10. 7/4-7/10/1881, 8/28-9/3/1953: 98.6
Top 10 10-Day Periods with the Warmest Average High Temperature 1. 7/8-7/17/1936: 101.0 2. 7/7-7/16/1936: 100.8 3. 7/6-7/15/1936: 100.2 4. 7/9-7/18/196: 99.8 5. 7/5-7/14/1936: 99.2 6. 7/4-7/13/1881: 98.0 7. 7/10-7/19/1936: 97.9 8. 7/3-7/12/1881: 97.8 9. 7/5-7/14/1881, 7/17-7/26/1934, 7/18-7/27/1934, 7/19-7/28/1934: 97.7 10. 7/6-7/15/1881: 97.4
Top 10 14-Day Periods with the Warmest Average High Temperature 1. 7/5-7/18/1936, 7/6-7/19/1936: 97.9 2. 7/4-7/17/1936: 97.6 3. 7/7-7/20/1936: 97.5 4. 7/3-7/16/1936: 97.1 5. 7/8-7/21/1936: 96.5 6. 7/2-7/15/1936: 96.0 7. 7/2-7/15/1881, 7/4-7/17/1881, 7/9-7/22/1936: 95.6 8. 7/13-7/26/1934: 95.5 9. 7/14-7/27/1934, 7/15-7/28/1934, 7/1-7/14/1936: 95.4 10. 7/16-7/29/1901, 7/17-7/30/1901: 95.1
Top 10 30-Day Periods with the Warmest Average High Temperature 1. 6/29-7/28/1936: 92.7 2. 6/28-7/27/1936: 92.6 3. 6/27-7/26/1934: 92.5 4. 6/26-7/25/1934, 6/30-7/29/1936: 92.3 5. 6/28-7/27/1934: 92.2 6. 7/6-8/4/1936, 7/13-8/11/1955: 92.1 7. 7/10-8/8/1955, 6/28-7/27/2012: 92.0 8. 6/25-7/24/1934, 6/27-7/26/1936, 7/1-7/30/1936, 7/2-7/31/1936, 7/5-8/3/1936, 7/7-8/5/1936, 7/14-8/12/1955, 6/27-7/26/2012: 91.9 9. 6/29-7/28/1934, 6/26-7/25/1936, 7/3-8/1/1936, 7/4-8/2/1936, 7/8-8/6/1955, 7/9-8/7/1955, 6/18-7/17/2012, 6/20-7/19/2012: 91.8 1. 6/25-7/24/1936, 7/23-8/21/1955: 91.7
The heat waves in 1934 and 1936 dominated for high temperatures, and for the most part, nothing before or since has really come close. 1881, 1901, 1918, 1955 and 2012, among others, all make appearances.
Now that we’ve see the worst periods for high temperature, let’s look at the worst for the mean temperature, which is the average between the high and low. Because this measurement includes the low temperatures, it could be considered the definitive look at what the absolute hottest heat waves in history really were.
Top 10 2-Day Periods with the Warmest Average Temperature 1. 7/21-7/22/1934: 92.0 2. 7/9-7/10/1881: 91.5 3. 7/9-7/10/1936: 90.5 4. 7/20-7/21/1934: 90.3 5. 7/25-7/26/1934, 7/13-7/14/1936: 90.0 6. 7/10-7/11/1881, 7/3-7/4/1911: 89.8 7. 8/5-8/6/1918, 7/20-7/21/1930: 89.3 8. 7/10-7/11/1936: 89.0 9. 7/4-7/5/1911, 7/24-7/25/1934, 7/12-7/13/1936, 7/30-7/31/1999: 88.8 10. 7/11-7/12/1881, 8/6-8/7/1918, 7/8-7/9/1936, 7/11-7/12/1936: 88.5
Top 10 3-Days Periods with the Warmest Average Temperature 1. 7/20-7/22/1934: 90.5 2. 7/8-7/10/1881: 90.3 3. 7/9-7/11/1881: 90.0 4. 7/10-7/12/1881, 7/9-7/11/1936: 89.8 5. 7/12-7/14/1936: 89.5 6. 7/21-7/23/1934: 89.3 7. 7/7-7/9/1881: 89.0 8. 8/5-8/7/1918, 7/24-7/26/1934, 7/8-7/10/1936, 7/10-7/12/1936: 88.8 9. 7/11-7/13/1936: 88.7 10. 7/3-7/5/1911, 7/13-7/15/1936: 88.5
Top 10 7-Day Periods with the Warmest Average Temperature 1. 7/8-7/14/1936, 7/9-7/15/1936: 89.1 2. 7/6-7/12/1881: 89.0 3. 7/20-7/26/1934: 88.9 4. 7/7-7/13/1881: 88.6 5. 7/5-7/11/1881, 7/10-7/16/1936: 87.9 6. 7/19-7/25/1934: 87.7 7. 7/8-7/14/1881: 87.6 8. 7/21-7/27/1934: 87.5 9. 7/7-7/13/1936: 87.4 10. 7/4-7/10/1881: 86.9
Top 10 10-Day Periods with the Warmest Average Temperature 1. 7/8-7/17/1936: 87.4 2. 7/7-7/16/1936: 87.2 3. 7/5-7/14/1881, 7/6-7/15/1881, 7/9-7/18/1936: 87.1 4. 7/4-7/13/1881: 86.9 5. 7/6-7/15/1936, 7/7-7/16/1881: 86.6 6. 7/3-7/12/1881: 86.2 7. 7/19-7/28/1934: 86.0 8. 7/18-7/27/1934, 7/10-7/19/1936: 85.7 9. 7/20-7/29/1934, 7/5-7/14/1936: 85.6 10. 7/8-7/17/1881, 7/17-7/26/1934: 85.4
Top 10 14-Day Periods with the Warmest Average Temperature 1. 7/3-7/16/1881, 7/4-7/17/1881: 85.1 2. 7/6-7/19/1936: 85.0 3. 7/5-7/18/1936: 84.9 4. 7/7-7/20/1936: 84.6 5. 7/2-7/15/1881, 7/5-7/18/1881, 7/4-7/17/1936: 84.5 6. 7/3-7/16/1936: 84.3 7. 7/6-7/19/1881, 7/8-7/21/1936, 7/18-7/31/1940: 83.9 8. 7/13-7/26/1934, 7/14-7/27/1934, 7/15-7/28/1934: 83.8 9. 7/2-7/15/1936: 83.7 10. 7/1-7/14/1881: 83.6
1934 and 1936 still dominate, but other years show up more often as well. Only 2012 shows up with anything in the last 60 years, though. That year also saw one of the worst wind events in Ohio history, partially fueled by the heat of that summer: North American Derecho of 2012
Finally, let’s look at periods that featured consecutive days with highs of 90 degrees or higher. What are the longest?
# of Consecutive Days with Highs 90 or Above 1. 7/3-7/16/1881: 14 2. 7/18-7/30/1940: 13 3. 6/24-7/5/1934, 7/7-7/18/1936, 6/28-7/9/1949, 7/21-8/1/1999, 6/29-7/10/2020: 12 4. 7/20-7/30/1901, 8/4-8/14/1918, 8/25-9/4/1953, 8/8-8/18/1988, 6/28-7/8/2012: 11 5. 7/27-8/5/1887, 9/7-9/16/1897, 7/29-8/7/1955, 6/13-6/22/1994: 10
A short video and article from 2016 about the 1936 heatwave, still the hottest in history. 1936 Heat Wave
Republished with data through the 2019-2020 winter.
As we go into the winter season, it’s time to talk about how this one might end up. There’s a belief that fall weather is a good sign of how cold or warm winter will be. Let’s see if that holds true.
First, let’s just look at October temperatures. The October normal mean temperature for Columbus is 55 degrees.
Between 1878 and 2019, there have been 47 Octobers that featured a mean temperature of 53.9 degrees or lower, what we’re considering a Cold October for the purposes of this comparison. Of those 47 Octobers, 27 of the 47 had following winters that were colder than normal, or 57.4%, 13 had average temperature winters, or 27.7%, and the remaining 7 were warmer than normal, or 14.9%. Interestingly, this category contains both the warmest winter on record- 1889-1890 and the coldest on record- 1976-1977- as shown by the chart below.
Next, we look at Normal Octobers, which are +/- 1 degree of the 1981-2010 Average of 55 degrees. Between 1878 and 2019, there were 45 normal Octobers. Of those, 21 had colder than normal following winters, or 46.7%. 11 were followed by normal winters, or 24.4%, and 13 had warmer than normal winters, or 28.9%.
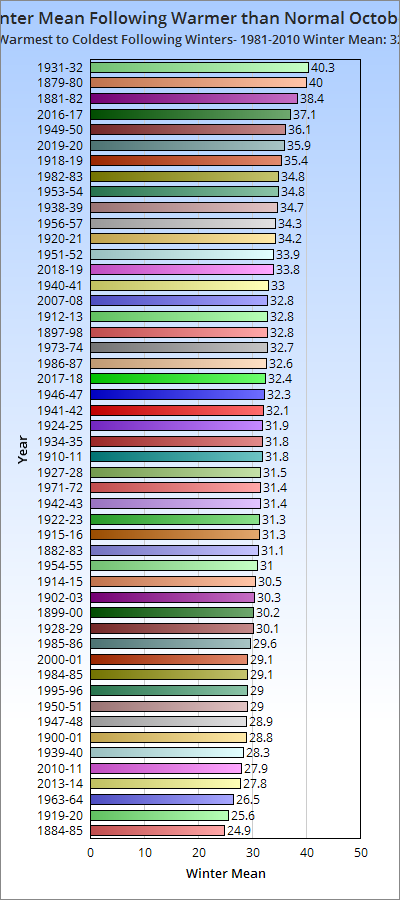
Finally, let’s look at warm Octobers, which are those with means of 56.1 degrees or higher. There were 49 Octobers with warmer than normal means since 1878. Of those, 18 featured following winters that were colder than normal, or 36.7%. Another 19, or 38.8%, were followed by average winters. The final 12 winters, or 24.5%, were warmer than normal. Here’s the graph.
So just based on the October mean temperature, Octobers that are colder than normal are almost twice as likely as normal Octobers and almost 4x as likely as warm Octobers to be followed by a cold winter. But what about Novembers? It is closer to winter itself, so does its weather matter even more?
Colder than normal Novembers- 43.3 degrees or lower- included 80 Novembers since 1878. Of those, 38 or 47.5% had colder than normal winters. 22 (27.5%) had normal winters and 19, or 23.8%, had warmer than normal winters.
With the 39 normal Novembers, 43.4 to 45.4 degrees, there were 18 that had colder than normal winters, or 46.2%, with 12 normal winters (30.8%) and 9 warmer than normal winters (23.1%).
Finally, there were 24 warmer than normal Novembers since 1878- 45.5 degrees or higher. Only 6, or 25%, were followed by cold winters. An additional 9 (37.5%) were normal, while the last 9 (37.5%) were warmer than normal.
To reiterate, here are the ranked percentages of cold winters by the preceding October or November. 1. Cold Octobers: 57.4% 2. Cold Novembers: 47.5% 3. Normal Octobers: 46.7% 4. Normal Novembers: 46.2% 5. Warm Octobers: 36.7% 6. Warm Novembers: 25.0%
It should be no surprise that cold Octobers and Novembers have a stronger correlation to the following winters also being colder, with colder winters becoming increasingly unlikely as those months warm. What is surprising is that October weather, across the board, was more predictive of cold winters than Novembers were.
Going further, though, what about bi-monthly combinations?
Rank of Bi-Monthly Combinations and the percentage of colder than normal following winters, along with total years in sample: Normal October/Normal November: 87.5% 8 Years Cold October/Warm November: 57.1% 7 Years Cold October/Cold November: 53.8% 26 Years Normal October/Cold November: 48.1% 27 Years Warm October/Cold November: 40.7% 27 Years Cold October/Normal November: 38.5% 13 Years Warm October/Warm November: 28.6% 7 Years Warm October/Normal November: 25.0% 16 Years Normal October/Warm November: 0.0% 8 Years
So a normal fall is clearly the best, but the sample size is not particularly high. Normal to Warm is unanimously warm, but again, it has a small sample size.
So does fall weather ultimately have a correlation to winter severity? To some degree yes, as patterns established in the fall tend to appear in the winter as well, but October, rather than November, has a clear higher correlation. But as with everything, there are many other factors involved.
October 2020 looks to at least begin with below normal temperatures, but it remains to be seen how it ends up.