For the Housing Market Update August 2022, data from Columbus Realtors shows that the overall market saw a decrease in home sales and units on the market versus a year ago, a situation that contributed to the continuation of rising prices. So far, it doesn’t appear there has been any sustained impact yet from increasing interest rates.
More data was added to this update than usual, including some county-level information.
Note: LSD= Local School District, CSD= City School District. In both cases, school district boundaries differ from city boundaries.
Median Sales Price By Columbus Metro County in August 2022 and Total Change vs. August 2021
1. Delaware: $448,000 +$34,000
2. Union: $420,000 +$83,500
3. Fairfield: $308,950 +$13,950
4. Hocking: $306,000 +$135,550
5. Pickaway: $295,000 +$42,000
6. Franklin: $285,700 +$15,700
7. Licking: $285,500 +$10,600
8. Madison: $272,000 +$9,500
9. Morrow: $230,000 +$50,000
10. Perry: $216,000 -$4,000
Median Sales Price % Change August 2022 vs. August 2021
1. Hocking: +79.5%
2. Morrow: +27.8%
3. Union: +24.8%
4. Pickaway: +16.6%
5. Delaware: +8.2%
6. Franklin: +5.8%
7. Fairfield: +4.7%
8. Licking: +3.9%
9. Madison: +3.6%
10. Perry: -1.8%
Licking County saw relatively low growth in its home prices the past year, but that is almost certainly to change in the near future. Franklin County median home prices are still in the bottom half for total and growth.
Overall Market Median Sales Price in August: $306,715
Based on the 10 Columbus Metro Area counties. This price was a bit lower than in July, but almost $40,000 higher than August, 2021.
Top 15 Most Expensive Locations By Median Sales Price in August 2022
1. New Albany: $750,000
2. Grandview Heights: $685,000
3. New Albany Plain LSD: $575,500
4. Bexley: $575,000
5. Powell: $563,000
6. German Village: $554,500
7. Dublin: $552,500
8. Upper Arlington CSD: $540,000
9. Olentangy LSD: $500,000
10. Dublin CSD: $485,000
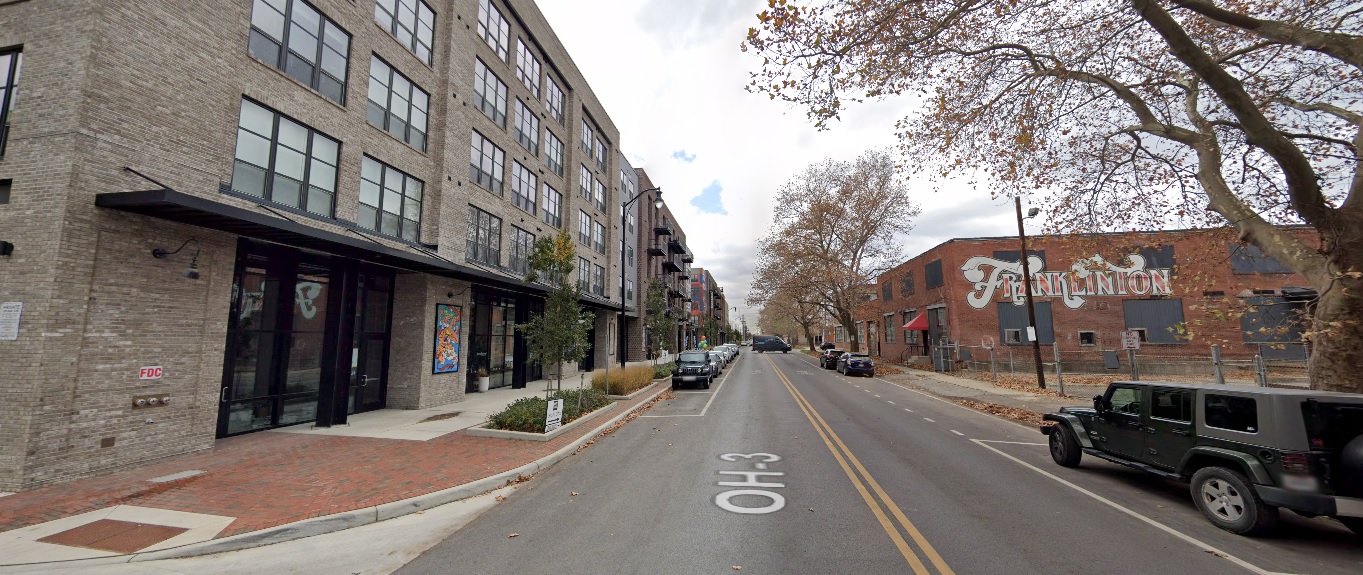
11. Short North: $465,000
12. Jonathan Alder LSD: $443,900
13. Granville CSD: $426,500
14. Northridge LSD: 417,340
15. Big Walnut LSD: $414,000
Median prices were generally lower in August than July, but still up versus August 2021.
Top 15 Least Expensive Metro Locations by Median Sales Price in August 2022
1. Circleville CSD: $150,000
2. Whitehall: $171,600
3. Valleyview: $184,900
4. Hamilton LSD: $187,500
5. Miami Trace LSD: $203,000
6. Lancaster CSD: $210,000
7. Jefferson LSD: $219,750
8. Newark CSD: $220,000
9. Columbus CSD: $234,900
10. Groveport Madison LSD: $250,000
11. Columbus: $256,000
12. South Western CSD: $273,700
13. Reynoldsburg CSD: $276,450
14. London CSD: $276,750
15. Minerva Park: $284,950
Top 15 Metro Locations with the Highest Median Sales Price % Growth Between August 2021 and August 2022
1. Bexley: +70.4%
2. Newark CSD: +29.4%
3. Obetz: +28.8%
4. London CSD: +25.8%
5. Grove City: +20.7%
6. Valleyview: +19.3%
7. Teays Valley LSD: +19.2%
8. Grandview Heights: +19.1%
9. Marysville CSD: +18.4%
10. Hilliard: +17.9%
11. Beechwold/Clintonville: +17.0%
12. Gahanna: +17.0%
13. Powell: +16.7%
14. New Albany: +16.3%
15. New Albany Plain LSD: +15.8%
16. Blacklick: +15.7%
Top 15 Locations with the Lowest Median Sales Price % Growth Between August 2021 and August 2022
1. Circleville CSD: -20.6%
2. Minerva Park: -9.3%
3. Granville CSD: -6.3%
4. Hamilton LSD: -3.8%
5. Jefferson LSD: -3.2%
6. Lancaster CSD: -2.8%
7. Big Walnut LSD: -0.4%
8. Buckeye Valley LSD: +0.9%
9. Downtown: +1.0%
10. Sunbury: +1.1%
11. Westerville: +2.2%
12. Johnstown-Monroe LSD: +3.2%
13. Columbus: +3.6%
14. Canal Winchester CSD: +4.3%
15. Westerville CSD: +4.5%
Overall Market Median Sales Price % Change August 2022 vs. August 2021: +14.6%
New Listings by Metro County in August 2022 and Change From August 2021
1. Franklin: 1,837 -361
2. Delaware: 314 -46
3. Licking: 255 -56
4. Fairfield: 230 -61
5. Pickaway: 91 +2
6. Union: 90 -19
7. Madison: 44 -4
8. Morrow: 40 -23
9. Hocking: 35 -9
10. Perry: 35 +7
Total Metro New Listings in August 2022: 2,971
Total Metro New Listings Change from August 2021 to August 2022: -570
% Change of New Listings by Metro County August 2021-August 2022
1. Morrow: -36.5%
2. Fairfield: -21.0%
3. Hocking: -20.5%
4. Licking: -18.0%
5. Union: -17.4%
6. Franklin: -16.4%
7. Delaware: -12.8%
8. Madison: -8.3%
9. Pickaway: +2.2%
10. Perry: +25.0%
% Change of Metro New Listings August 2021 to August 2022: -16.1%
New listings continued year-over-year declines. Until the supply really starts to grow- or demand falls- prices will continue to rise.
Top 10 Locations with the Most New Listings in August 2022
1. Columbus: 1,224
2. Columbus CSD: 856
3. South Western CSD: 192
4. Olentangy LSD: 155
5. Hilliard CSD: 135
6. Westerville CSD: 122
7. Dublin CSD: 111
8. Pickerington LSD: 87
9. Upper Arlington CSD: 81
10. Grove City: 71
Top 10 Locations with the Fewest New Listings in August 2022
1. Valleyview: 1
2. Minerva Park: 3
3. Lithopolis: 6
4. Obetz: 6
5. Jefferson LSD: 8
6. Granville CSD: 9
7. Sunbury: 11
8. New Albany: 12
9. Grandview Heights: 13
10. Northridge LSD: 14
11. Miami Trace LSD: 14
12. German Village: 16
13. Bexley: 16
Metro Counties by # of Days Homes Remain on the Market Before Sale in August 2022
1. Fairfield: 12
2. Franklin: 13
3. Licking: 13
4. Union: 14
5. Delaware: 16
6. Perry: 16
7. Madison: 18
8. Hocking: 22
9. Pickaway: 26
10. Morrow: 36
Average # of Days Homes Remain on the Market Before Sale for the Metro Overall in August 2022: 18.6
# of Days Homes Remain on the Market Before Sale for the Metro August 2021 vs. August 2022: +7.0
In one of the few signs of a potential slowdown, homes took a week more on average to sell than they did during the same period last year.
Top 10 Fastest-Selling Locations by # of Days Homes Remain on the Market Before Sale in August 2022
1. Valleyview: 4
2. Blacklick: 6
3. Lithopolis: 6
4. Gahanna: 7
5. Gahanna Jefferson CSD: 8
6. Pickerington: 8
7. Pickerington LSD: 8
8. Granville CSD: 9
9. Newark CSD: 9
10. Powell: 9
11. Reynoldsburg CSD: 9
12. Buckeye Valley LSD: 10
13. Dublin: 10
14. Hilliard: 10
15. Hilliard CSD: 10
16. Marysville CSD: 10
17. Westerville CSD: 10
18. Canal Winchester CSD: 11
19. German Village: 11
20. Johnstown-Monroe LSD: 11
21. Northridge LSD: 11
22. Sunbury: 11
23. Westerville: 11
24. Worthington CSD: 11
25. Circleville CSD: 12
26. Delaware CSD: 12
27. Grandview Heights: 12
28. Groveport Madison LSD: 12
29. Worthington: 12
30. Columbus: 13
31. Dublin CSD: 13
32. South Western CSD: 13
33. Hamilton LSD: 14
34. Lancaster CSD: 14
35. Whitehall: 14
Top 10 Slowest-Selling Locations by # of Days Homes Remain on the Market Before Sale in August 2022
1. Downtown: 47
2. Obetz: 33
3. Teays Valley LSD: 32
4. Miami Trace LSD: 28
5. Short North: 26
6. Minerva Park: 22
7. Pataskala: 22
8. Big Walnut LSD: 20
9. New Albany: 20
10. New Albany Plain LSD: 19
11. Upper Arlington CSD: 18
12. Olentangy LSD: 17
Top 10 Locations with the Greatest % Decline of # of Days on the Market Before Sale August 2022 vs. August 2021
1. Valleyview: -69.2%
2. Powell: -52.6%
3. Sunbury: -50.0%
4. Grandview Heights: -45.5%
5. German Village: -35.3%
6. Downtown: -29.9%
7. Gahanna Jefferson CSD: -27.3%
8. New Albany: -25.9%
9. Bexley: -20.0%
10. Short North: -7.1%
Top 10 Locations with the Lowest % Decline of # of Days on the Market Before Sale August 2022 vs. August 2021
1. Teays Valley LSD: +300.0%
2. Miami Trace LSD: +211.1%
3. Delaware CSD: +200.0%
4. Groveport Madison LSD: +200.0%
5. Whitehall: +180.0%
6. Minerva Park: +175.0%
7. Pataskala: +175.0%
8. Northridge LSD: +120.0%
9. Obetz: +120.0%
10. Lithopolis: +100.0%
11. Pickerington: +80.0%
12. London CSD: +77.8%
13. Circleville CSD: +71.4%