Columbus saw a ton of new development proposals the past year, but not all of them have a future. Here are 3 major Columbus proposals that died in 2021.
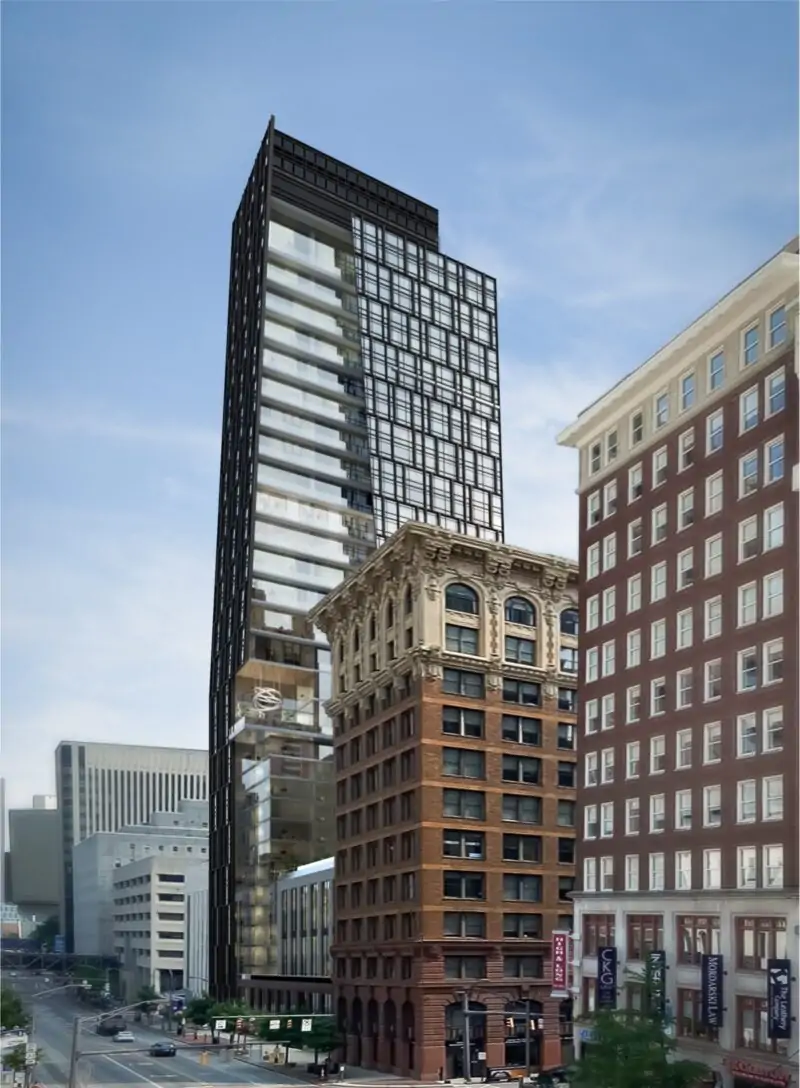
Harmony Tower Originally announced in the summer of 2020, this proposal called for a 30-story, mixed-use tower to replace a parking lot at 158 N. High Street Downtown. The $100+ million project would’ve included a hotel, 15 floors of condos, office and retail space. After announcing the project, Schiff Capital went silent and the project basically disappeared. There were no updates, no news. In some ways, it was a reminder of the way Arshot had gone silent on the SPARC project years earlier. Sometime over the summer of 2021, plans for the tower were quietly abandoned, though no reason was given as to why. Speculation for its cancellation mostly revolved around Covid and its consequences related to supply chains and rapidly rising costs of construction materials. Sadly, this was not the only skyline-altering proposal that went belly-up this year.
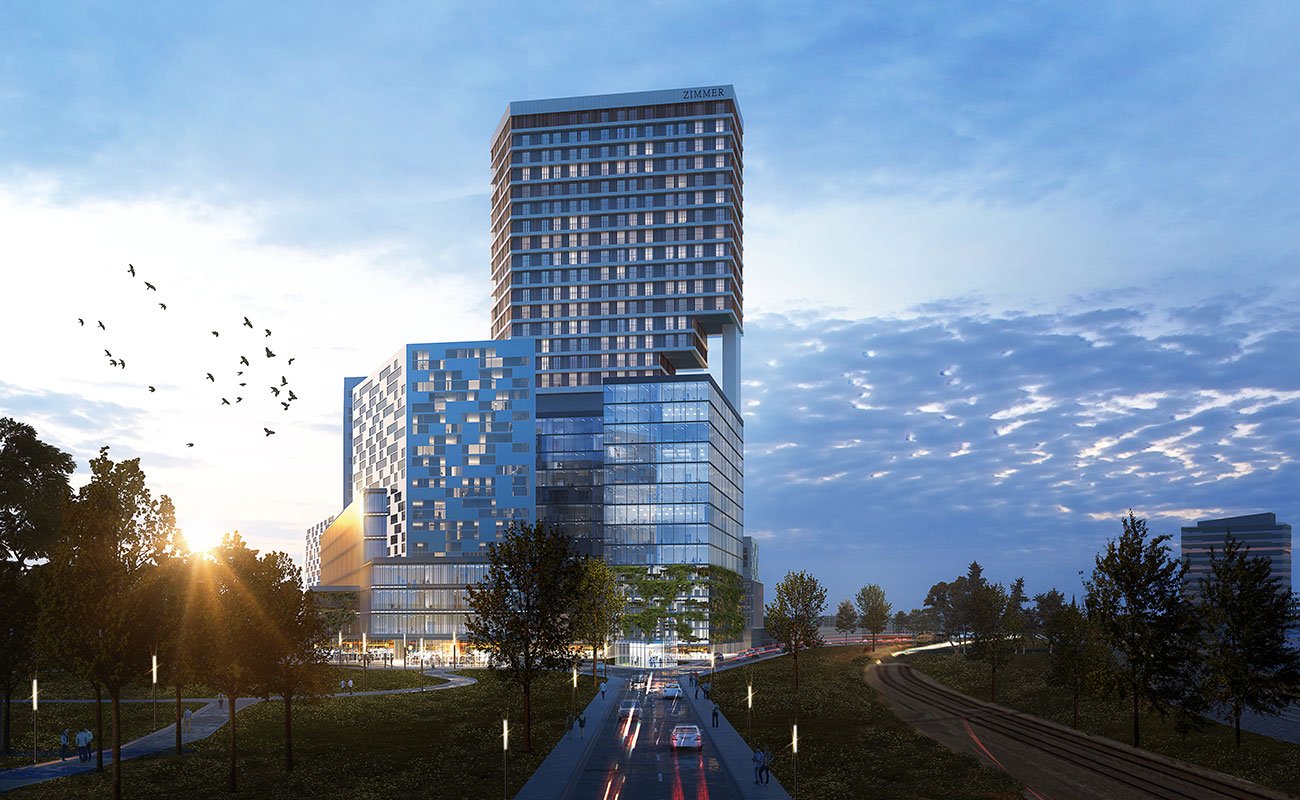
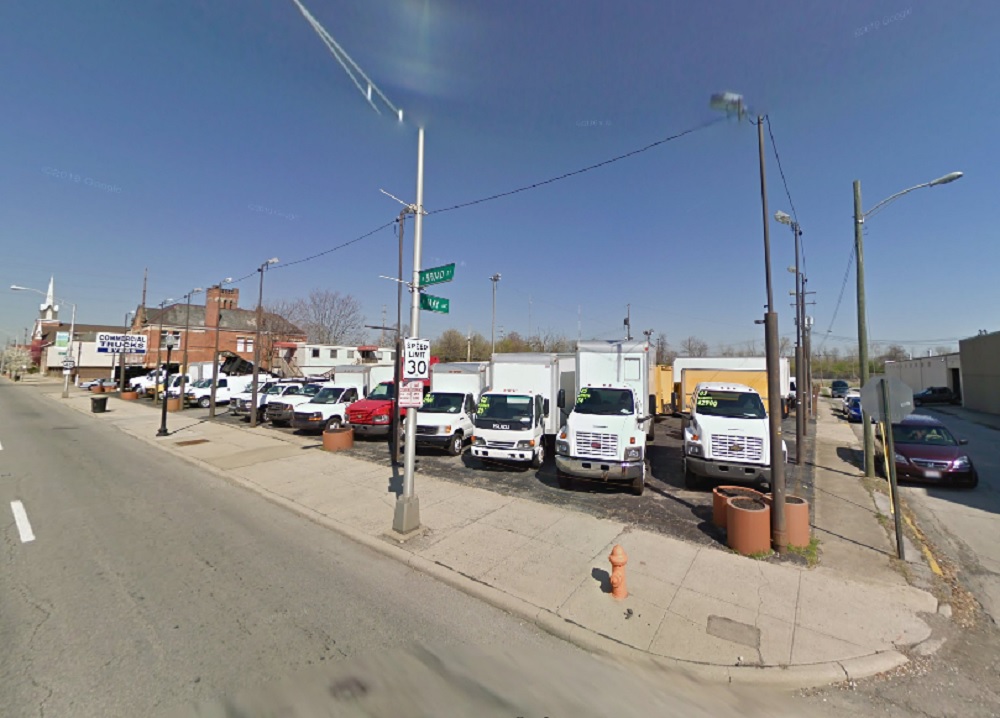
Whittier Peninsula Tower At the end of 2019, a North Carolina company announced a proposal for a significant new development along the railroad tracks just to the east of Scioto-Audubon Metro Park in the Brewery District. The plan called for for the multi-phase development of 10 buildings, including a mixed-use tower that would reach up to 30-stories, with a 7-story and 12-story containing another 400 residential units and retail and office space making up the first phase. The use makeup of the 30-story tower and other buildings had not been determined fully at the time.
Rendering of the original 30-story tower.
As with Harmony tower, after the initial announcement there was radio silence for months. 18 months later, in June of this year, new renderings for the proposal all but confirmed that the project had gone through a serious downsizing. Instead of 10 buildings with heights between 7-30 stories, the update consisted of just 5 6-story apartment and retail buildings. Unfortunately, the scaling down wasn’t finished. In early October of this year, yet another update was released. In it, the 5 6-story buildings had been reduced to to just 3. So the number of buildings had been reduced by 70%, and the top height was now 5x shorter than the original proposal. To me, it seems like a pretty blatant case of the developer never having the necessary resources- or ability to access the necessary resources- required for the original proposal, and by the end of it, the neighborhood development commission was just happy to approve whatever leftovers the developer had really intended to build all along.
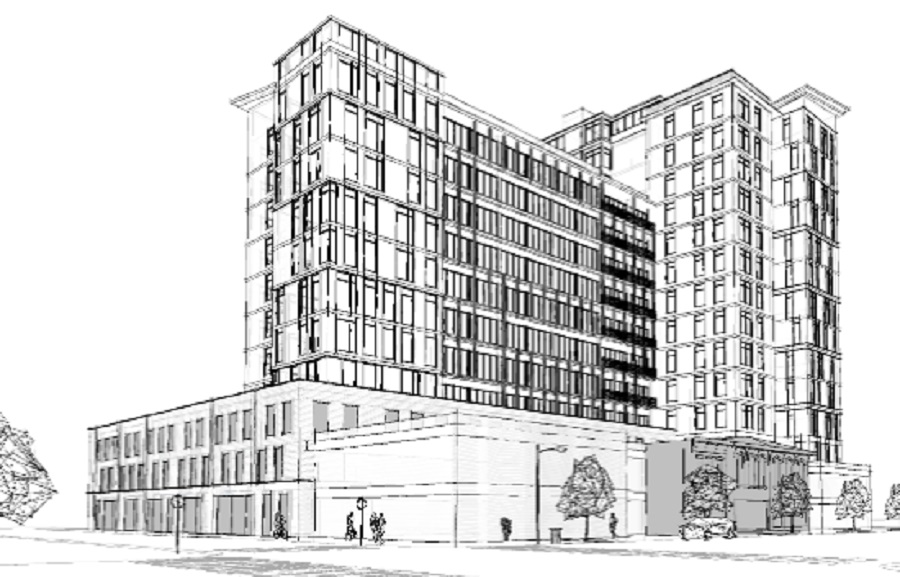
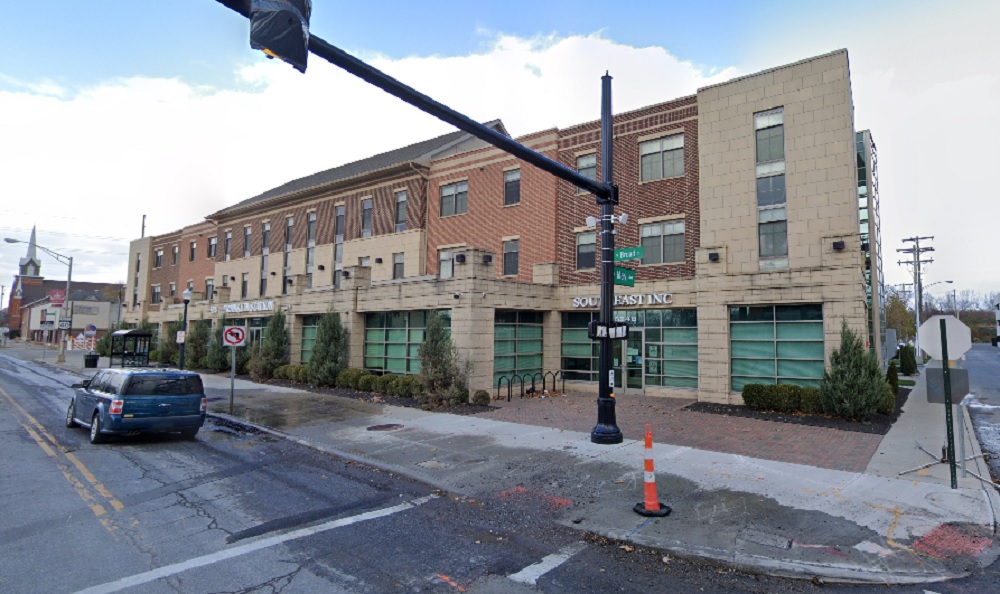
The Mondrian The Mondrian was originally a 13-story tower for 567 W. Broad in Franklinton. It was by far the largest proposal for Franklinton to date in its new revival. The Mondrian would’ve had 80 residential units and ground-floor retail space along Broad Street.
The 15-story Mondrian proposal rendering from Spring 2021.
In April we found out that the proposal had actually increased in height to 15 stories, likely to try to take advantage of new, large-project state tax credits, but otherwise, there was no known movement on this project. We know by now that no news on a big project tends to be bad news, and while there has been no official word that this project has been canceled, the evidence points that it has met an end. It was reported earlier this month that the listed site for the project is now up for sale, indicating that the proposal is likely dead. That said, this project could still have some legs to it and the situation will be monitored until a more definitive answer is known.
Proposals come and go, and in a city growing as fast as Columbus, the more proposals the city gets, the more likely it is that some of them never come to fruition.
Franklinton has been known as The Bottoms for many years, mainly because the low-lying neighborhood has seen flooding more often than anywhere else in the city. With the completion of the Franklinton Floodwall nearly 20 years ago, the neighborhood has been seeing redevelopment at an ever-increasing pace. This Before and After of the neighborhood only covers some of the changes, and another similar post detailing more changes will most likely be needed.
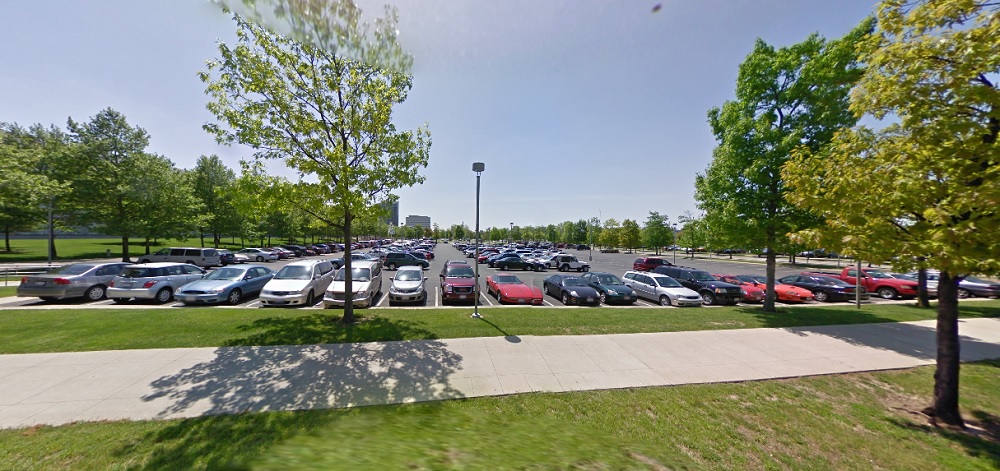
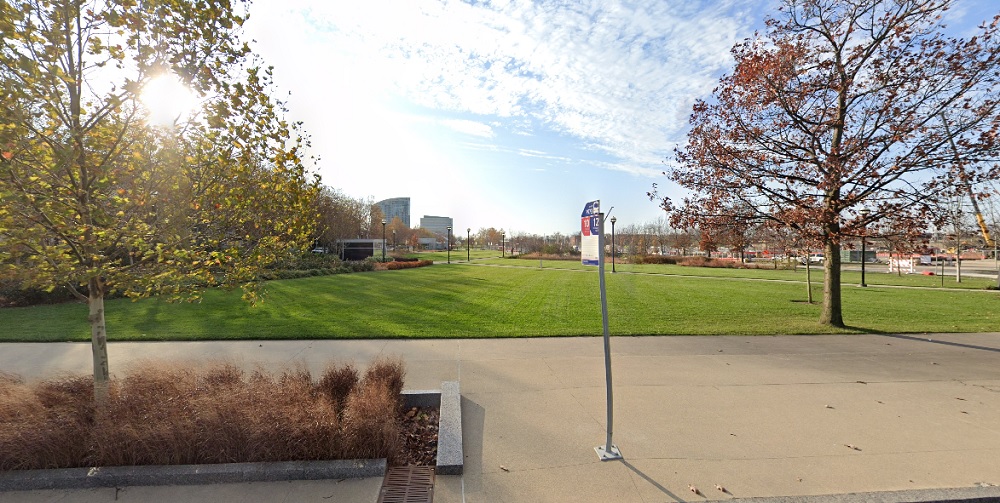
Before: COSI Parking Lot in 2009 This large parking lot had once been part of Central High School’s campus and was originally the site of the schools track and athletic fields. After the school closed in the early 1980s, the area was converted to a large parking lot. It continued its life as parking when COSI moved from Downtown to a new facility in the converted school. When plans for the Scioto Peninsula to be redeveloped emerged, it was decided to turn the parking lot into a brand new park. After: New Park in 2020 The parking was not actually lost, however. An underground garage was constructed beneath the park itself, which is now called Dorian Green. New development, which will include offices, retail and hundreds of new residences, can be seen under construction in the background.
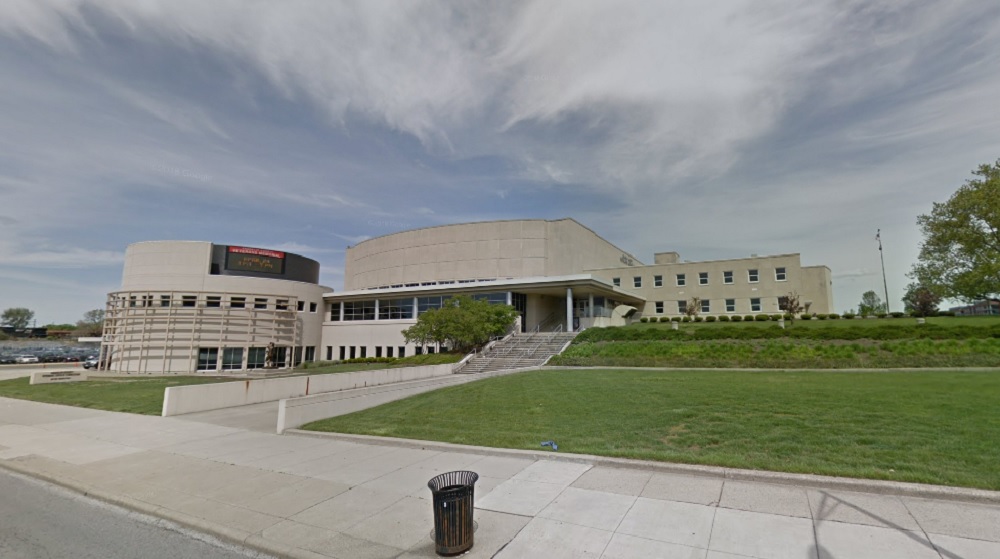
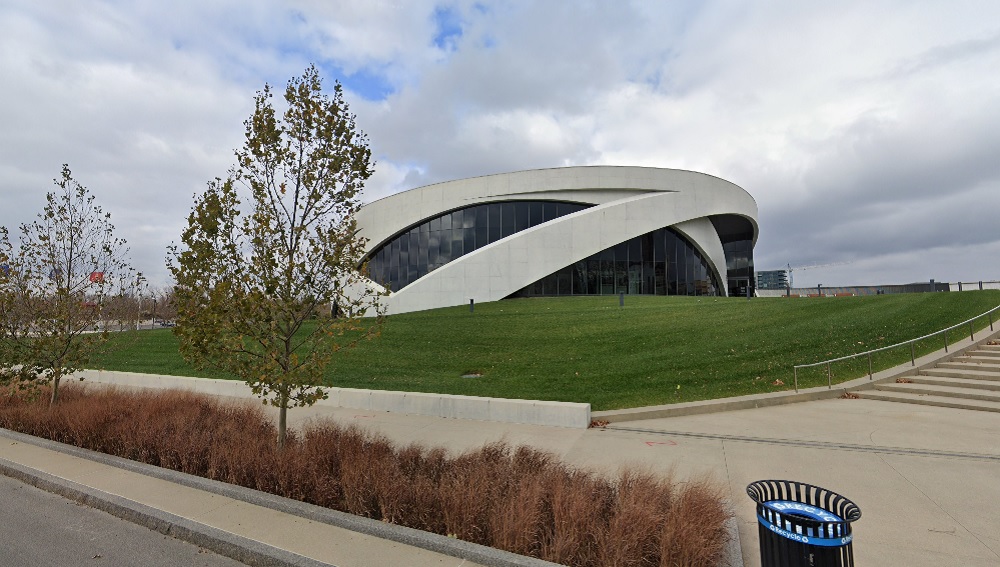
Before: Veterans Memorial in 2011 The old Veterans Memorial was constructed in the mid-1950s. Over the subsequent decades, the building was renovated and expanded multiple times. By the 2000s, the building was considered outdated with a convoluted layout. Despite some objections, it was decided that the complex would be torn down and replaced with a new veterans center. After: National Veterans Memorial and Museum in 2020 The new building had a far more modern, almost futuristic design, like something out of an X-Men movie. The new building was to remain a veterans memorial with office and event space, but also serve as a museum. It was eventually given the status of being the National Veterans Memorial, the only one of its kind in the nation.
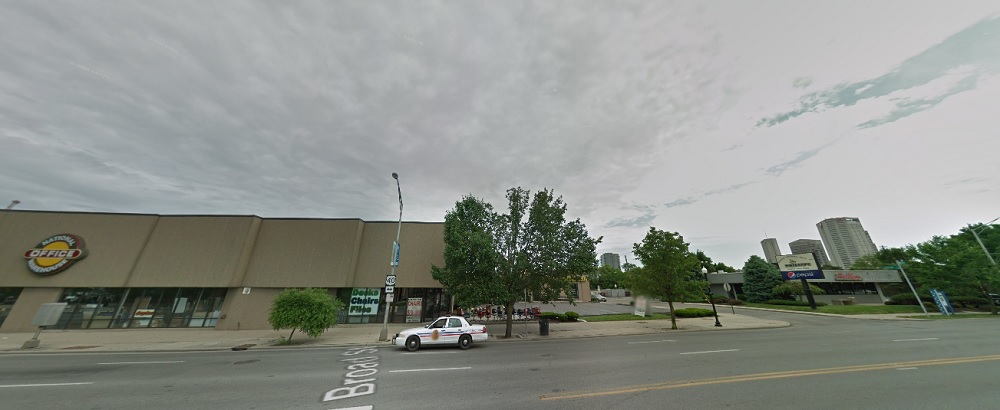
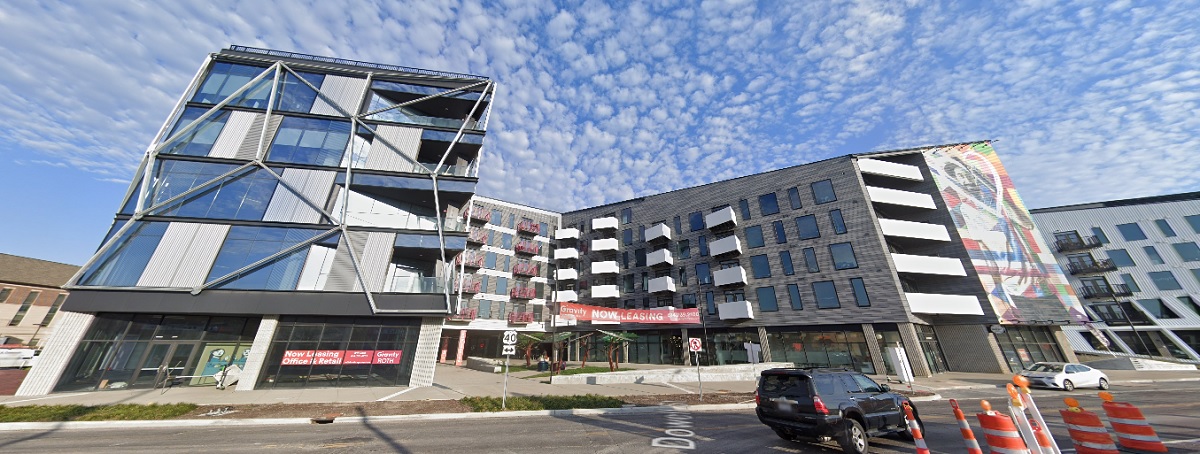
Before: 500 West Broad Street in 2011 Back in 2011, 500 W. Broad was a collection of small businesses, most notably Wasserstrom restaurant supply. This stretch of Broad was unremarkable and a more modern remnant of urban renewal during the mid-20th Century. After: 500 West Broad in 2020 Today, the first phase of the Gravity development occupies the entire stretch. This unique mixed-use development contains, among other things, apartments, retail space, community art and activity space for its residents. Directly across the street, the 2nd- and much larger- phase of Gravity is currently under construction.
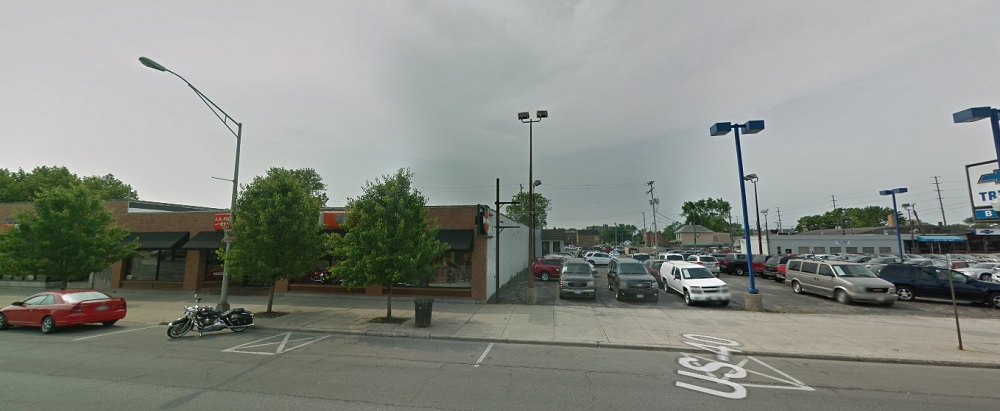
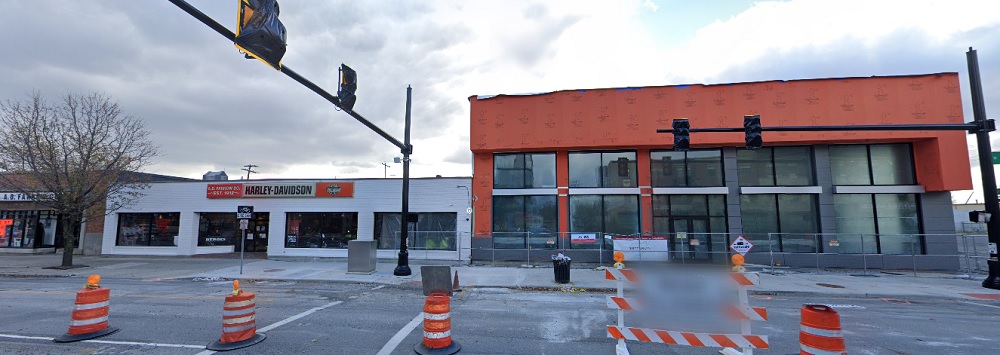
Before: A.D. Farrow Harley Davidson in 2012 A century after the business was established, this Harley Davidson sales shop just down the street from Gravity looked out of date. Half the site was also a parking lot that fronted Broad Street. After: A.D. Farrow Harley Davidson in 2020 In 2020, the business was engaged in a significant remodel and expansion. Local business investments such as this have been on the rise in Franklinton in recent years, especially east of 315.
Before: 524 West Broad in 2009 This site had been used as a car lot for some time. The original buildings had been demolished in the early 1960s, replaced with surface parking. After: 524 West Broad in 2020 Today the site is home to Franklinton Station, a lower-income residential complex for seniors.
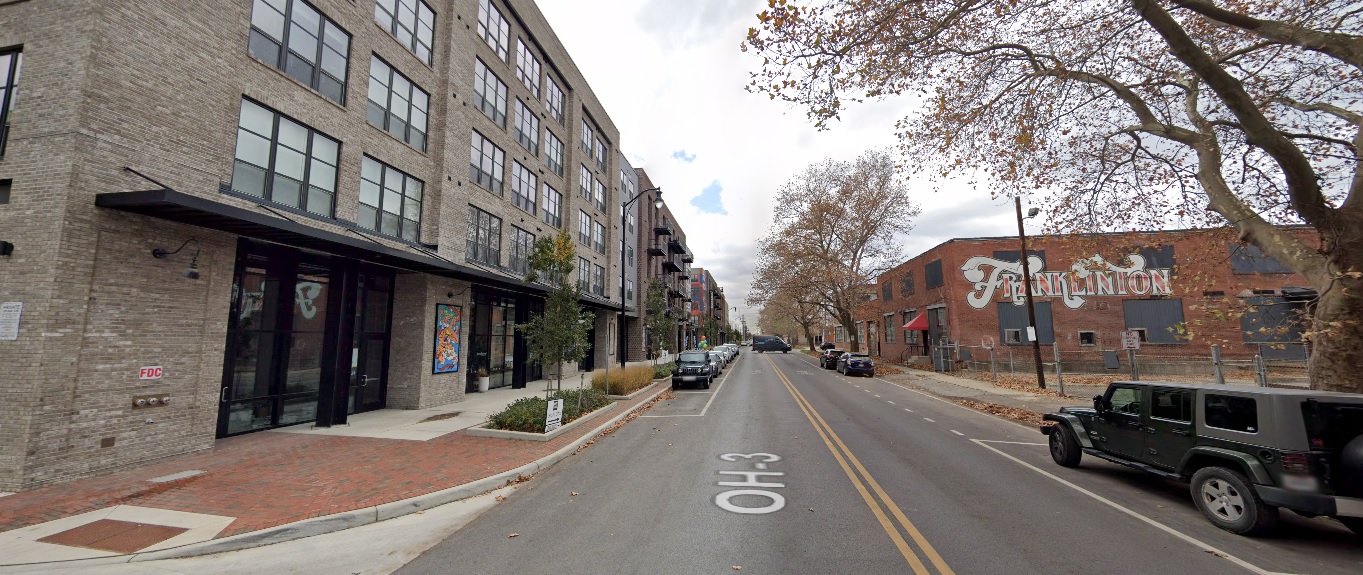
Before: West Rich Street at the Railroad Crossing, looking west in 2009 This view of West Rich Street shows how the area had been in decline, with abandoned buildings on the right and run-down public housing on the left that had seen little investment since its construction in the early 1960s. After: West Rich Street at the Railroad Crossing, looking west in 2020 Today, this section of Rich Street looks like a completely different place. Buildings have been renovated and old housing has been replaced with the much more dense River & Rich mixed-use development. The new complex contains retail space and residences that retain affordable housing. Another phase of the River & Rich development is in the works that may eventually include a new residential tower.
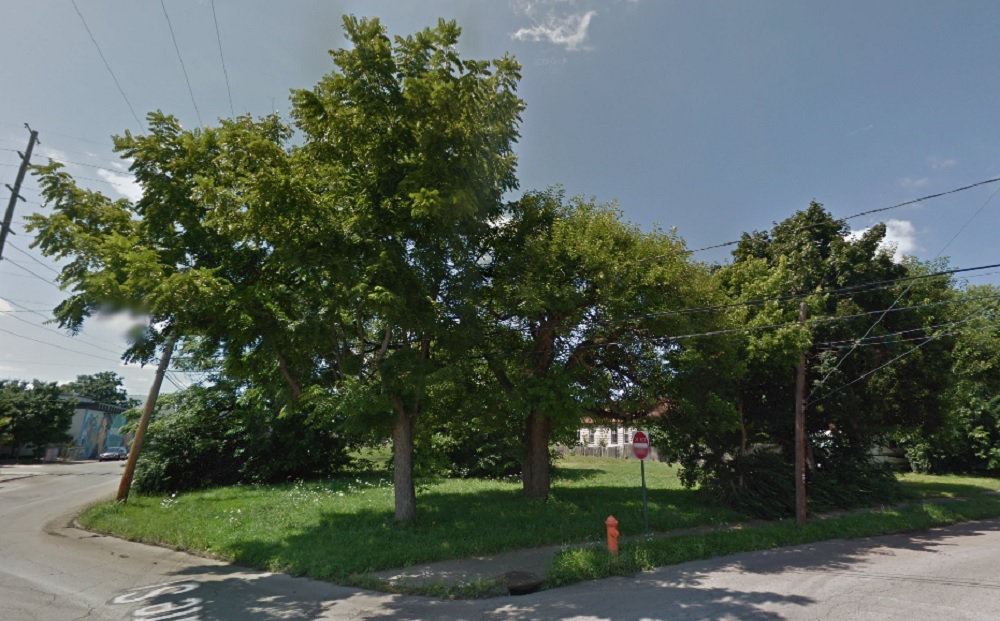
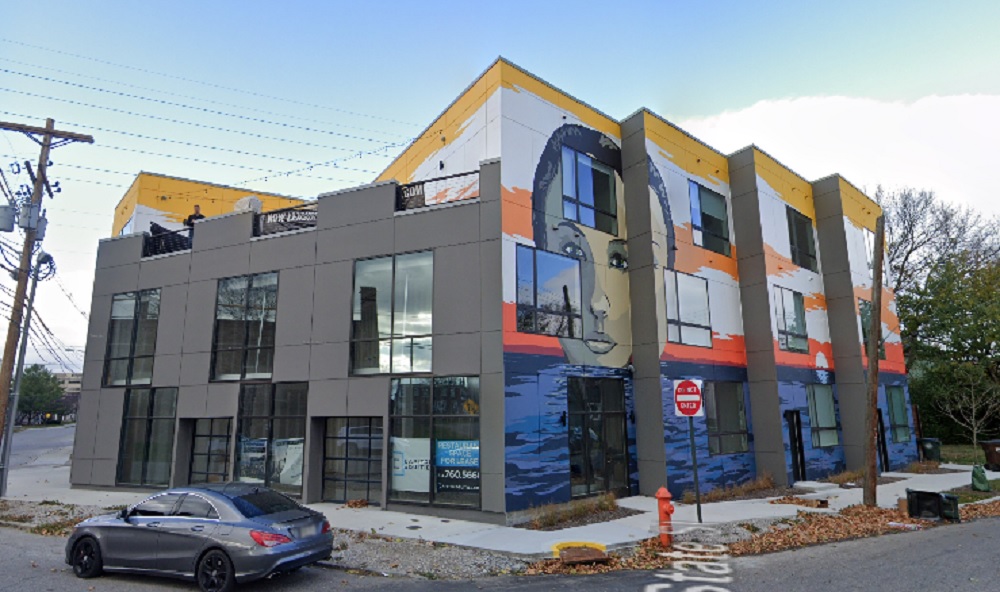
Before: 548 West State Street in 2011 The site at 548 W. State had been vacant for a number of years, with the original development having been demolished. By 2011, it was overgrown with weeds. After: 548 West State Street in 2020 In 2020, the site had a brand new mixed-use building containing 13 apartments and retail space. The mural also contributes to Franklinton becoming more of an arts location as the previous arts destination, the Short North, becomes ever more expensive.
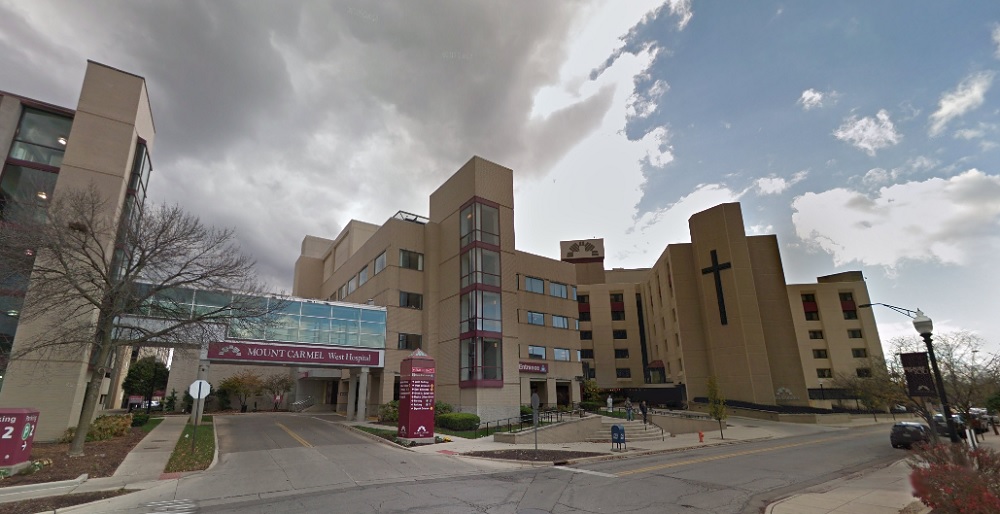
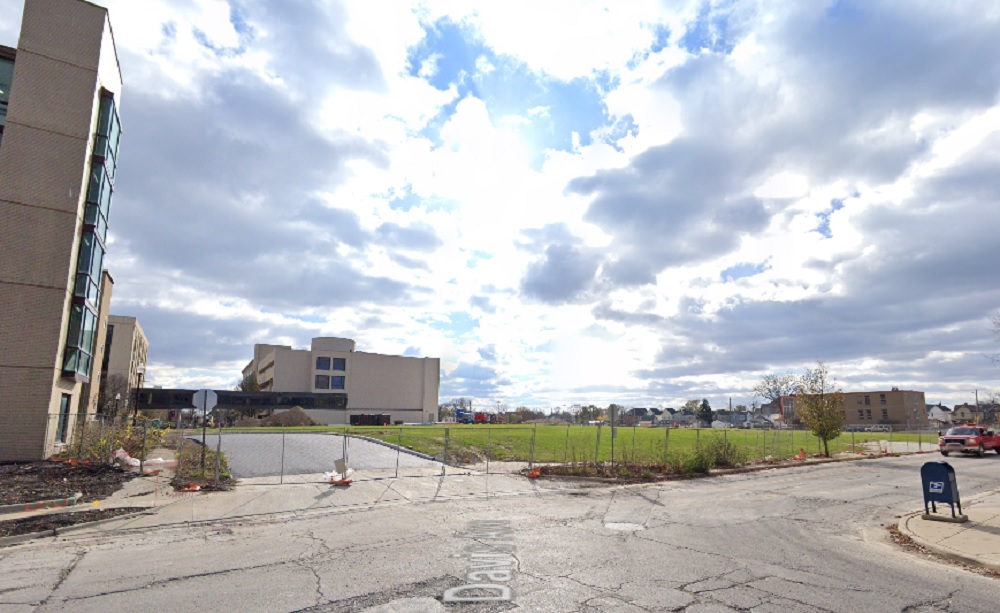
Before: Mount Carmel West in 2015 Mount Carmel West Hospital had been a dominant fixture in Franklinton for more than a century. It was originally known as Hawkes Hospital and constructed in 1886, becoming Mount Carmel in the 20th Century. However, by the 2010s, the location was deemed to be less optimal and so most of the services were moved to a new hospital in Grove City. The fate of the old hospital was sealed and a plan was drawn up to redevelop the entire site. After: Mount Carmel West in 2020 By 2020, the main hospital was no more. The only structures that will remain include the nurse’s college and several parking garages. The site will be redeveloped with mixed-use projects including residential, retail and office space over the next several years.
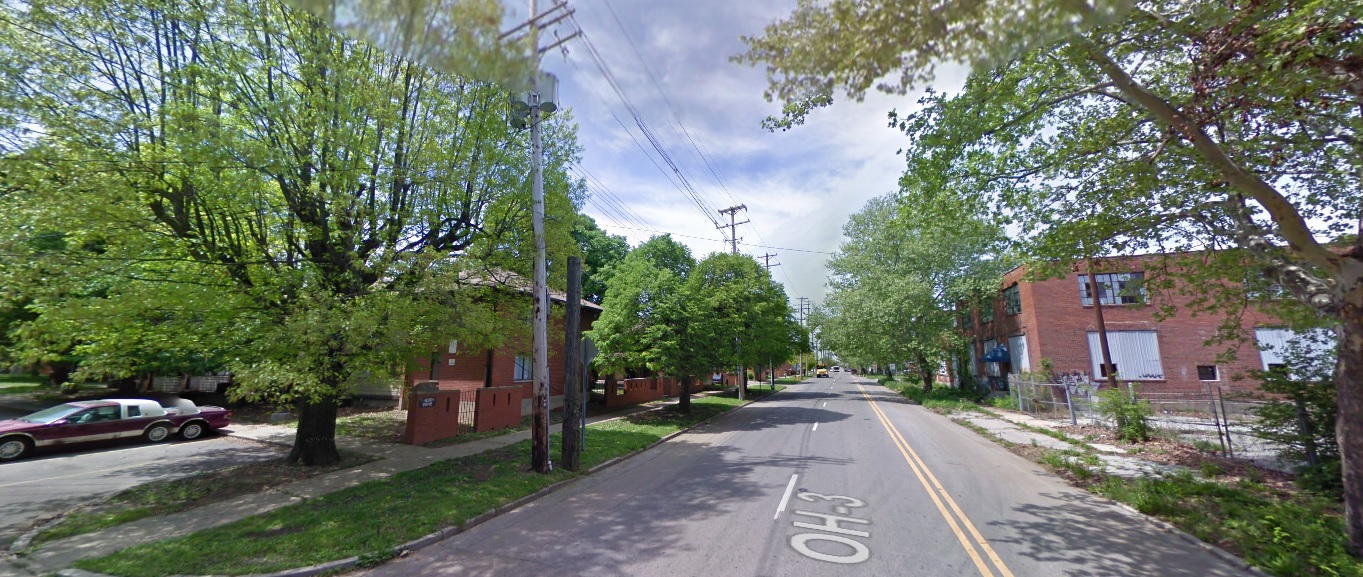
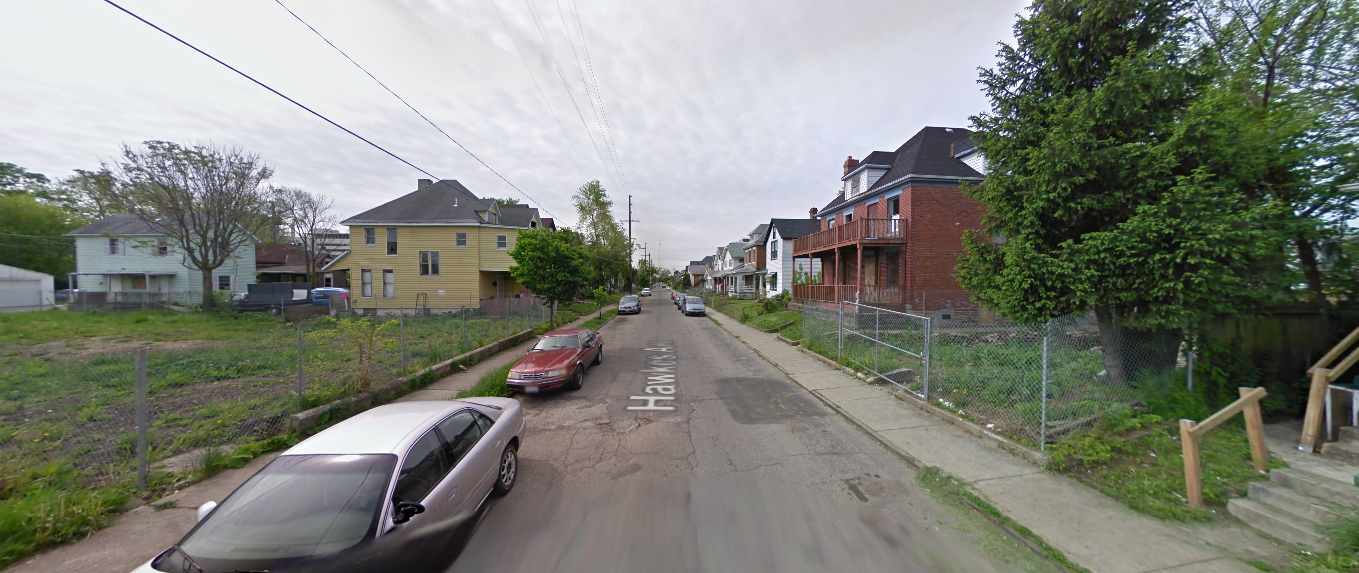
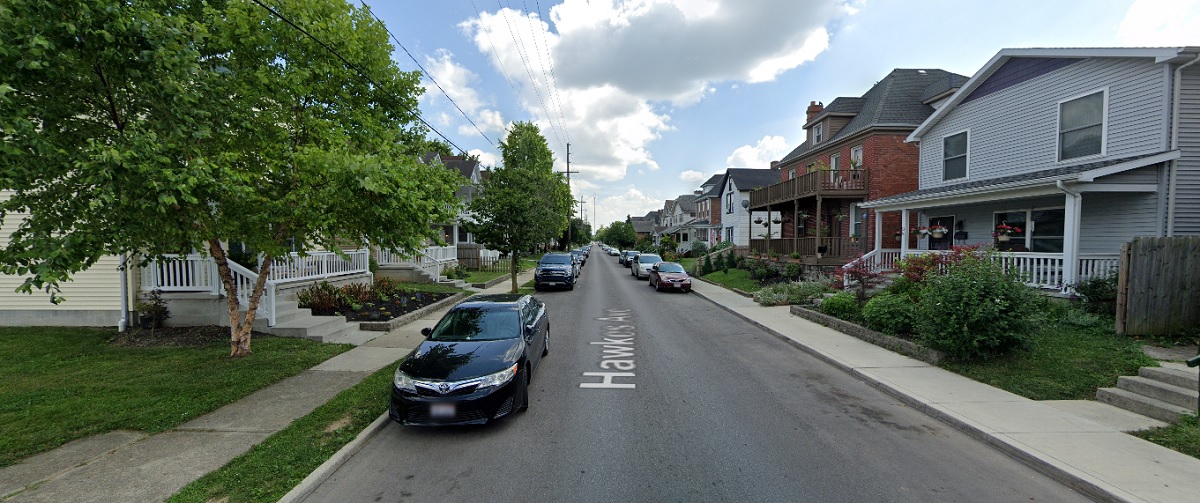
Before: Hawkes Avenue, looking south from Chapel Street in 2009 Hawkes Avenue was a typical Franklinton street by the late 2000s, with its vacant lots, abandoned buildings and poorly-maintained infrastructure. After: Hawkes Avenue, looking south from Chapel Street in 2019 Infill housing has been gradually becoming more common throughout Franklinton, as well as home renovations and general reinvestment in infrastructure by the City. Hawkes Avenue has been a beneficiary, and now looks better than it has in many years.
Franklinton has come a long way in just a few years, and the neighborhood is poised to only continue to change even more drastically in the near future. Many new projects are either under construction or have been recently proposed. Future phases of the Scioto Peninsula redevelopment will only spur additional development and growth westward. Whether Franklinton can revitalize without driving out too many of its existing residents remains somewhat of an open question.
Is North Linden the best neighborhood for a starter home in Columbus? For many local residents, when they hear “Linden”, they may only think of negatives such as crime and neighborhood condition. Like many other parts of urban Columbus, the area is changing as development forces and population growth have begun pushing in from all sides, however.
With the Columbus market on fire, supply low and prices skyrocketing due to heavy demand, Linden homes are being looked at with a new perspective. Linden homes are some of the most affordable anywhere in Columbus, and while the neighborhood can be hit or miss to say the least, North Linden has begun to emerge as a destination for first-time home buyers.
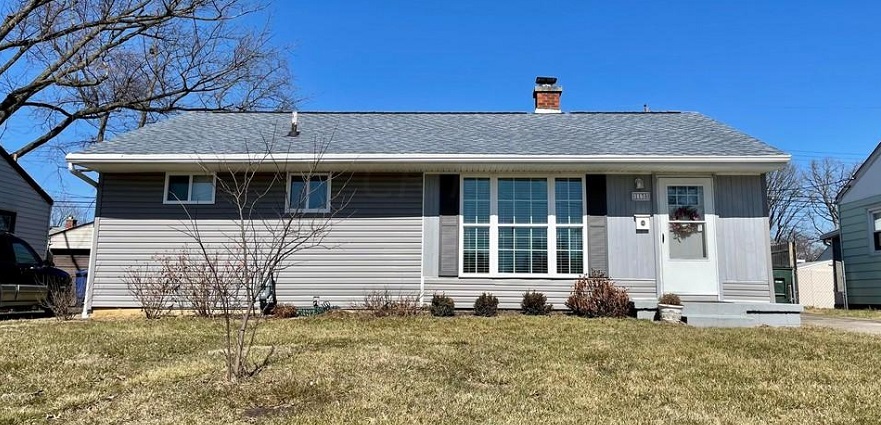
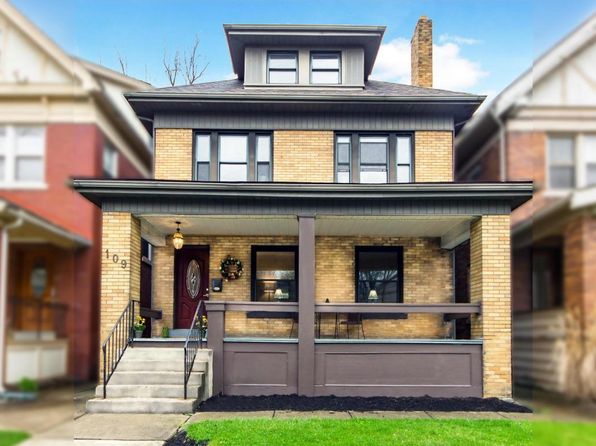
Although the southern part of Linden was constructed before WWII, the vast majority of the remaining area was built in the 1950s and 1960s as former soldiers looked to start new lives. Because of the era in which many of the homes were built, most are single-story ranches or Cape Cod style cottages. The square footage of many of these homes tends to be around 1000 square feet or less. Until recently, the small relative size, among other issues, kept buyers away. The aforementioned tight real-estate market has given these homes potential new life.
North Linden is generally the part of the neighborhood that is to the between I-71 and Cleveland Avenue west to east and between Hudson Avenue and Cooke Road south to north. Let’s take a look at some of the homes currently on the market in this area to get a feel for what is available there.
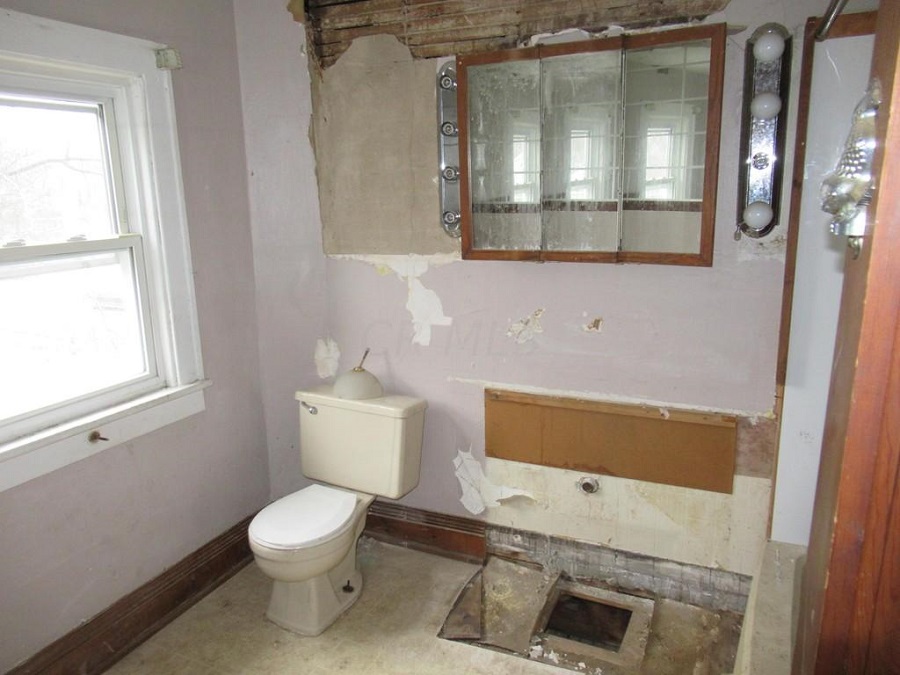
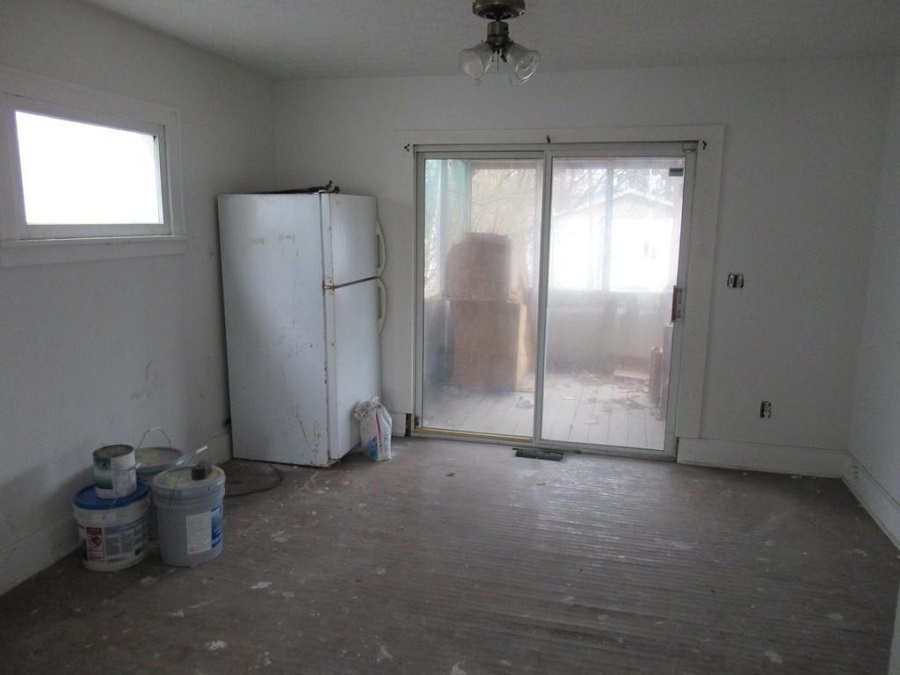
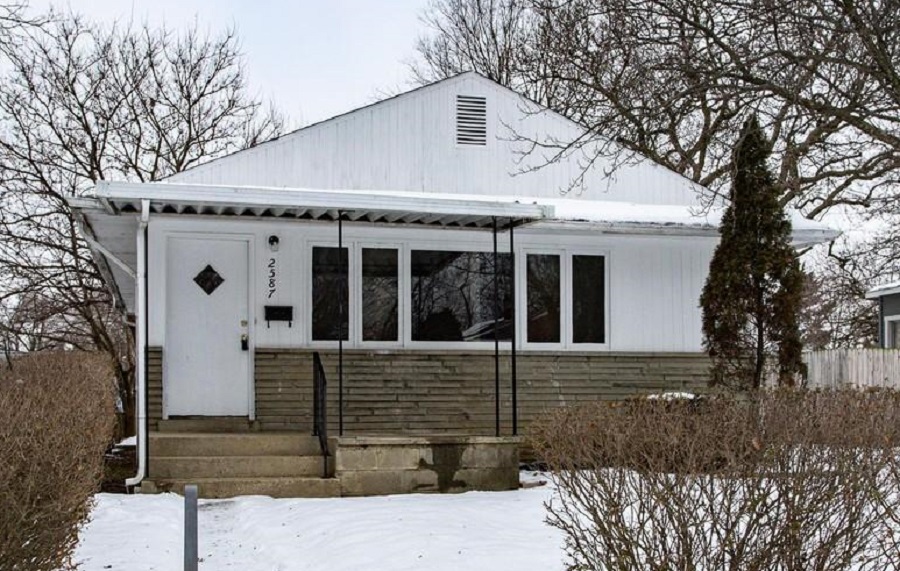
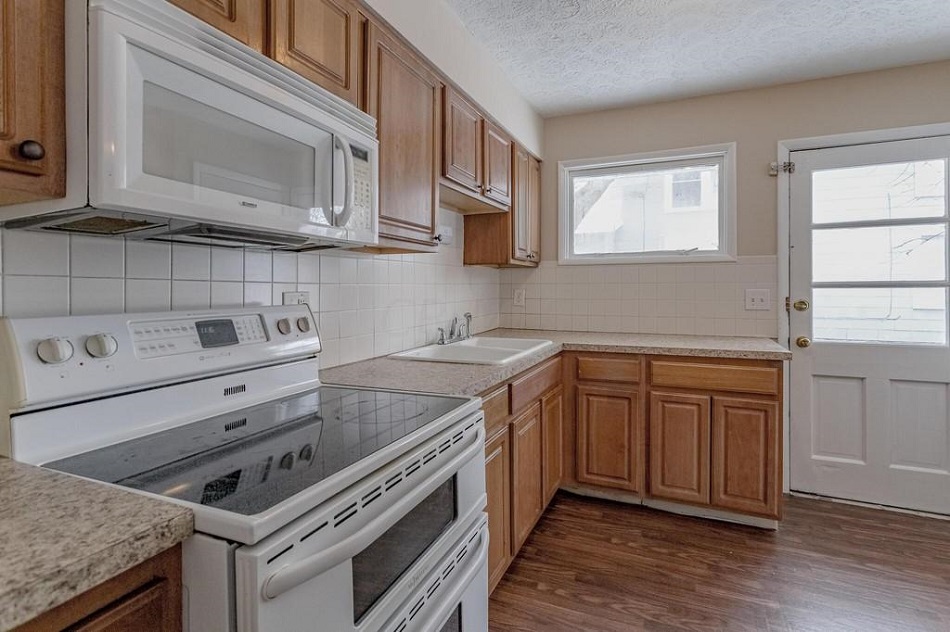
1541 Genessee Avenue: $25,000 Square Footage: 1,056 This pre-WWII home is an example of many in the area that need some level of renovations- in this home’s case- major renovations. For those willing to take on a challenge, these types of inexpensive purchases could be a consideration.
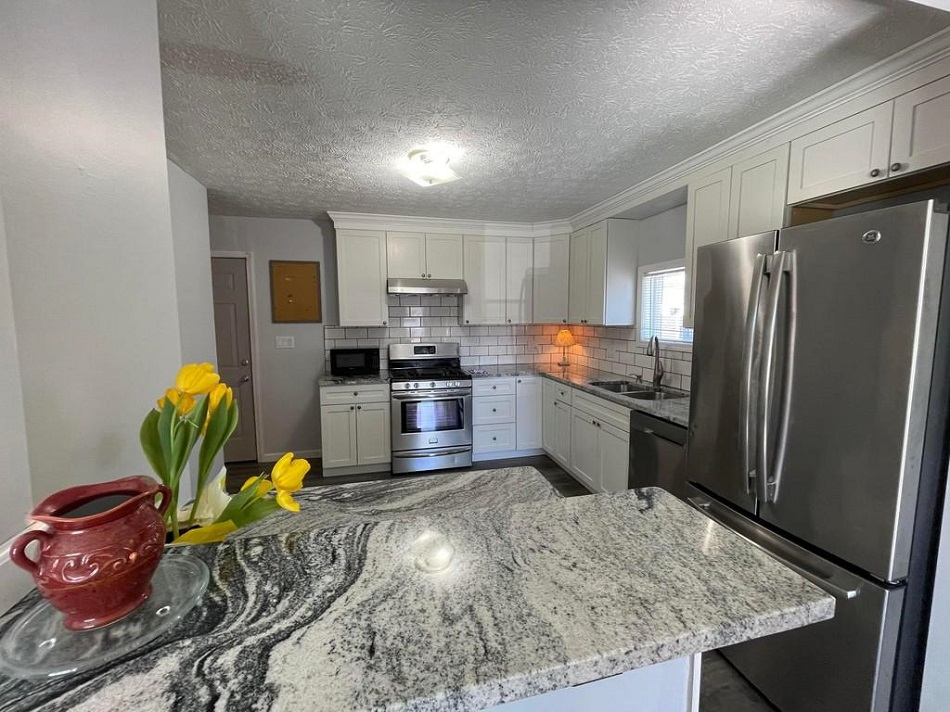
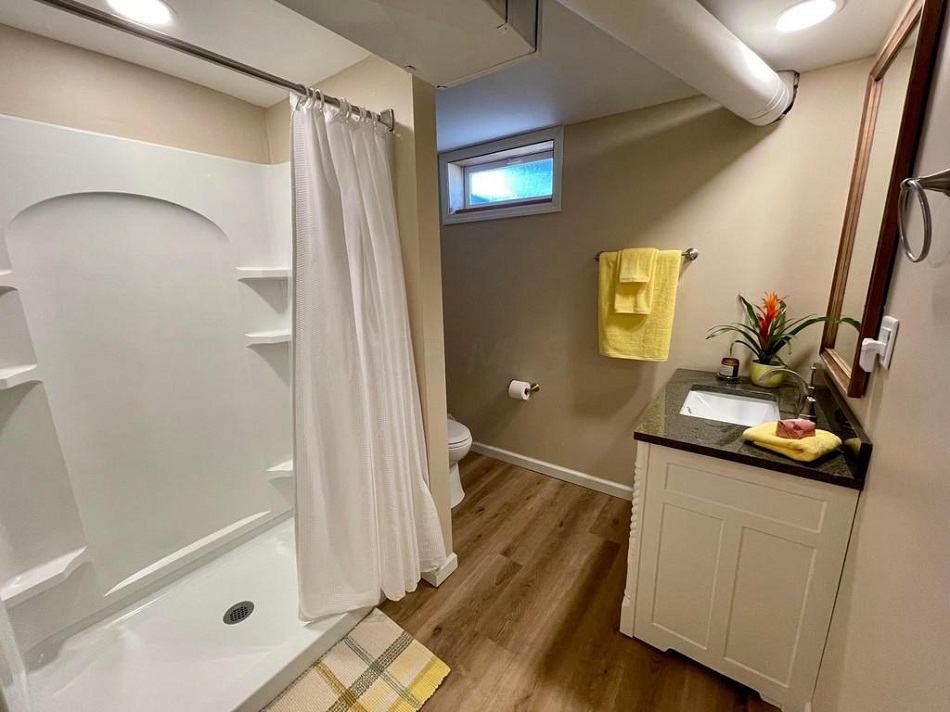
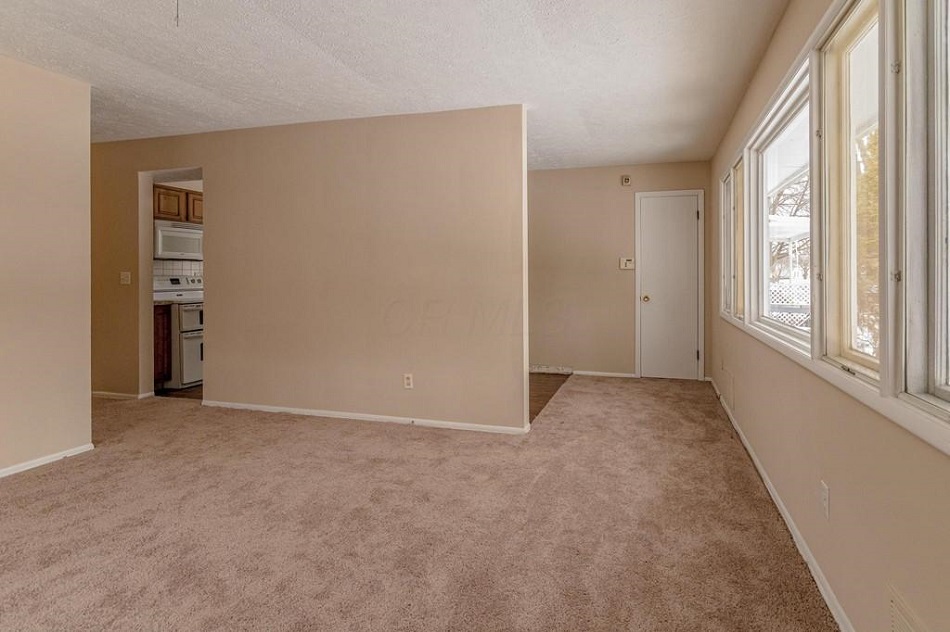
1130 Pauline Avenue: $185,000 Square Footage: 1,412 Built in 1955, this home is much more typical of the housing stock that exists within the neighborhood, but on the larger side. Unlike the home above, this one has been fully renovated and shows the potential of what they can become. This type of home represents the top of the market in terms of price in the neighborhood, showing just how affordable the area really is. https://www.realtor.com/realestateandhomes-detail/1130-Pauline-Ave_Columbus_OH_43224_M37110-45745
Beyond the less expensive prices and variety of quality fixer-uppers and renovated starter homes, North Linden is also well-situated near popular areas such as Easton, Clintonville, OSU Campus and the Morse corridor, which is rich in locally-owned restaurants and markets that specialize in foods and products from Asia, Africa and the Middle East. While there are many positives, some negatives might be higher crime in some spots- particularly closer to Cleveland Avenue- lack of walkability to amenities, and lower ranked schools within the Columbus district. As with any neighborhood, prospective residents must weigh the pros and cons according to their own lifestyles and needs. If one is a current Columbus resident looking to downsize, or a new family to Columbus looking to purchase their first home in an extremely difficult market to break into, North Linden does offer some opportunities that other neighborhoods do not.
The Columbus area housing market update January 2021 report is now available! Let’s be honest, the current housing market is extremely tough to navigate right now. This is true not so much for sellers, but rather buyers who are finding it nearly impossible to find a home they like at a good price in the neighborhood they want. There are relatively few homes available on the market, and those that are tend to get tangled in bidding wars that ultimately jack up the average sales price for the whole area.
The cause of this boils down to one critical problem- supply. There just aren’t enough existing homes to meet demand, nor are there nearly enough new homes being built. NIMBYism, local zoning and more issues are generally preventing increased home density in and around Columbus, keeping many potential homebuyers- and renters- struggling to find a place to live.
I haven’t done a breakdown of the Columbus real estate market in some time. Because of the current situation, I thought it would be a good time to take a fresh look.
The data below is from the January market report, the latest one available.
First, let’s look at those local areas that had the most homes for sale.
# of New Listings By County, January 2021 Franklin: 1,291 Delaware: 187 Licking: 157 Fairfield: 129 Union: 64 Pickaway: 47 Madison: 28 Morrow: 27 Perry: 20 Hocking: 16 Perhaps unsurprisingly, Franklin County has the most new listing by far.
Change of New Listings by County January 2020 vs. January 2021 Morrow: +8.0% Fairfield: -5.8% Licking: -6.5% Franklin: -6.6% Union: -7.2% Perry: -13.0% Madison: -20.0% Pickaway: -23.0% Delaware: -31.0% Hocking: -42.9% New listings were generally down across all but one metro county, a continuing story even before the pandemic.
Average Sales Price by County in January 2021 Delaware: $430,684 Union: $312,742 Fairfield: $265,821 Pickaway: $256,235 Franklin: $253,852 Licking: $234,116 Morrow: $232,393 Madison: $231,396 Perry: $219,053 Hocking: $208,231 All counties saw the average sale price of homes sold exceed the $200K mark, but Delaware County remains the most expensive place to buy a home in the metro.
Change in Average Sales Price by County January 2020 vs. January 2021 Perry: +53.7% Pickaway: +36.4% Fairfield: +25.9 Delaware: +23.5% Franklin: +13.4% Union: +12.0% Madison: +9.6% Licking: +9.0% Morrow: +8.9% Hocking: -7.6% All but Hocking County saw significant year-over-year sales price increases of homes sold.
Now let’s take a look at individual communities. Which ones were the hottest in January 2021?
Local Communities/Areas by New Listings in January 2021 1. Columbus (Overall): 850 2. Columbus City School District (CSD): 579 3. South-Western CSD: 173 4. Olentangy Local School District (LSD) (Delaware): 95 5. Hilliard CSD: 92 6. Westerville CSD: 86 7. Grove City: 77 8. Dublin CSD: 68 9. Pickerington LSD: 59 10. Groveport Madison LSD (Franklin): 56 11. Worthington CSD: 51 12. Gahanna Jefferson CSD: 50 13. Newark CSD: 42 14. Lancaster CSD: 41 15. Delaware CSD: 40 16. Upper Arlington CSD: 40 17. Pataskala: 37 18. Beechwold/Clintonville: 35 19. Gahanna: 35 20. Westerville: 35 21. Hilliard: 35 22. Blacklick: 34 23. Marysville School District: 33 24. Reynoldsburg CSD: 32 25. Dublin: 31 26. Teays Valley LSD (Pickaway): 30 27. Downtown Columbus: 29 28. Pickerington: 27 29. New Albany Plain LSD: 24 30. Short North: 24 31. Big Walnut LSD (Franklin): 22 32. Powell: 22 33. Canal Winchester CSD: 19 34. London CSD: 15 35. German Village: 15 36. New Albany: 14 37. Hamilton LSD (Franklin): 14 38. Buckeye Valley LSD (Delaware: 13 39. Bexley: 11 40. Worthington: 11 41. Granville CSD: 11 42. Obetz: 8 43. Johnstown-Monroe LSD (Licking): 8 44. Circleville CSD: 7 45. Grandview Heights: 7 46. Sunbury: 7 47. Whitehall: 6 48. Jonathan Alder LSD (Madison): 6 49. Jefferson LSD (Madison: 5 50. Minverva Park: 2 51. Valleyview: 1 52. Lithopolis: 0 It’s pretty clear that the number of new listings falls off dramatically outside of Columbus proper. Only a handful of suburban areas had more than 50.
Average Sales Price January 2021, # of Homes Sold and % Change vs. January 2020 1. New Albany: $788,943: 14: +8.4% 2. New Albany Plain LSD: $669,455: 20: +10.2% 3. German Village $637,550: 10: +2.3% 4. Olentangy LSD $494,911: 96: +23.0% 5. Powell: $493,087: 11: +19.2% 6. Granville CSD: $492,045: 6: +31.3% 7. Dublin: $468,902: 37: +17.5% 8. Upper Arlington CSD: $462,594: 26: -9.2% 9. Bexley: $438,288: 13: -17.6% 10. Grandview Heights: $437,010: 6: +8.5% 11. Buckeye Valley LSD: $403,616: 20: +40.9% 12. Downtown: $384,230: 22: -36.4% 13. Dublin CSD: $378,788: 78: +11.8% 14. Johnstown-Monroe LSD: $375,598: 12: +110.8% 15. Short North: $360,830: 10: -8.7% 16. Jonathan Alder LSD: $340,887: 15: +20.7% 17. Big Walnut LSD: $337,550: 14: -8.8% 18. Gahanna Jefferson CSD: $335,621: 34: +19.7% 19. Blacklick: $325,445: 32: +39.7% 20. Sunbury: $318,980: 5: +39.1% 21. Pickerington LSD: $318,093: 40: +28.6% 22. Worthington: $316,625: 8: +7.0% 23. Teays Valley LSD: $315,316: 21: +52.5% 24. Beechwold/Clintonville: $300,780: 43: +15.4% 25. Hilliard: $297,387: 25: +0.9% 26. Worthington CSD: $294,236: 40: +17.5% 27. Pickerington: $282,044: 18: +13.0% 28. Westerville: $279,126: $279,126: -0.9% 29. Hilliard CSD: $277,377: 92: +5.9% 30. Canal Winchester CSD: $276,299: 17: +21.7% 31. Grove City: $272,378: 47: +17.8% 32. Minerva Park: $269,580: 5: +21.2% 33. Westerville CSD: $265,781: 68: -3.3% 34. Obetz: $260,825: 6: +26.4% 35. Gahanna: $255,650: 16: -2.1% 36. Marysville CSD: $254,363: 32: +17.8% 37. Hamilton LSD: $245,750: 4: +85.8% 38. Delaware CSD: $245,526: 31: +21.8% 39. Pataskala: $237,293: 18: +26.8% 40. Lithopolis: $228,125: 4: -1.4% 41. South-Western CSD: $227,266: 131: +17.9% 42. Columbus: $222,124: 761: +17.0% 43. Columbus CSD: $215,256: 507: +20.2% 44. Jefferson LSD: $210,225: 4: -35.5% 45. Reynoldsburg CSD: $203,965: 34: +9.0% 46. Lancaster CSD: $203,095: 44: +37.5% 47. Groveport Madison LSD: $194,690: 43: +30.3% 48. London CSD: $190,733: 14: +43.8% 49. Circleville CSD: $183,546: 13: +5.3% 50. Whitehall: $165,361: 11: +68.6% 51. Newark CSD: $143,241: 51: +15.9% 52. Valleyview: $120,000: 1: N/A As stated above, most areas in the metro are priced above $200,000 for a house. Columbus overall is still one of the least expensive options. New Albany is really in a league all its own. It should be noted that many of these average price figures are based on relatively few sales. Because available inventory is so low, the average sales price is being pushed higher. However, it is certainly possible to find homes lower- and in some cases, much lower- than the average price. This is especially true in Columbus.
Finally, let’s look at how long for-sale homes actually stay on the market.
Average # of Days Listings Remain on the Market Until Sale, and % Change January 2020 to January 2021 1. Valleyview: 1: N/A No sales occurred in January 2020. 2. Gahanna: 9: -74.3% 3. Groveport Madison LSD: 9: -69.0% 4. Hamilton LSD: 9: -50.0% 5. Worthington: 9: -72.7% 6. Reynoldsburg CSD: 10: -68.8% 7. Obetz: 12: -71.4% 8. Hilliard: 13: -61.8% 9. Worthington CSD: 13: -56.7% 10. Circleville CSD: 14: -76.3% 11. Lithopolis: 14: -61.1% 12. Marysville CSD: 14: -63.2% 13. Minerva Park: 14: +133.3% 14. Pataskala: 14: -46.2% 15. New Albany: 15: -88.9% 16. New Albany Plain LSD: 15: -83.9% 17. Pickerington: 15: -71.7% 18. South-Western CSD: 15: -34.8% 19. Teays Valley LSD: 15: -58.3% 20. Canal Winchester CSD: 17: -73.0% 21. Whitehall: 17: -46.9% 22. Hilliard CSD: 18: -48.6% 23. Lancaster CSD: 18: -52.6% 24. Westerville CSD: 18: -47.1% 25. Delaware CSD: 19: -51.3% 26. Grove City: 19: -36.7% 27. Beechwold/Clintonville: 20: -53.5% 28. Columbus: 21: -30.0% 29. Westerville: 21: -27.6% 30. Newark CSD: 22: -31.3% 31. Pickerington LSD: 22: -45.0% 32. Dublin: 26: -55.9% 33. Buckeye Valley LSD: 27: -44.9% 34. Columbus CSD: 27: -18.2% 35. Dublin CSD: 27: -41.3% 36. Jefferson LSD: 27: -46.0% 37. London CSD: 27: -32.5% 38. Blacklick: 28: -12.5% 39. Grandview Heights: 28: -37.8% 40. Gahanna Jefferson CSD: 29: -23.7% 41. Johnstown Monroe LSD: 29: -12.1% 42. Sunbury: 29: +222.2% 43. Jonathan Alder LSD: 35: -10.3% 44. Short North: 35: -47.8% 45. Big Walnut LSD: 37: -54.3% 46. Bexley: 44: -18.5% 47. Upper Arlington CSD: 46: -17.9% 48. Olentangy LSD: 49: -16.9% 49. Powell: 52: -8.8% 50. Granville CSD: 54: -15.6% 51. German Village: 56: -38.5% 52. Downtown: 96: +242.9% Only 2 places in the metro saw an increase, with the big one being Downtown. This was most likely due to a few factors- last year’s protests and the pandemic reducing demand close to Downtown jobs. I would expect it to recover somewhat this year and certainly next year. Overall, though, most places saw significant drops in how long homes lasted on the market. Given that these are averages, we know that there were plenty of instances of homes flying off the market in just a few days.
Furthermore, the actual inventory on the market is 30 days or less. This means that if no more homes became available for sale, all the homes on the market would sell out in less than a month. In many cases, the supply would run out in just a few weeks.
Certainly, all these numbers indicate that Columbus itself is still one of the best options for home buying given its lower costs and greater supply, but even there, homes are selling in just a few weeks on average. There’s really been no better time to sell in a long time, but also no worse time to buy. Hopefully, this data provides at least a little insight into the local market and where one might fight the greatest advantages in finding a home. My recommendation is to use every available resource- from realtors to social media- to aid in the search.
These Columbus Christmases past photos give a short walk down memory lane of one of the most popular and favorite holidays.
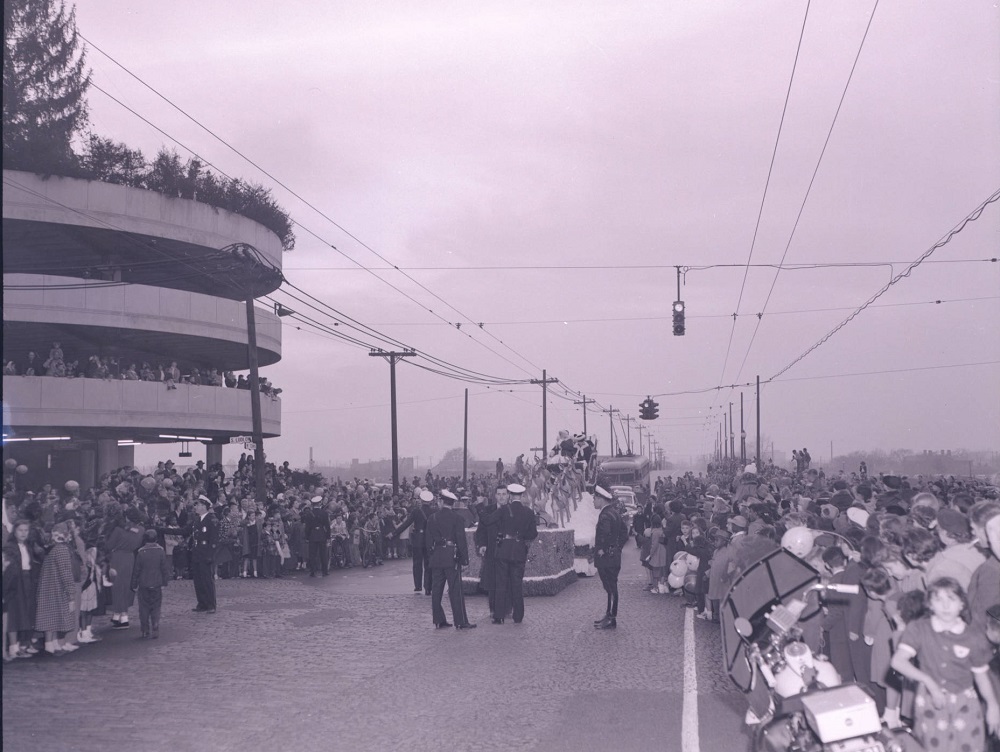
Date: 1952 Location: Corner of W. Town Street and S. Ludlow Street along the Scioto River. Santa and Mrs. Claus ride on a float in the annual Lazarus Christmas parade.
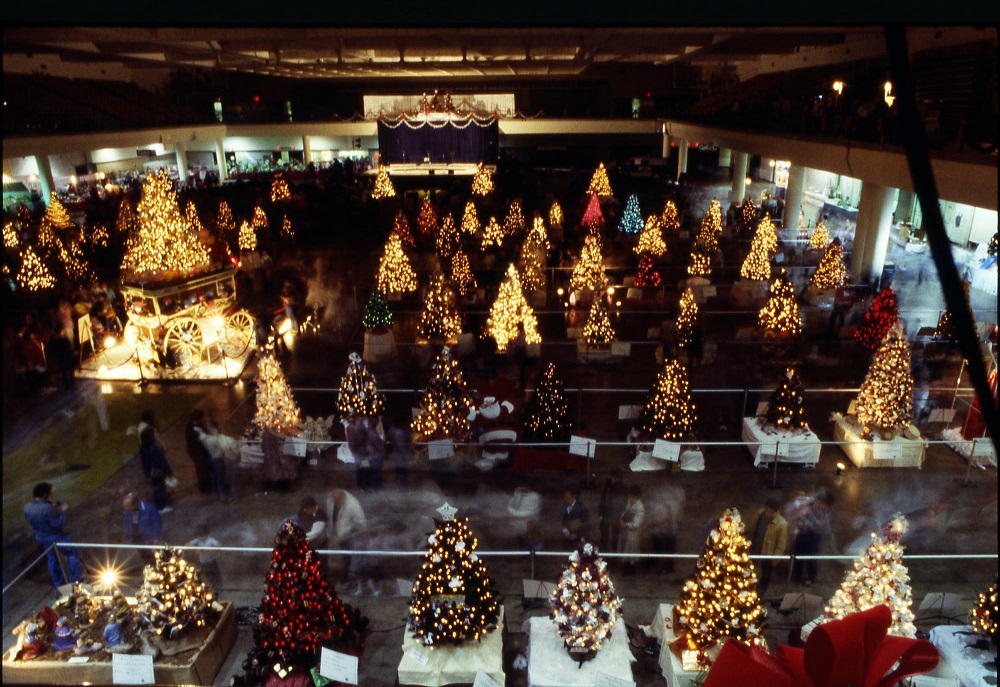
Date: 1980 Location: Ohio Expo Center Multipurpose Building at 717 E. 17th Avenue. The Festival of Trees was an annual event sponsored by Children’s Hospital and Nationwide for charities. In 1980, there were 82 themed Christmas trees on display, which people could buy for at prices up to $1,000 each.
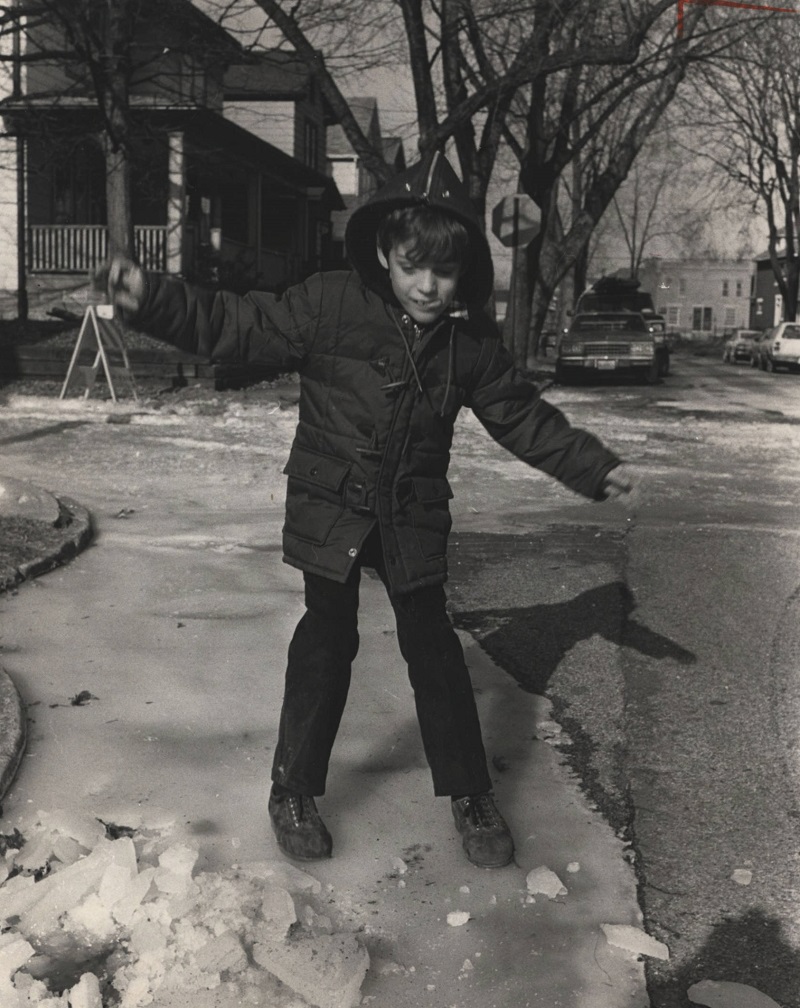
Date: Christmas Day, 1983 Location: Corner of Ebner and Columbus Street, German Village Christmas 1983 was one of the coldest on record, with a high of just 1 degree above zero and an average temperature of -6. The cold caused water mains to burst in several locations, including in German Village, which some children took advantage of for a little fun.
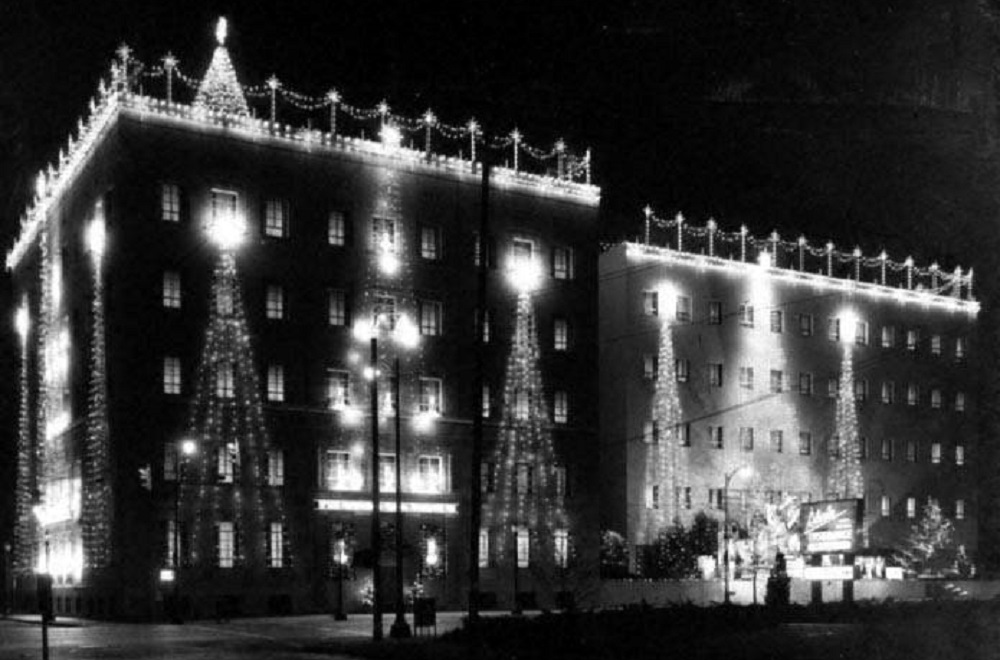
Date: 1965 Location: 518 E. Broad Street State Auto Mutual Insurance began holding a Christmas lighting event every year beginning in 1931.
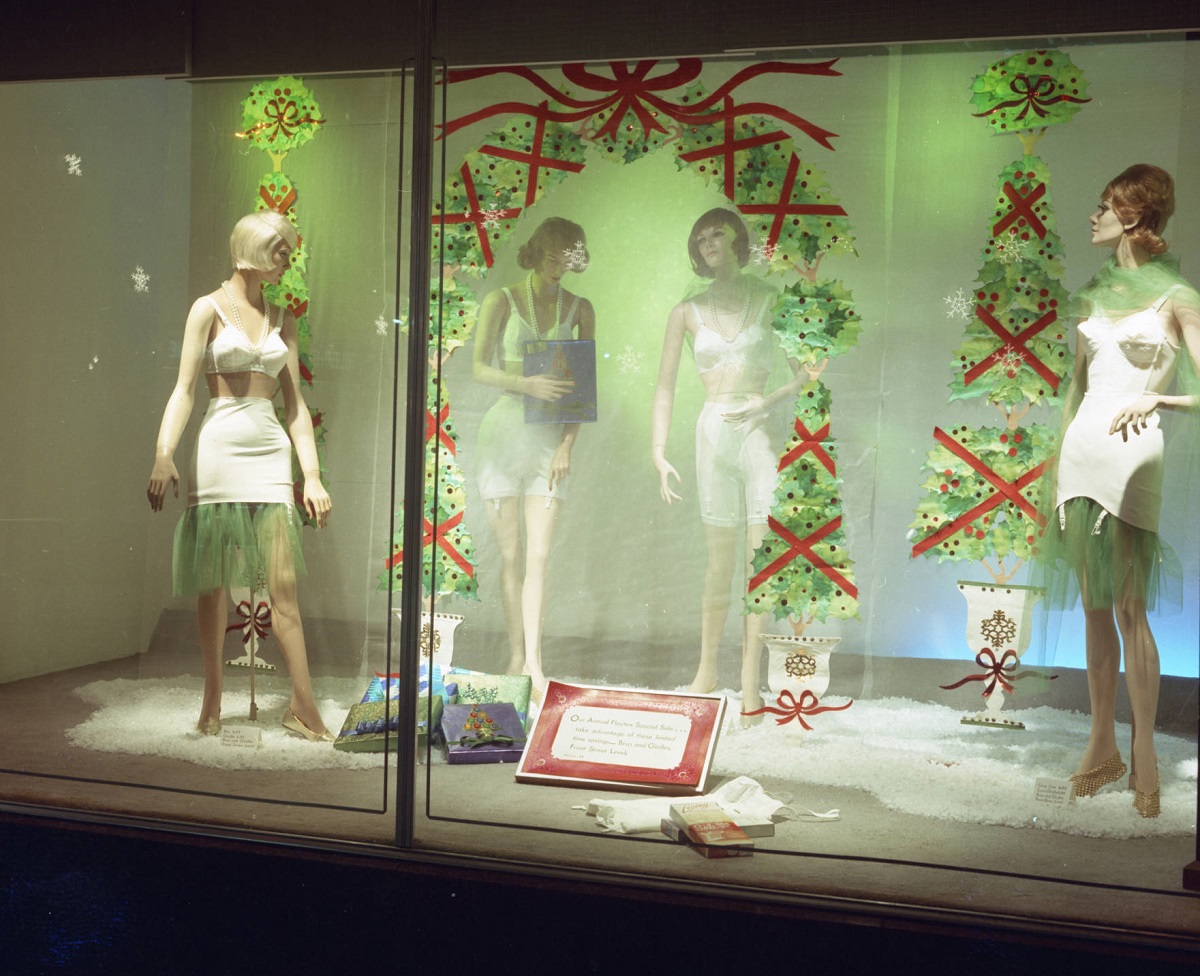
Date: Around 1955 Location: Lazarus Department Store, South High Street Lazarus was famous for its window Christmas displays for well over 100 years, with many being very elaborate. The Christmas displays continued until the 2000s.
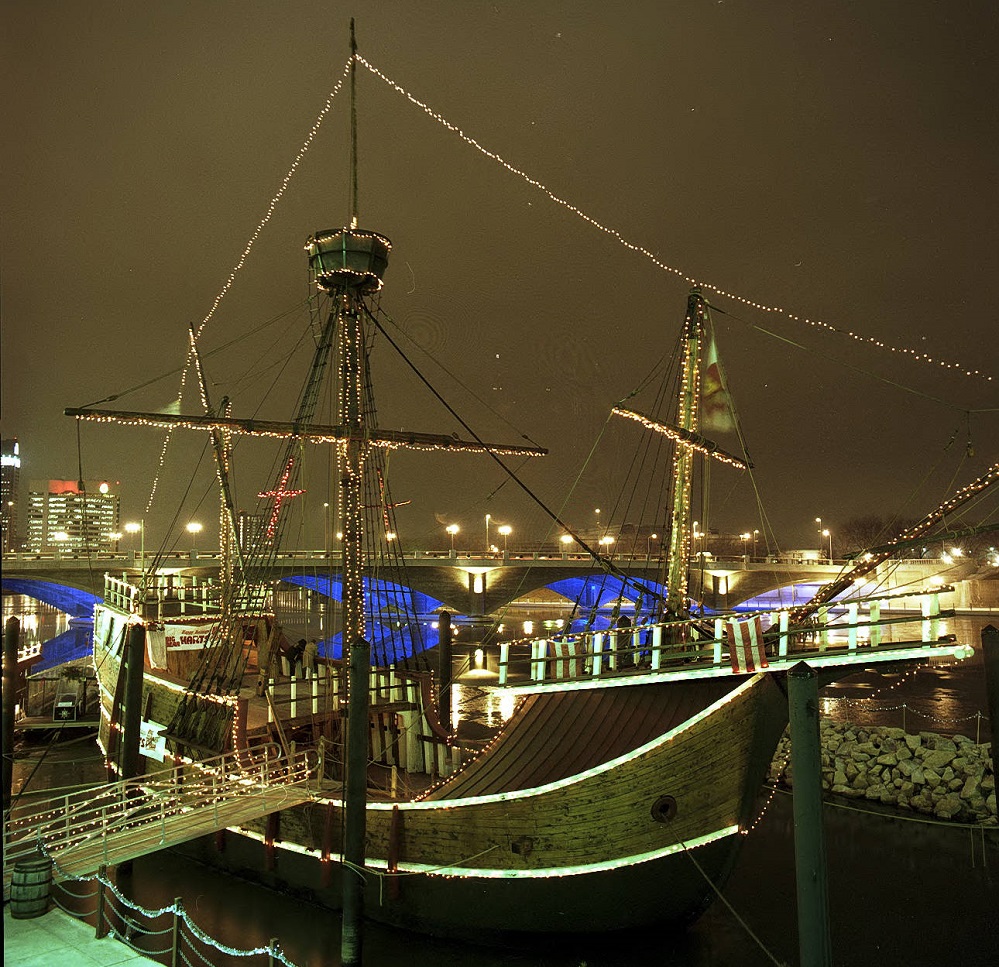
Date: 1992 Location: Scioto Riverfront, Downtown The replica of Christopher Columbus’ Santa Maria, decorated for Christmas in the photo, sat in Battelle Riverfront Park from 1991 until it was permanently dismantled during construction of Scioto Greenways in 2014.