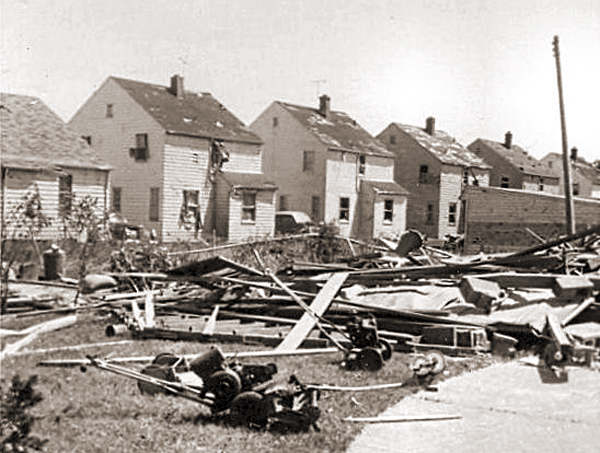
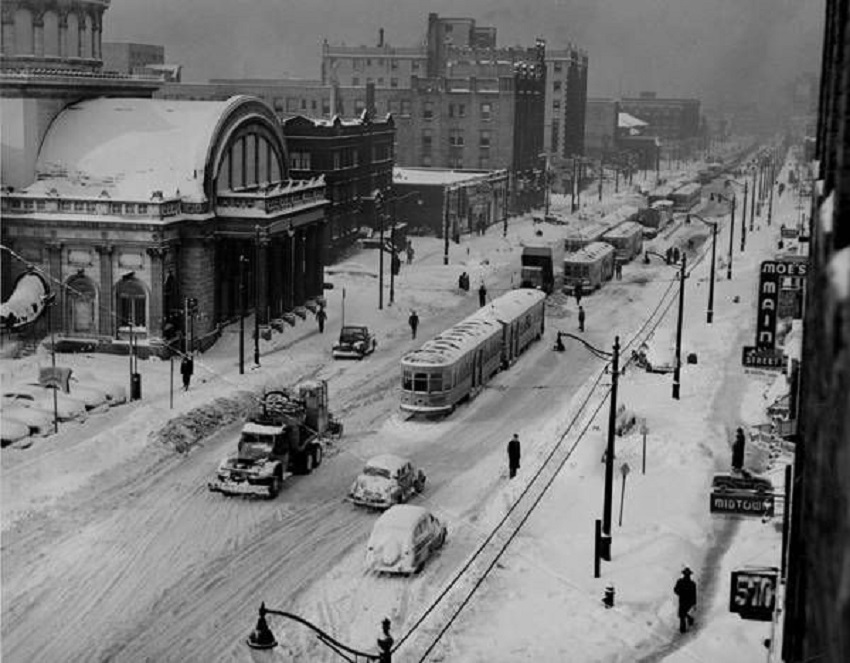
Springfield, Ohio after the storm.
Exactly 67 years ago today, the Great Thanksgiving Blizzard of 1950 began. It was the biggest snowstorm for Columbus, and indeed most of Ohio, during the 40-year period of 1920-1960. That period, especially from the mid-1920s through the mid-1950s, had the lowest rates of cold and snowy winters of any comparable period. The average seasonal snowfall during that period was just 19.1″, a full 9″ below the average the 1980s-2010s have had to date. Still, the period was not without its memorable winters, including 1935-36, 1939-40 and 1947-48. None of those winters, however, had a snow event nearly as big as November 1950.
October 1950 had generally been very warm, ranking historically as the 19th warmest October in Columbus. Highs reached 65 or higher on 21 days of the month. This warmth lasted through early November, and the 80 degrees recorded on November 1st, 1950 remains tied for the warmest November temperature ever recorded. After that, the month seesawed up and down until a strong cold front and rainstorm on the 19th-20th dropped temperatures 25-30 degrees across the state, from the upper 50s-low 60s on the 20th to the low-mid 30s on the 21st. This front would be one of the catalysts for one of Ohio’s greatest winter weather events in its history.
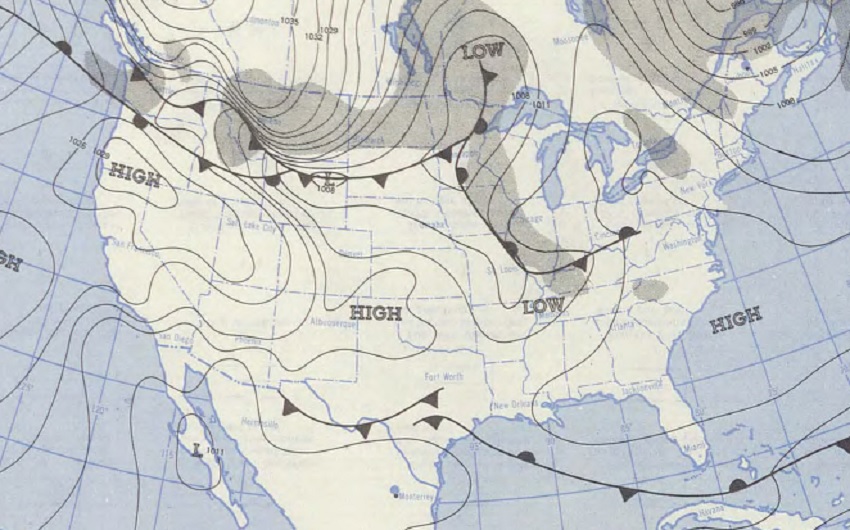
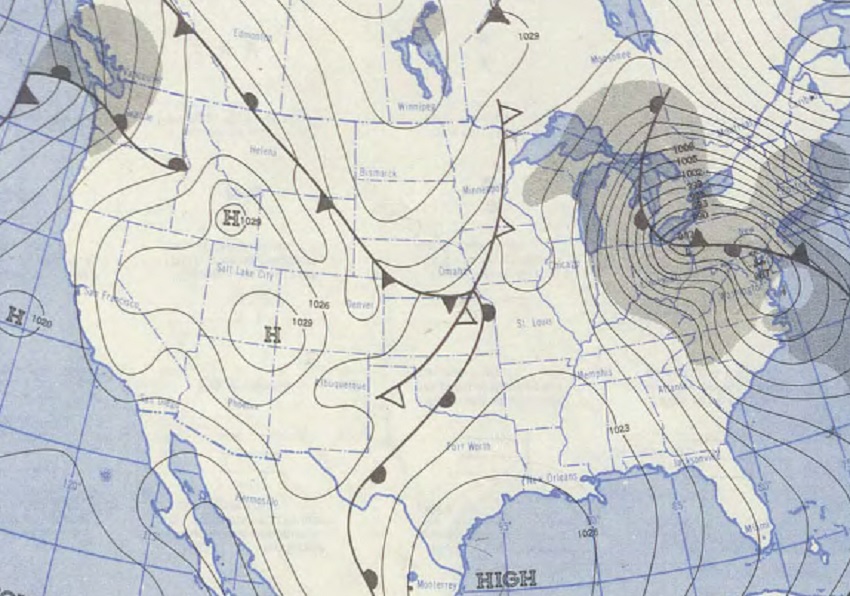
Snow began in Columbus and other parts of Ohio on Thanksgiving, Thursday, November 23rd as a low moved through the Great Lakes and weakened. Behind that system, another cold high pressure was diving south out of Canada.
Thursday, November 23rd 1950 National Map
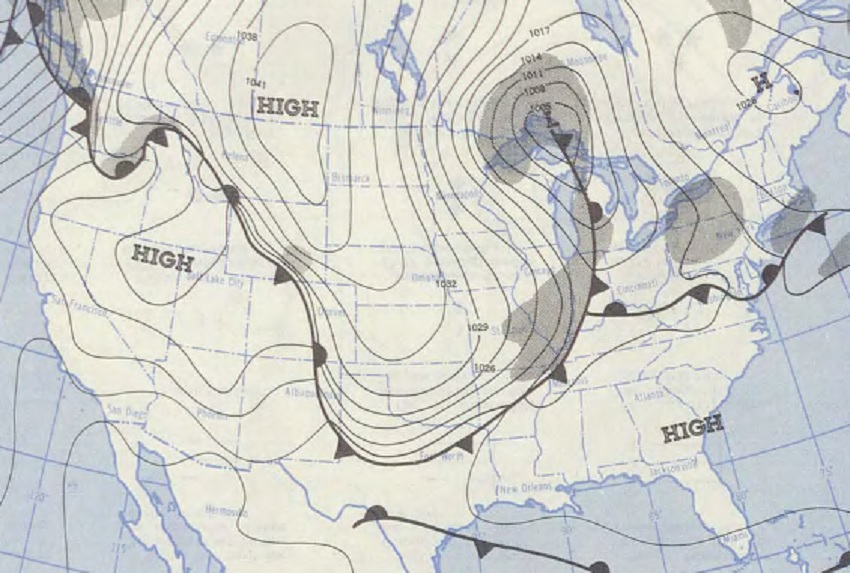
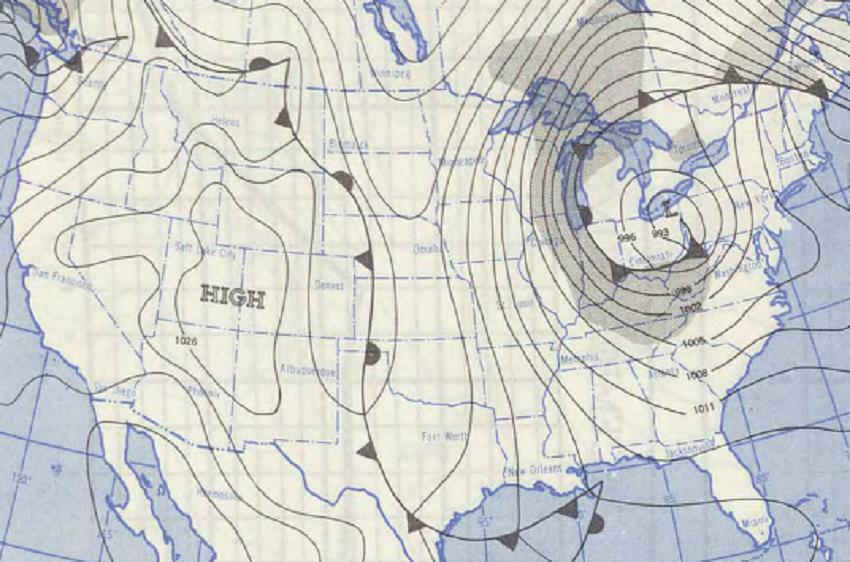
On Friday the 24th, a low formed on the stalled cold front that had moved through Ohio a few days earlier. Initially forming in southeastern North Carolina, this low would’ve normally gone out to see or moved up the East Coast as a Nor’easter. Instead, the strong, cold high pressure was moving into the Ohio Valley at the same time, and the little low exploded and as it began to move north. The strong push of cold was very evident in Ohio, as temperatures plunged from the upper-30s to upper 40s on Thanksgiving afternoon to single digits and low teens by early Friday morning.
Friday, November 24th, 1950 National Map
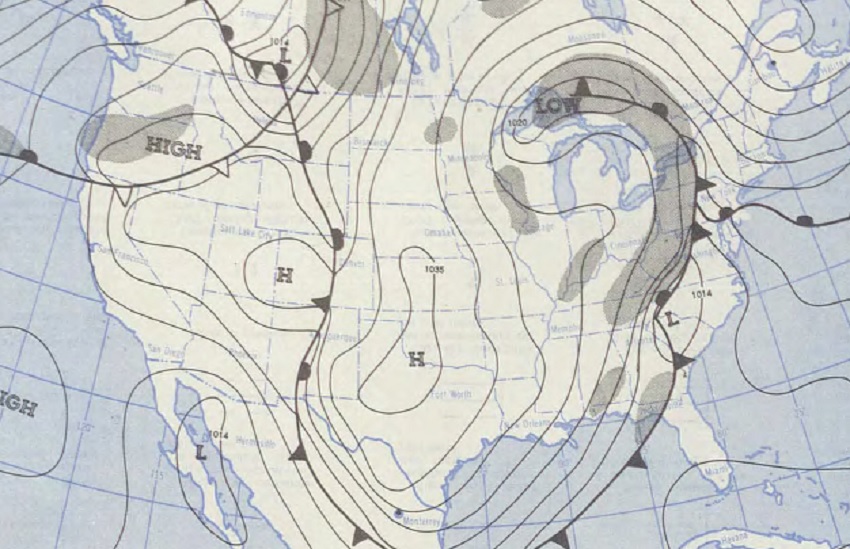
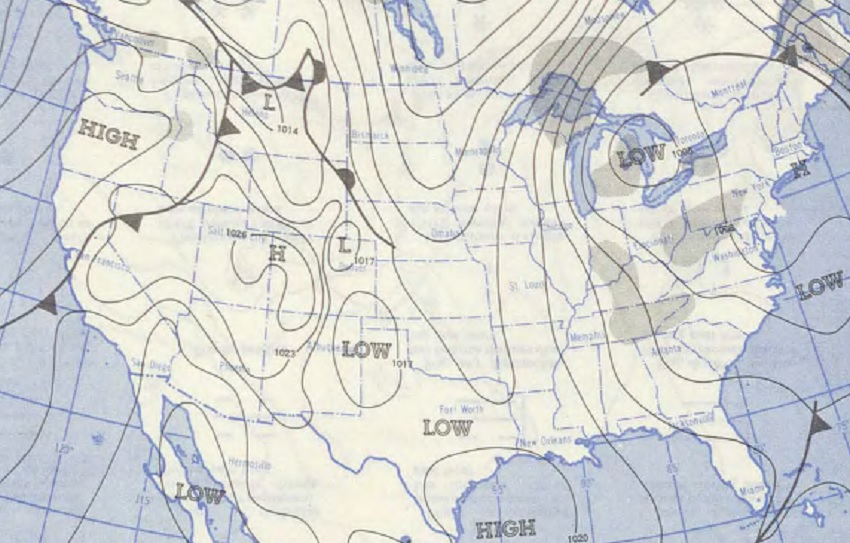
The low moved into southern Pennsylvania by the morning of the 25th, and then began to do something few other storms ever do- it began to retrograde toward the west and Ohio, continuing to strengthen as it went. The unusual west movement was caused by a blocking high pressure system parked over Maine.
Saturday, November 25th, 1950 National Map
Light snow that had been ongoing in Ohio on the 24th quickly intensified from east to west across the state as the low moved westward from Central Pennsylvania to Northern Ohio by the end of the day on the 25th. With it arrived winds of 40-60 miles per hour, causing blinding white-outs and drifting.
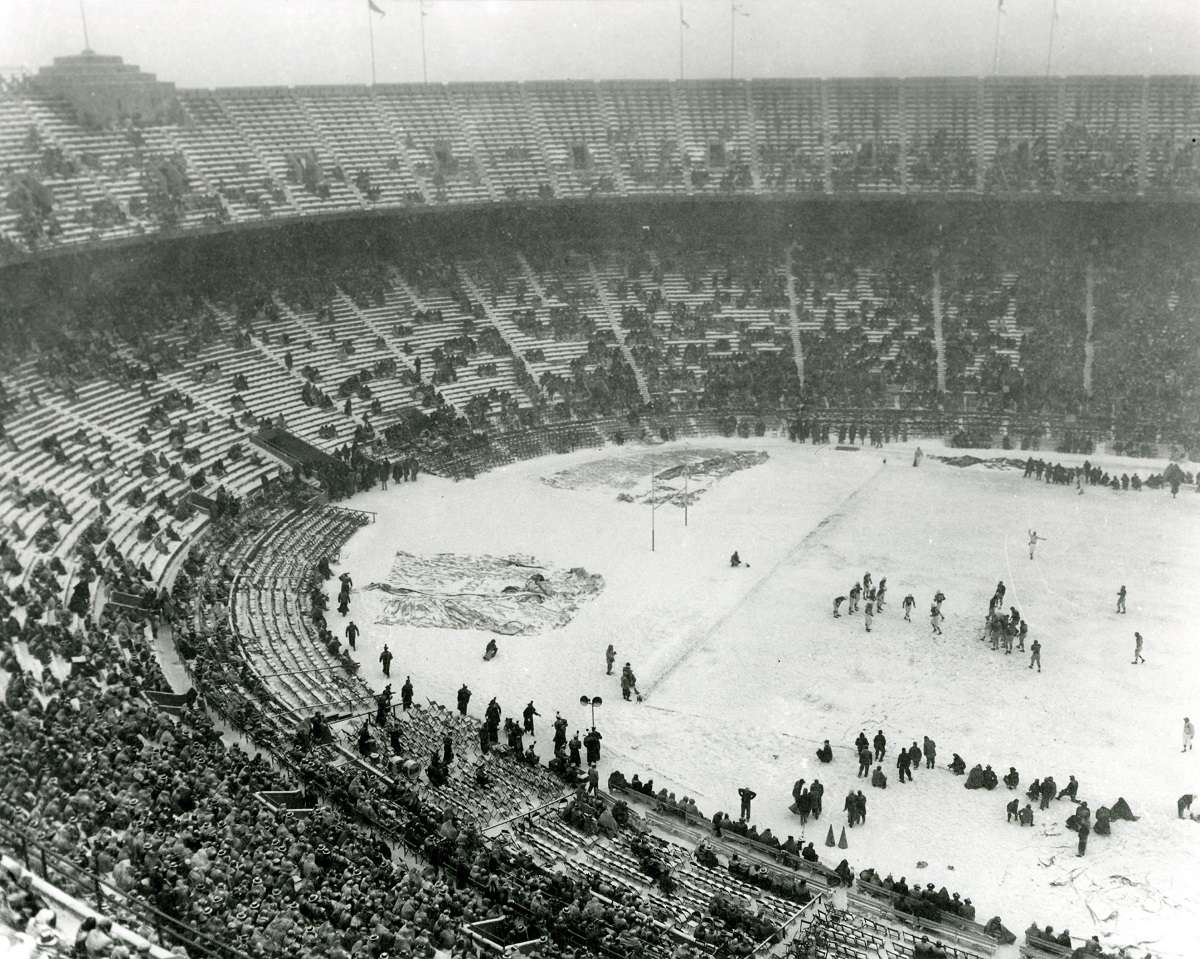
Saturday the 25th was the height of the storm as the low pressure bottomed out at 978mb, a pressure normally associated with hurricanes. This day was, coincidentally, the famed Ohio State-Michigan rivalry football game, now famously known as the “Snow Bowl” for its terrible weather conditions.
With temperatures on Saturday morning in the single digits, wind chills well below zero and with heavy snow, there was debate about cancelling the game altogether, which was the Big Ten Championship. Ironically, despite the fact that Ohio State would’ve gone on to the Rose Bowl had the game been cancelled (Michigan did not want to reschedule), it was Ohio State’s athletic director who ultimately refused to cancel the game, much to the rest of the staff’s disappointment. Perhaps after the fact, considering Ohio State lost 9-3, that decision was regretted, especially in front of the more than 50,000 die-hard fans that managed to show up for the game.
Columbus would receive 7.5″ at the airport, with eastern suburbs getting up to 10″, just on that Saturday alone.
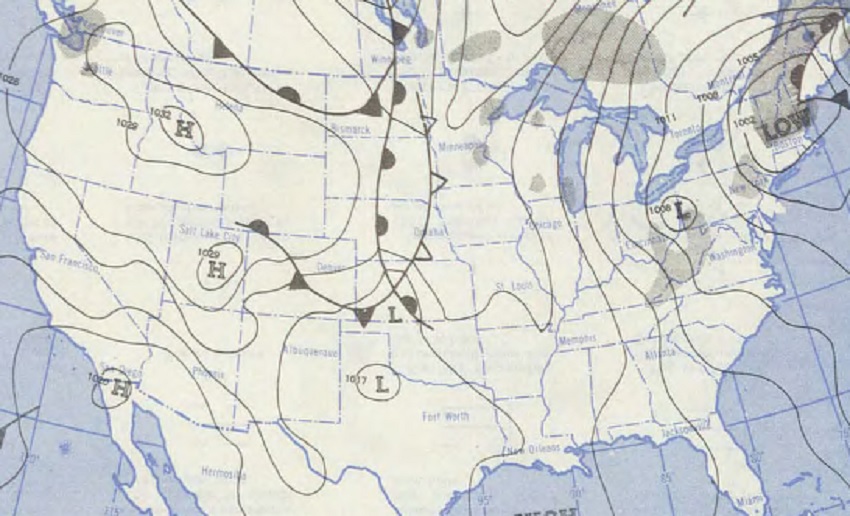
Due to the blocking high pressure, the storm didn’t budge for days, and it continued through the 26th and 27th before slowly dying out. The last accumulating snowflakes from this system fell on the 29th, 6 days after the snow began.
Sunday, November 26th, 1950 National Map
Monday, November 27th, 1950 National Map
Tuesday, November 28th, 1950 National Map
Wednesday, November 29th, 1950 National Map
All in all, the storm was a record-breaker. Snow totals reached 10″ or more across most of the state except the far northwest and far southwest. In Central Ohio, snow had piled up between 10″-20″, with Columbus officially reporting 15.2″ for the duration of the event. This was the second-heaviest snowstorm in Columbus on record to that time, falling just shy of the 15.3″ that occurred February 17-18, 1910. Both of these storms would be surpassed by the February 14-17, 2003 snowstorm of 15.5″, which itself was surpassed by March 7-8th, 2008’s 20.5″.
Other totals in the state included up to 22″ in Cleveland, 27″ in Marietta, and reports of 44″ in Steubenville in far eastern Ohio. Totals of 25″-30″ were common throughout the eastern 1/3rd of the state. These totals are some of the highest the state has ever seen, coming close to those seen in the eastern Ohio snowstorm of April 1901.
In addition to the snow, record cold temperatures in Columbus of 5 degrees on the 25th (along with a record low maximum of 20) made this one of the greatest early winter events of all time.
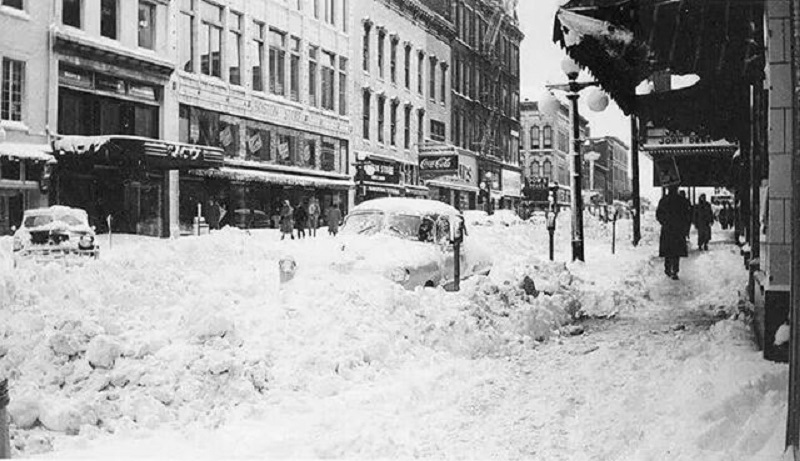
Cleveland after the storm.
For more November weather records, go here: November Weather