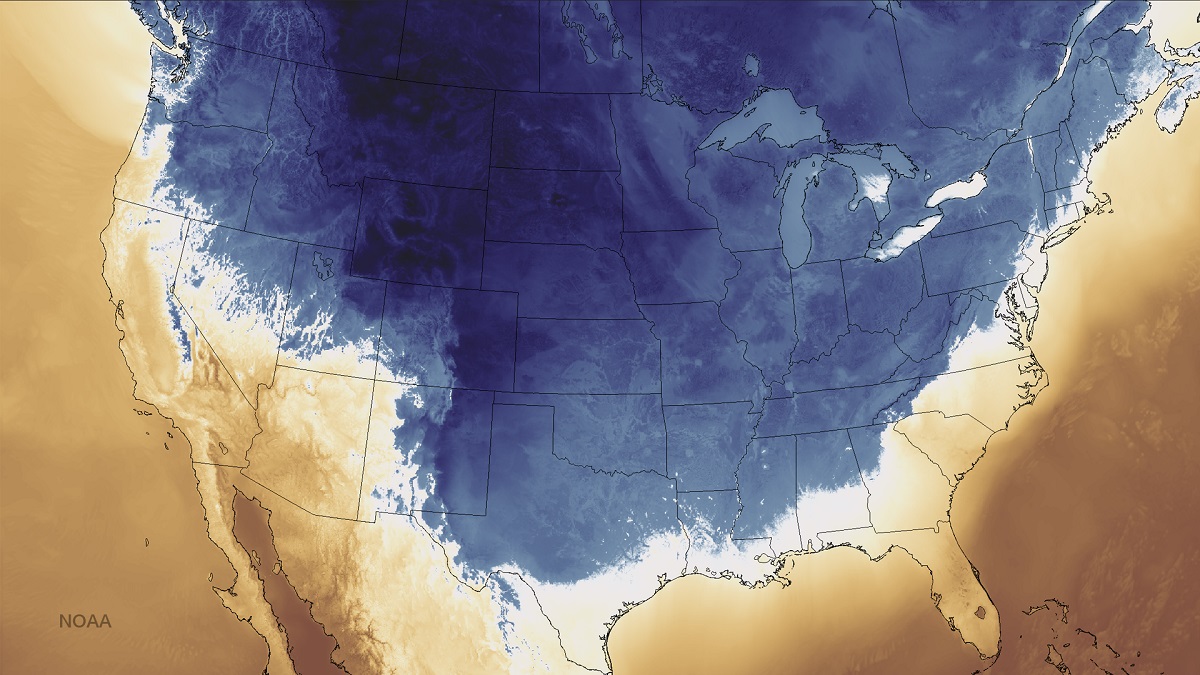
With temperatures predicted to fall to near freezing for the first time this week for the fall season, I thought it might be interesting to take a look at the incidence of early season cold, and the average on when it tends to arrive.
Here are the earliest dates on record for the following:
Average Date of First Under-40 Temp By Decade (1878-2014) 2010s: October 11th 2000s: October 8th 1990s: October 2nd 1980s: September 30th 1970s: October 1st 1960s: September 25th 1950s: September 25th 1940s: September 30th 1930s: October 11th 1920s: October 2nd 1910s: October 9th 1900s: October 5th 1890s: October 1st 1880s: October 2nd 1870s: October 1st
Average Date of First 32 or Below High By Decade 2010s: December 4th 2000s: December 2nd 1990s: December 7th 1980s: November 28th 1970s: November 29th 1960s: November 23rd 1950s: November 26th 1940s: December 2nd 1930s: November 27th 1920s: November 28th 1910s: November 22nd 1900s: November 30th 1890s: November 25th 1880s: November 30th 1870s: December 4th
Average Date of First 32 or Below Low By Decade 2010s: October 24th 2000s: October 26th 1990s: October 22nd 1980s: October 17th 1970s: October 17th 1960s: October 8th 1950s: October 22nd 1940s: November 3rd 1930s: October 24th 1920s: October 28th 1910s: October 31st 1900s: October 24th 1890s: October 20th 1880s: October 20th 1870s: October 26th
As summer slowly approaches its inevitable end, thoughts of winter have started to creep into our minds. The last two winters seemed particularly harsh, and questions were often asked as to their historic status as well as whether another bad winter was on the way. Ask any older person in Ohio, and the winters between 1976 and 1979 will often come up. But do they really deserve their reputations? To find out, I came up with a ranking system for meteorological winter only- December through February0- to rank the worst winters of all time. Here was the criteria:
Temperature: # of 32 or Below Highs, # of 32 or Below Lows, # of 0 or Below Highs, # of 0 or Below Lows: Each earned the winter a point for each day that featured these conditions. # of 60 or Above Highs and # of 50 or Above Lows meant a point was removed for each occurrence.
Precipitation: # of Days with Measurable Snowfall, # of 1″+ Snow Days, # of 2.5″+ Snow Days, # of 5″+ Snow Days, # of 10″+ Snow Days as well as # of Measurable Precipitation Days all counted as 1 point for each occurrence.
I then added the temperature and precipitation points together to come up with a ranking for how miserable each winter really was.
Do any of these surprise you? Both 2013-2014 and 2014-2015 are in the top 30 worst, but only 2013-2014 is in the top 10. In fact, other recent winters like 2000-2001, 2002-2003, 2009-2010 and 2010-2011 are all ranked worse than last winter. There have been a surprising number of recent winters in the top 30, however. There have been 8 total since 2000. No other similar time frame has produced as many.
Look how many of the warmest/least snowy occur between 1920 and 1945. Historically, this period had the fewest number of cold and/or snowy winters on record of any such 25-year period.
And what about winter 2015-2016? Well, that remains to be seen. However, the developing strong El Nino suggests a warmer than average winter. However, factors such as its position (west or east-based) as well as the PDO could throw some wrenches into that standard El Nino forecast. Either way, it will likely not be a top 30 worst.
This summer has been wet… very wet. Rain has fallen on far more days than not, and cloud cover has hung thick and heavy in what are historically much sunnier months. To top it all off, temperatures have been somewhat below normal.
How wet has the Summer of Rain 2015 been up through today? Meteorological summer runs June 1st-August 31st, and today makes the midpoint of that period, so I thought it would be a good time to check in and answer that question.
Here are the top 10 wettest summers through yesterday. 1. 1958: 12.54″ 2. 2008: 11.68″ 3. 1990: 10.93″ 4. 2015: 10.66″ 5. 1949: 10.40″ 6. 1973: 10.23″ 7. 1917: 10.06″ 8. 1928: 10.02″ 9. 1937: 9.75″ 10. 1969: 9.38″
So 2015 is running the 4th wettest. It looks to be dry the next few days before more thunderstorms and rain return, so 2015′s position may end up rising.
What are the wettest full summers of all time? A few of the above years went on to be in the top 10, but not all. 1. 1958: 22.02″ 2. 1979: 20.92″ 3. 1995: 19.85″ 4. 2003: 19.39″ 5. 1969: 19.09″ 6. 1915: 18.92″ 7. 1992: 18.44″ 8. 1973: 17.81″ 9. 1989: 17.45″ 10. 1949: 16.54″
Summer 2015 needs about 6″ more to reach into the top 10 wettest summers, which at the current pace is more than possible.
The mid-November 2014 cold wave that kickstarted a historic winter.
The Winter 2014-2015 Review details the historic season, with its bouts of extreme cold and heavy snowfall occurring in all months except December.
Temperature and snowfall ranking data goes back to the winter of 1878-1879. Snow depth ranking data goes back to 1940.
December-February Only Average High: 34.8 19th Coldest Average Low: 19.3 14th Coldest Mean: 27.1 15th Coldest Precipitation: 7.27″ 57th Driest Snowfall: 23.9″ 33rd Snowiest Average Daily Snow Depth: 0.9″ 15th Highest Largest Snowstorm: 6.8″ on February 21st 32 or Below Highs: 36 14th Most 32 or Below Lows: 76 13th Most Measurable Precipitation Days: 36 12th Fewest Measurable Snowfall Days: 15 11th Fewest Deepest Snow Depth: 6″ on February 21st Days with 1″+ Snow Depth: 30 16th Most
Entire Cold Season: October-April Average High: 46.6 14th Coldest Average Low: 29.4 14th Coldest Mean: 38.0 14th Coldest Precipitation: 19.51″ 67th Wettest Snowfall: 33.4″ 28th Snowiest Average Snow Depth: 0.6″ 7th Lowest Largest Snowstorm: 6.8″ on February 21st 32 or Below Highs: 43 12th Most 32 or Below Lows: 116 17th Most Measurable Precipitation Days: 89 16th Most Measurable Snowfall Days: 22 13th Fewest Deepest Snow Depth: 6″ on February 21st Days with 1″+ Snow Depth: 45 8th Most
Average High By Month October 2014: 63.4 32nd Coldest November 2014: 45.7 9th Coldest December 2014: 42.1 33rd Warmest January 2015: 33.8 32nd Coldest February 2015: 28.6 5th Coldest March 2015: 47.6 37th Coldest April 2015: 63.5 34th Warmest
Average Low By Month October 2014: 45.4 37th Warmest November 2014: 30.0 6th Coldest December 2014: 29.9 19th Warmest January 2015: 18.1 33rd Coldest February 2015: 10.0 3rd Coldest March 2015: 28.1 22nd Coldest April 2015: 42.9 28th Warmest
Mean By Month October 2014: 54.4 35th Coldest November 2014: 37.9 7th Coldest December 2014: 36.0 27th Warmest January 2015: 26.0 31st Coldest February 2015: 19.3 2nd Coldest March 2015: 37.9 33rd Coldest April 2015: 53.2 28th Warmest
Precipitation By Month October 2014: 2.77″ 42nd Wettest November 2014: 1.46″ 22nd Driest December 2014: 2.70″ 63rd Driest January 2015: 2.87″ 51st Wettest February 2015: 1.70″ 45th Driest March 2015: 3.92″ 45th Wettest April 2015: 4.09″ 37th Wettest
Snowfall By Month October 2014: Trace 2nd Least Snowy November 2014: 4.1″ 15th Snowiest December 2014: Trace 2nd Least Snowy January 2015: 8.4″ 48th Snowiest February 2015: 15.5″ 8th Snowiest March 2015: 5.4″ 23rd Snowiest April 2015: 0.0″ 1st Least Snowy
Average Snow Depth By Month October 2014: 0″ November 2014: 0.4″ December 2014: 0″ January 2015: 0.8″ February 2015: 3.3″ March 2015: 1.1″ April 2015: 0″
Maximum High By Month October 2014: 86 on the 2nd November 2014: 69 on the 11th December 2014: 61 on the 1st January 2015: 59 on the 3rd February 2015: 56 on the 8th March 2015: 69 on the 16th April 2015: 79 on the 13th and 18th
Minimum High By Month October 2014: 49 on the 31st November 2014: 19 on the 18th December 2014: 26 on the 31st January 2015: 13 on the 7th February 2015: 8 on the 15th and 19th March 2015: 23 on the 5th and 6th April 2015: 50 on the 23rd
Minimum High Records -The 33 on November 14th was a record for the day, beating the old record of 34 set in 1900, 1908, 1911 and 1916. -The 19 on November 18th tied the record for the day set in 1904. -The 8 on February 15th was a record for the day, beating the old record of 12 set in 1920. -The 10 on February 16th was a record for the day, beating the old record of -The 8 on February 19th was a record for the date, beating the old record of 10 set in 1885. -The 18 on February 27th tied the record for the date set in 1888 and 1934. -The 25 on February 28th was a record for the date, beating the old record of 26 set in 1986.
Maximum Low By Month October 2014: 58 on the 13th and 14th November 2014: 47 on the 4th December 2014: 44 on the 23rd January 2015: 34 on the 18th and 21st February 2015: 41 on the 8th March 2015: 43 on the 16th April 2015: 57 on the 19th
Maximum Low Records -The 54 on November 30th was a record for the date, beating the old record of 53 set in 1998 and 2006.
Minimum Low By Month October 2014: 38 on the 4th, 26th and 31st November 2014: 12 on the 18th December 2014: 15 on the 15th January 2015: -6 on the 8th February 2015: -11 on the 24th March 2015: 4 on the 6th April 2015: 28 on the 24th
Minimum Low Records -The -11 on February 24th was a record for the date, beating the old record of -1 set in 1914. -The 0 on February 28th was a record for the date, beating the old record of 2 set in 1934. -The 28 on April 24th tied the record for the date set in 1930.
Highest Daily Precipitation By Month October 2014: 0.57″ on the 6th November 2014: 0.39″ on the 17th December 2014: 0.82″ on the 6th January 2015: 1.46″ on the 3rd February 2015: 0.55″ on the 1st March 2015: 0.63″ on the 14th April 2015: 0.66″ on the 2nd
Highest Daily Snowfall By Month October 2014: Trace on the 4th November 2014: 3.8″ on the 17th December 2014: Trace on the 10th, 17th, 18th, 19th, 20th and 31st January 2015: 3.7″ on the 6th February 2015: 6.8″ on the 21st March 2015: 3.6″ on the 1st April 2015: 0.0″
Snowfall Records -The 6.8″ on February 21st was a record for the day, beating the old record of 5.8″ set in 1893. -The 3.6″ on March 1st was a record for the date, beating the old record of 3.5″ set in 1954.
Deepest Snow Depth By Month October 2014: 0″ November 2014: 3″ on the 18th and 19th December 2014: 0″ January 2015: 3″ on the 6th, 7th and 9th February 2015: 6″ on the 21st March 2015: 6″ on the 1st and 2nd April 2015: 0″