Winter 2018-2019 Review


Winter 2018-2019 Review Columbus, Ohio

The Winter 2018-2019 Review reveals the season was another one of extremes, with record highs and near record lows, snowy months and snowless months. The only real consistency was how wet it was.

Temperature and snowfall ranking data goes back to the winter of 1878-1879. Snow depth ranking data goes back to 1940. Rankings are accurate through the 2018-2019 winter.

December-February Only
Average High: 41.4 22nd Warmest
Average Low: 26.4 21st Warmest
Mean: 33.8 24th Warmest
Precipitation: 12.15″ 8th Wettest
Snowfall: 23.3″ 35th Snowiest
Average Daily Snow Depth: 0.5″
32 or Below Highs: 22 16th Fewest
32 or Below Lows: 66 14th Fewest
Measurable Precipitation Days: 43 10th Most
Measurable Snowfall Days: 22 15th Most
Deepest Snow Depth: 4″ on January 13th and 20th, February 1st and 2nd
Days with 1″+ Snow Depth: 17 14th Fewest

Entire Cold Season- October-April
Average High: 49.7 27th Warmest
Average Low: 33.3 25th Warmest
Mean: 41.5 23rd Warmest
Precipitation: 29.33″ 3rd Wettest
Snowfall: 27.4″ 44th Snowiest
Average Snow Depth: 0.2″
32 or Below Highs: 27 17th Fewest
32 or Below Lows: 106 25th Fewest
Measurable Precipitation Days: 91 14th Most
Measurable Snowfall Days: 29 16th Most
Deepest Snow Depth: 4″ on January 13th and 20th, February 1st and 2nd
Days with 1″+ Snow Depth: 20 13th Fewest

Average High By Month
October 2018: 65.7 43rd Warmest
November 2018: 45.2 8th Coldest
December 2018: 44.1 21st Warmest
January 2019: 36.6 48th Coldest
February 2019: 43.4 25th Warmest
March 2019: 47.5 36th Coldest
April 2019: 65.4 21st Warmest

Average Low By Month
October 2018: 47.2 25th Warmest
November 2018: 33.2 28th Coldest
December 2018: 30.6 15th Warmest
January 2019: 22.2 47th Warmest
February 2019: 26.3 33rd Warmest
March 2019: 28.7 27th Coldest
April 2019: 44.6 12th Warmest

Mean By Month
October 2018: 56.5 28th Warmest
November 2018: 39.2 14th Coldest
December 2018: 37.3 18th Warmest
January 2019: 29.4 51st Coldest
February 2019: 34.8 30th Warmest
March 2019: 38.1 34th Coldest
April 2019: 55.0 14th Warmest

Precipitation By Month
October 2018: 2.60″ 43rd Wettest
November 2018: 5.70″ 4th Wettest
December 2018: 3.57″ 30th Wettest
January 2019: 3.09″ 47th Wettest
February 2019: 5.49″ 6th Wettest
March 2019: 5.33″ 15th Wettest
April 2019: 3.55″ 54th Wettest

Snowfall By Month
October 2018: 0.0″
November 2018: 2.1″
December 2018: 0.4″
January 2019: 11.3″
February 2019: 11.6″
March 2019: 2.0″
April 201: 0.0″

Average Daily Snow Depth By Month
October 2018: 0.0″
November 2018: Trace
December 2018: 0.0″
January 2019: 1″
February 2019: 0.5″
March 2019: 0.1″
April 2019: 0.0″

Maximum High By Month
October: 88 on the 6th and 8th
November: 61 on the 1st
December: 66 on the 2nd
January: 62 on the 8th
February: 62 on the 7th
March: 75 on the 14th
April: 82 on the 11th

Maximum High Records
-The 62 on February 7th was a record for the date, beating the old record of 61 set in 1925.

Minimum High By Month
October: 49 on the 21st
November: 30 on the 28th
December: 28 on the 8th
January: 11 on the 31st
February: 22 on the 1st
March: 20 on the 5th
April: 43 on the 1st

Minimum High Records
-The 33 on November 14th tied the record set in 2014.
-The 20 on March 5th tied the record set in 1890.

Maximum Low By Month
October: 69 on the 2nd and 9th
November: 50 on the 5th
December: 46 on the 15th
January: 41 on the 8th
February: 43 on the 6th
March: 51 on the 14th and 29th
April: 64 on the 18th

Maximum Low Records
-The 69 on October 2nd was a record for the date, beating the old record of 68 set in 1881 and 1884.
-The 68 on October 8th tied the record for the date set in 1879.
-The 69 on October 9th tied the record for the date set in 1879.
-The 68 on October 10th was a record for the date, beating the old record of 66 set in 1879.
-The 43 on February 6th was a record for the date, beating the old record of 42 set in 1991.
-The 64 on April 18th was a record for the date, beating the old record of 63 set in 1941.

Minimum Low By Month
October: 32 on the 22nd and 25th
November: 22 on the 10th and 11th
December: 16 on the 10th
January: -4 on the 30th and 31st
February: 9 on the 2nd
March: 7 on the 5th
April: 24 on the 1st

Highest Daily Precipitation By Month
October: 0.63″ on the 31st
November: 1.80″ on the 1st
December: 1.01″ on the 31st
January: 0.81″ on the 19th
February: 1.22″ on the 20th
March: 1.97″ on the 30th
April: 0.77″ on the 19th

Precipitation Records
-The 1.80″ on November 2nd was a record for the date, beating the old record of 1.45″ set in 1984.
-The 1.01″ on December 31st was a record for the date, beating the old record of 0.89″ set in 1887.
-The 0.91″ on February 12th was a record for the date, beating the old record of 0.77″ in 1930.
-The 1.97″ on March 30th was a record for the date, beating the old record of 1.47″ set in 1987.

Highest Daily Snowfall By Month
October: 0.0″
November: 1.3″ on the 15th
December: 0.2″ on the 5th
January: 4″ on the 12th
February: 4.2″ on the 1st
March: 1.9″ on the 3rd
April: 0.0″

Deepest Snow Depth By Month
October: 0″
November: 1″
December: 0″
January: 4″ on the 13th and 20th
February: 4″ on the 1st and 2nd
March: 2″ on the 1st
April: 0″

Overall, the winter of 2018-2019, while having a few cold spells, was largely warmer than normal. It was also wet and had snowfall near normal.

For more winter season records and local weather information, visit Winter Season Records or
Wilmington National Weather Service.

The Biggest Snowstorms of All Time


The biggest snowstorms of all time Columbus, Ohio

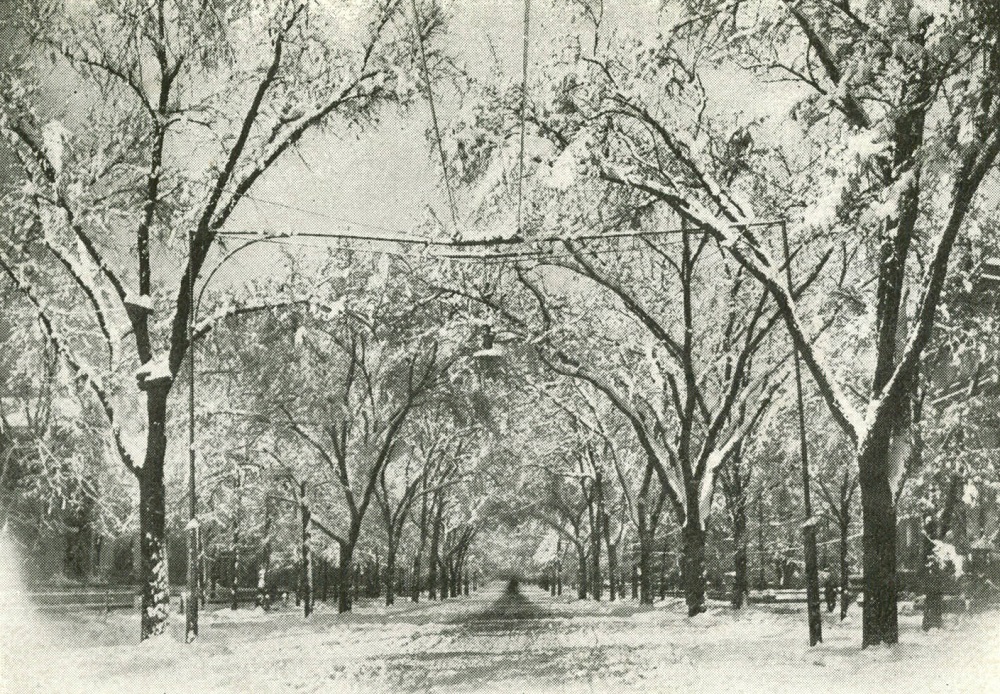
East Broad Street after a snowstorm in March, 1906.

In light of yesterday’s strange storm that challenged local forecasters, I thought it might be time to look at the biggest snowstorms of all time in Columbus, or at least since records began in 1878. I looked up the total snowfall over different periods of time.

Top 20 Largest Single Snowstorms of Any Duration
1. 3/7-3/8/2008: 20.5″
2. 2/14-2/17/2003: 15.5″
3. 2/16-2/19/1910: 15.3″
4. 11/23-11/29/1950: 15.2″
5. 1/6-1/7/1910: 12.7″
6. 4/3-4/5/1987: 12.6″
7. 1/7-1/9/1884, 2/11-2/12/1910: 10.6″
8. 2/15-2/16/2010, 2/4-2/5/2014: 10.4″
9. 3/19-3/20/1906, 1/13-1/14/1917: 10.0″
10. 2/7-2/8/1971, 1/16-1/17/1978, 2/5-2/6/2010: 9.9″
11. 1/6-1/7/1996: 9.8″
12. 1/13-1/15/1968, 2/27-2/28/1984: 9.5″
13. 2/13-2/14/1914: 9.3″
14. 3/5-3/6/1962: 9.2″
15. 12/19-12/20/1960: 8.8″
16. 1/14-1/15/1918: 8.5″
17. 2/25-2/26/1934: 8.4″
18. 1/31-2/1/1881, 2/25-2/26/2014: 8.3″
19. 3/11-3/12/1906: 8.2″
20. 12/3-12/4/1957: 8.1″

Top 12 Largest 1-Day Snowfalls
1. 3/8/2008: 15.5″
2. 4/4/1987: 12.3″
3. 1/6/1910: 11.9″
4. 2/15/2010: 9.7″
5. 3/19/1906: 9.6″
6. 2/5/2010: 9.0″
7. 2/8/1971, 2/16/2003: 8.9″
8. 1/7/1996: 8.8″
9. 3/5/1962: 8.6″
10. 1/8/1884: 8.5″
11. 2/16/1910: 8.2″
12. 12/3/1957: 7.9″

Top 12 Largest 2-Day Snowfalls
1. 3/7-3/8/2008: 20.5″
2. 3/8-3/9/2008: 15.5″
3. 2/16-2/17/1910: 15.0″
4. 1/6-1/7/1910: 12.7″
5. 4/4-4/5/1987: 12.5″
6. 4/3-4/4/1987: 12.4″
7. 2/15-2/16/2003: 12.0″
8. 1/5-1/6/1910: 11.9″
9. 2/16-2/17/2003: 10.8″
10. 2/11-2/12/1910, 2/4-2/5/2014: 10.6″
11. 2/15-2/16/2010: 10.4″
12. 1/8-1/9/1884: 10.2″

Top 12 Largest 3-Day Snowfalls
1. 3/6-3/8/2008, 3/7-3/9/2008: 20.5″
2. 3/8-3/10/2008: 15.5″
3. 2/16-2/18/1910: 15.3″
4. 2/15-2/17/1910: 15.0″
5. 2/15-2/17/2003: 13.9″
6. 2/14-2/16/2003: 13.6″
7. 1/5-1/7/1910, 1/6-1/8/1910: 12.7″
8. 4/3-4/5/1987: 12.6″
9. 4/4-4/6/1987: 12.5″
10. 4/2-4/4/1987: 12.4″
11. 1/4-1/6/1910, 1/7-1/9/1996: 11.9″
12. 11/25-11/27/1950: 11.5″

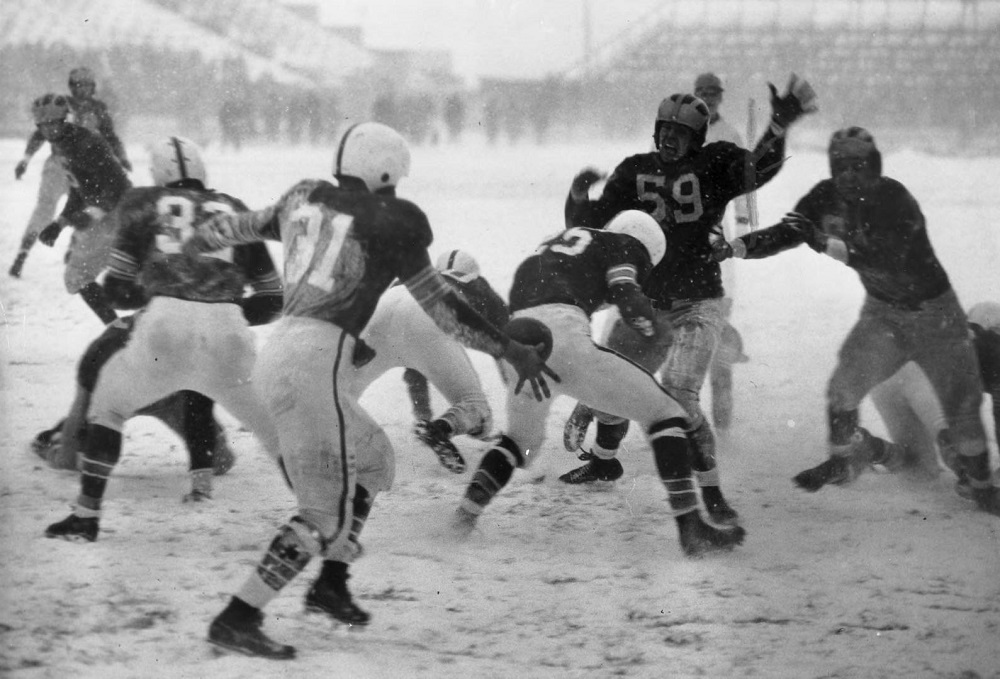
Players struggle during the infamous Ohio State-Michigan Snow Bowl game on November 27, 1950.


Top 12 5-Day Snowfalls
1. 3/4-3/8/2008, 3/5-3/9/2008: 21.2″
2. 3/6-3/10/2008, 3/7-3/11/2008: 20.5″
3. 1/16-1/20/1978: 17.6″
4. 3/31-4/4/1987: 16.4″
5. 2/15-2/19/2003: 15.9″
6. 4/2-4/6/1886: 15.7″
7. 2/13-2/17/2003, 2/14-2/18/2003, 3/8-3/12/2008: 15.5″
8. 2/14-2/18/1910, 2/15-2/19/1910, 2/16-2/20/1910: 15.3″
9. 2/13-2/17/1910: 15.0″
10. 4/3-4/7/1886, 2/12-2/16/1910, 2/5-2/9/2010: 14.3″
11. 1/17-1/21/1978: 14.2″
12. 2/12-2/16/2003: 14.0″

Top 12 Largest 7-Day Snowfalls
1. 2/11-2/17/1910: 25.6″
2. 2/12-2/18/1910: 21.4″
3. 3/2-3/8/2008, 3/3-3/9/2008, 3/4-3/10/2008, 3/5-3/11/2008: 21.2″
4. 3/6-3/12/2008, 3/7-3/13/2008: 20.5″
5. 1/14-1/20/1978: 19.0″
6. 2/10-2/16/1910: 18.8″
7. 3/30-4/5/1987: 18.3″
8. 3/29-4/4/1987: 18.1
9. 1/15-1/21/1978, 1/16-1/22/1978: 17.8″
10. 2/13-2/19/2003, 2/14-2/20/2003: 17.5″
11. 2/10-2/16/2003: 17.0″
12. 4/1-4/7/1886, 4/2-4/8/1886: 16.9″

Top 12 10-Day Snowfalls
1. 2/9-2/18/1910: 28.4″
2. 2/8-2/17/1910: 28.1″
3. 2/10-2/19/1910, 2/11-2/20/1910: 25.9″
4. 3/11-3/20/1906: 23.5″
5. 3/10-3/19/1906: 23.1″
6. 2/28-3/8/2008, 2/29-3/9/2008: 21.7″
7. 2/12-2/21/1910: 21.4″
8. 2/7-2/16/1910: 21.3″
9. 3/1-3/10/2008, 3/2-3/11/2008, 3/3-3/12/2008, 3/4-3/13/2008, 3/5-3/14/2008: 21.2″
10. 2/10-2/19/2003: 20.9″
11. 1/12-1/21/1978, 1/2-1/11/1996: 20.8″
12. 1/11-1/20/1978: 20.6″

Top 12 Largest 15-Day Snowfalls
1. 2/8-2/22/1910, 2/9-2/23/1910: 28.8″
2. 2/3-2/17/1910: 28.5″
3. 2/4-2/18/1910, 2/5-2/19/1910, 2/6-2/20/1910, 2/7-2/21/1910: 28.4″
4. 2/10-2/24/1910, 2/11-2/25/1910: 26.3″
5. 2/2-2/16/2010: 25.8″
6. 1/7-1/21/1978, 1/8-1/22/1978: 25.7″
7. 1/6-1/20/1978, 2/3-2/17/2010, 2/4-2/18/2010, 2/5-2/19/2010: 25.5″
8. 1/12-1/26/1978: 25.2″
9. 2/1-2/15/2010: 25.1″
10. 3/10-3/24/1906, 3/11-3/25/1906, 1/13-1/27/1978: 24.8″
11. 1/14-1/28/1978, 2/10-2/24/2003: 24.5″
12. 3/6-3/20/1906, 3/7-3/21/1906: 23.8″

Top 12 Largest 30-Day Snowfalls
1. 1/20-2/18/1910, 1/21-2/19/1910: 37.9″
2. 1/19-2/17/1910: 37.6″
3. 1/22-2/20/1910: 35.3″
4. 1/2-1/31/1978, 1/3-2/1/1978, 1/4-2/2/1978, 1/5-2/3/1978: 34.0″
5. 1/8-2/6/1978: 33.8″
6. 1/1-1/30/1978, 1/7-2/5/1978: 33.6″
7. 12/30/1977-1/28/1978, 12/31/1977-1/29/1978: 33.4″
8. 12/29/1977-1/27/1978: 32.8″
9. 12/28/1977-1/26/1978: 32.5″
10. 1/6-2/4/1978: 32.0″
11. 2/8-3/8/2008: 31.8″
12. 1/24-2/22/1910, 1/25-2/23/1910, 1/26-2/24/1910, 1/27-2/25/1910, 1/28-2/26/1910, 1/29-2/27/1910, 1/30-2/28/1910, 1/26-2/24/2003: 30.7″

Certain years show up on all the lists, including 1906, 1910, 1978, 2003, 2008 and 2010. These winters all had periods of extreme snowfall and are considered “historic”.
Check out more winter and other local weather data with the following links.
Winter Storms
Winter Season Records
Annual Weather Records
Wilmington National Weather Service


Ohio Had a Very Wet 2018


very wet 2018

If your yard has been a swampy no man’s land all year, there’s a reason for it. 2018 was one of the wettest years ever across the state. In some cities, almost every month featured above normal precipitation. Let’s take a look across the state to see how places fared in this extraordinary and very wet 2018.

Here were the final 2018 totals in major Ohio cities and how they rank since their records began.
Cincinnati: 55.90″ 3rd wettest since 1871.
Columbus: 55.18″ 1st wettest since 1878.
Cleveland: 51.47″ 4th wettest since 1871.
Youngstown: 50.97″ 2nd wettest since 1896.
Dayton: 48.99″ 10th wettest since 1893.
Akron: 48.46″ 5th wettest since 1896.
Toledo: 38.01″ 22nd wettest since 1871.

In big cities in Ohio, only Toledo managed to avoid having a top 10 wettest year. Columbus had its wettest on record, beating the previous record of 54.96″ set just a few years ago in 2011.

Locally in the Columbus metro, here were some other totals.
Newark: 56.01″
Marysville: 51.12″
Lancaster: 50.51″
Circleville: 46.66″
OSU Campus: 46.66″

Biggest Individual Precipitation Day and Rank
Cincinnati: 5.02″ on 8/16/2018, 2nd highest since 1871.
Youngstown: 3.50″ on 9/9/2018, 11th highest since 1896.
Dayton: 2.88″ on 4/3/2018, 24th highest since 1893.
Akron: 2.50″ on 9/9/2018, unranked.
Cleveland: 2.12″ on 11/1/2018, unranked.
Columbus: 2.06″ on 4/15/2018, unranked.
Toledo: 1.62″ on 3/1/2018, unranked.

Cincinnati had 2 days in the top 10, but most other cities had just constant rain rather than exceptionally high individual totals.

Total 2018 Measurable Precipitation Days and Rank
Youngstown: 191 1st most since 1896.
Akron: 180 1st most since 1896.
Cleveland: 177 8th most since 1871.
Columbus: 162 6th most since 1878.
Cincinnati: 151 7th most since 1871.
Dayton: 148 10th most since 1893.
Toledo: 142 16th most since 1871.

3 cities saw more than half their days with measurable precipitation. Columbus came in at just under 50%. This also had the unfortunate result of making most of the year feel unusually gloomy. Traditionally sunny months in the summer and fall were much cloudier than normal.


Total 2018 1″+ Precipitation Days and Rank
Columbus: 15 1st most since 1878.
Cleveland: 13 2nd most since 1871.
Cincinnati: 12 7th most since 1871.
Dayton: 11 6th most since 1893.
Akron: 10 5th most since 1896.
Toledo: 7 7th most since 1871.
Youngstown: 5 9th most since 1896.

Columbus had the most 1″ days of any year on record, and even beat every other major Ohio city.

Wettest 2018 Months
Cincinnati: 8.21″ in August
Youngstown: 7.91″ in September
Akron: 7.26″ in September
Dayton: 6.72″ in September
Columbus: 6.71″ in June
Cleveland: 6.68″ in July
Toledo: 5.91″ in May

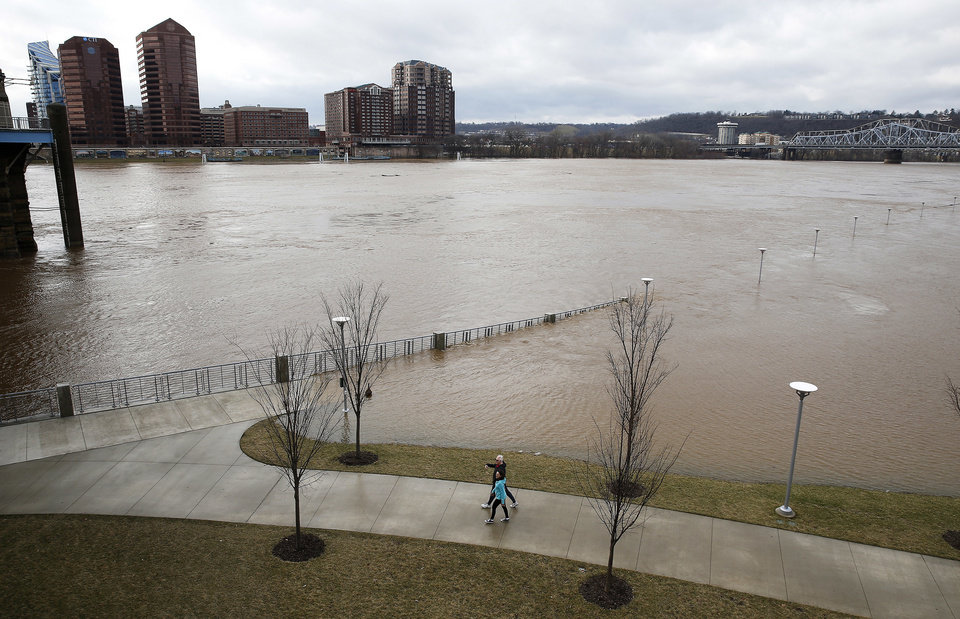
No cities saw any of their months be even close to the wettest ever. There were not really any events with heavy flooding, either, except in February in Cincinnati, when the Ohio River reached the highest since the 1997 flood. There was also some scattered flooding from some tropical system remnants that passed through, particularly in September, but for the most part, it was just constantly wet from beginning to end in most places.

Flooding in Cincinnati in February, 2018.


One might ask if 2018 was merely a blip or part of a long-term trend in the state. Climate scientists have actually looked at this, and the state has indeed been getting both warmer and wetter over the last century or so, but the pace of both the warming and the increase in precipitation has been much faster since the 1970s. Many of the Ohio’s wettest years on record have occurred since 1990.


The Week in Review 2


In Week in Review 2, we find that the FBI has finally released the full crime numbers for 2017 for all cities. How did Columbus fare? Well, it was a decidedly mixed bag. Total murders were their highest ever, at 143, but the rate fell quite short of the record set back in 1991. So far for 2018, murder is behind 2017’s rate by about 22%, so it’s a good improvement, but still not even close to where it should be.

Other violent crime figures 2016 to 2017
-Rape continued its multi-year rise in the city, reaching 919 incidents. This was a 6% increase over 2016.
-Assaults were up 4% over 2016, but in the context of still being one of the lowest totals in the past 30 years.
-Robberies were down almost 8.5% over 2016.
-Despite the rises in most types of violent crime, the drop in robberies meant overall violent crime dropped by about 0.5%.
Property crime figures 2016 to 2017
-Burglaries were down more than 8%.
-Larceny thefts were down about 2.9%
-Motor vehicle thefts were up 17.6%, so not a good trend, but still less than half the rate it was 15-20 years ago.
-Overall property crime was down about 2% versus 2016.

And if you think this year’s been particularly wet, you are right! Through October 1st, Columbus is having its 3rd wettest year on record. Only 1882 and 1890 are ahead of 2018 at this point, and by barely 1″. 2018 at this point is running almost 14″ above normal.
Top 10 Wettest Years Through October 1st
1. 1882: 44.55″
2. 1890: 43.56″
3. 2018: 43.31″
4. 1979: 42.17″
5. 2003: 41.58″
6. 2011: 41.12″
7. 1990: 39.10″
8. 1949: 38.54″
9. 2004: 38.46″
10. 1996: 37.46″
It is surprising how many recent years are on this list. Still with 3 months to go, the pattern could break, but it’s very unlikely that 2018 doesn’t end up in the top 10. Here are the top 10 wettest full years.
1. 2011: 54.96″
2. 1990: 53.16″
3. 1882: 51.30″
4. 1890: 50.73″
5. 2004: 49.27″
6. 1979: 49.17″
7. 2003: 49.03″
8. 1883: 48.88″
9. 1881: 46.99″
10. 2017: 46.61″

I guess it could always be worse…
The week in review 2 Columbus, Ohio


Winter 2017-2018 Review


Winter 2017-2018 Review Columbus, Ohio

Wind and heavy snow on the evening of January 12, 2018.

The Winter 2017-2018 Review shows the season featured some wild swings, from a very cold late December-early January to one of the warmest Februaries of all time. Let’s take a closer look at this volatile season, specifically December to February.

Temperature and snowfall ranking data goes back to the winter of 1878-1879. Snow depth ranking data goes back to 1940.

December-February Only
Average High: 40.2 29th Warmest
Average Low: 24.2 42nd Warmest
Mean: 32.2 36th Warmest
Precipitation: 9.40″ 33rd Wettest
Snowfall: 24.6″ 32nd Snowiest
Average Daily Snow Depth: 0.7″ 8th Lowest
32 or Below Highs: 29 21st Most
32 or Below Lows: 70 18th Fewest
Measurable Precipitation Days: 40
Measurable Snowfall Days: 20
Deepest Snow Depth: 5″ on January 16th and 17th
Days with 1″+ Snow Depth: 26 19th Most

Entire Cold Season: October-April
Average High: 49.6 29th Warmest
Average Low: 32.0 36th Coldest
Mean: 40.8 30th Warmest
Precipitation: 25.83″ 13th Wettest
Snowfall: 30.7″ 34th Snowiest
Average Snow Depth: 0.3″ 4th Lowest
32 or Below Highs: 29 19th Fewest
32 or Below Lows: 119 14th Most
Measurable Precipitation Days: 87 18th Most
Measurable Snowfall Days: 34 11th Most
Deepest Snow Depth: 5″ on January 16th and 17th
Days with 1″+ Snow Depth: 31 20th Most

Average High By Month
October 2017: 68.5 21st Warmest
November 2017: 52.5 33rd Warmest
December 2017: 38.6 36th Coldest
January 2018: 35.4 39th Coldest
February 2018: 47.3 7th Warmest
March 2018: 47.5 36th Coldest
April 2018: 58.0 14th Coldest

Average Low By Month
October 2017: 48.8 15th Warmest
November 2017: 34.8 38th Warmest
December 2017: 23.7 33rd Coldest
January 2018: 19.3 39th Coldest
February 2018: 30.3 9th Warmest
March 2018: 29.6 33rd Coldest
April 2018: 37.5 9th Coldest

Mean By Month
October 2017: 58.6 16th Warmest
November 2017: 43.6 32nd Warmest
December 2017: 31.2 37th Coldest
January 2018: 27.3 39th Coldest
February 2018: 38.8 7th Warmest
March 2018: 38.5 36th Coldest
April 2018: 47.7 12th Coldest

Precipitation By Month
October 2017: 3.57″ 28th Wettest
November 2017: 4.67″ 15th Wettest
December 2017: 1.76″ 28th Driest
January 2018: 2.39″ 64th Wettest
February 2018: 5.25″ 8th Wettest
March 2018: 2.96″ 57th Driest
April 2018: 5.23″ 15th Wettest

Snowfall By Month
October 2017: Trace 2nd Least Snowy
November 2017: Trace 2nd Least Snowy
December 2017: 8.1″ 23rd Snowiest
January 2018: 10.5″ 38th Snowiest
February 2018: 6.0″ 45th Snowiest
March 2018: 3.2″ 48th Least Snowy
April 2018: 2.9″ 8th Snowiest

Average Snow Depth By Month
October 2017: 0″ 1st Lowest
November 2017: 0″ 1st Lowest
December 2017: 0.3″ 4th Lowest
January 2018: 1.4″ 15th Lowest
February 2018: 0.4″ 5th Lowest
March 2018: 0.1″ 2nd Lowest
April 2018: 0.1″ 2nd Lowest


Maximum High By Month
October 2017: 86 on the 4th
November 2017: 73 on the 5th
December 2017: 60 on the 4th
January 2018: 60 on the 11th and 22nd
February 2018: 77 on the 20th
March 2018: 61 on the 19th and 29th
April 2018: 82 on the 13th

Record Highs
-The 77 on February 20th was a record for the date, beating the old record of 68 set in 1891 and 2016.

Minimum High By Month
October 2017: 43 on the 28th
November 2017: 35 on the 10th
December 2017: 17 on the 27th
January 2018: 10 on the 2nd
February 2018: 22 on the 2nd
March 2018: 33 on the 8th
April 2018: 37 on the 17th

Minimum High Records
-The 10 on January 2nd was a record for the date, beating the old record of 11 set in 1928.
-The 37 on April 17th was a record for the date, beating the old record of 39 set in 1907.

Maximum Low By Month
October 2017: 66 on the 7th
November 2017: 60 on the 5th
December 2017: 47 on the 22nd
January 2018: 52 on the 11th
February 2018: 60 on the 20th
March 2018: 51 on the 28th
April 2018: 63 on the 13th

Record Maximum Lows
-The 47 on December 22nd tied the record set in 2015, and ties for the warmest December low on record.
-The 55 on February 15th was a record for the date, beating the old record of 53 set in 1954.
-The 60 on February 20th was a record for the date, beating the old record of 49 set in 1930.
-The 63 on April 13th was a record for the date, beating the old record of 61 set in 1916.

Minimum Low By Month
October 2017: 31 on the 26th
November 2017: 21 on the 11th
December 2017: 2 on the 31st
January 2018: -4 on the 2nd
February 2018: 10 on the 5th
March 2018: 20 on the 10th
April 2018: 25 on the 8th

Highest Daily Precipitation By Month
October 2017: 1.14″ on the 8th
November 2017: 1.72″ on the 5th
December 2017: 0.72″ on the 23rd
January 2018: 0.66″ on the 12th
February 2018: 1.23″ on the 24th
March 2018: 0.83″ on the 1st
April 2018: 2.06″ on the 15th

Precipitation Records
-The 1.14″ on the October 8th was the record for the date, beating the old record of 0.92″ set in 1959.
-The 1.72″ on November 5th was the record for the date, beating the old record of 0.88″ set in 1988.
-The 1.95″ on April 3rd was a record for the date, beating the old record of 1.50″ set in 2000.
-The 2.06″ on April 15th was a record for the date, beating the old record of 1.46″ set in 1939.

Highest Daily Snowfall By Month
October 2017: Trace on the 28th
November 2017: Trace on the 22nd
December 2017: 2.1″ on the 30th
January 2018: 3.5″ on the 12th
February 2018: 4.4″ on the 7th
March 2018: 0.9″ on the 21st
April 2018: 0.9″ on the 1st

Snowfall Records
-The 4.4″ on February 7th was a record for the date, beating the old record of 3.6″ set in 1895.
-The 0.9″ on March 21st was a record for the date, beating the old record of 0.8″ set in 1984.

Deepest Snow Depth By Month
October 2017: 0″
November 2017: 0″
December 2017: 3″ on the 30th and 31st
January 2018: 5″ on the 16th and 17th
February 2018: 4″ on the 7th
March 2018: 1″ on the 8th, 14th and 21st
April 2018: 1″ on the 2nd and 7th

So overall, the winter was definitely warmer than normal, but not record-breaking, even with the extremely warm February. It was also wetter and snowier than normal as well.

To see other winter records and local weather information, check out the following links.
Winter Season Records
Wilmington National Weather Service

Other Winter Reviews
Winter 2016-2017
Winter 2015-2016
Winter 2014-2015