These Columbus Christmases past photos give a short walk down memory lane of one of the most popular and favorite holidays.
Date: 1952 Location: Corner of W. Town Street and S. Ludlow Street along the Scioto River. Santa and Mrs. Claus ride on a float in the annual Lazarus Christmas parade.
Date: 1980 Location: Ohio Expo Center Multipurpose Building at 717 E. 17th Avenue. The Festival of Trees was an annual event sponsored by Children’s Hospital and Nationwide for charities. In 1980, there were 82 themed Christmas trees on display, which people could buy for at prices up to $1,000 each.
Date: Christmas Day, 1983 Location: Corner of Ebner and Columbus Street, German Village Christmas 1983 was one of the coldest on record, with a high of just 1 degree above zero and an average temperature of -6. The cold caused water mains to burst in several locations, including in German Village, which some children took advantage of for a little fun.
Date: 1965 Location: 518 E. Broad Street State Auto Mutual Insurance began holding a Christmas lighting event every year beginning in 1931.
Date: Around 1955 Location: Lazarus Department Store, South High Street Lazarus was famous for its window Christmas displays for well over 100 years, with many being very elaborate. The Christmas displays continued until the 2000s.
Date: 1992 Location: Scioto Riverfront, Downtown The replica of Christopher Columbus’ Santa Maria, decorated for Christmas in the photo, sat in Battelle Riverfront Park from 1991 until it was permanently dismantled during construction of Scioto Greenways in 2014.
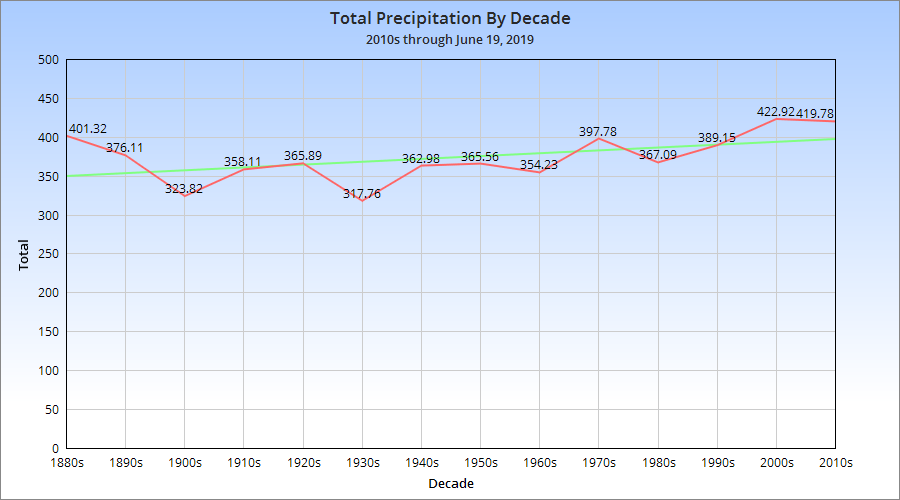
If it seems like the last few years have been particularly wet, you’d be right. Columbus, other Ohio cities and many areas in the Midwest have been seeing record rainfall of late. Yesterday alone, June 19th, Columbus had a daily record 2.65″ of rain, flooding many streets across Franklin County, including I-71 in at least 2 places. Is it indicative of a fluke pattern or a local result of climate change? Let’s look at the numbers and trends more closely.
First of all, let’s look at the 20 wettest years on record through June 19th. 1. 1882: 32.50″ 2. 1890: 30.12″ 3. 2019: 27.08″ 4. 1964: 25.78″ 5. 2011: 25.68″ 6. 1893: 25.50″ 7. 2004: 25.49″ 8. 1996: 24.94″ 9. 1949: 24.52″ 10. 1945: 24.49″ 11. 1913: 24.45″ 12. 1883: 24.18″ 13. 2018: 23.98″ 14. 2008: 23.62″ 15. 1950: 23.60″ 16. 1990: 23.56″ 17. 1981: 23.49″ 18. 1898: 22.94″ 19. 1927: 22.92″ 20. 1937: 22.69″
So far, 2019 has had the 3rd highest rain total to date since 1879.
4 years this decade have been among the top 20 wettest years since 1879. Only the 1880’s can match that record, though both the 2000s and 2010s have been wetter, as shown below.
Ironically, few individual months in recent years have featured record precipitation. In the last 10 years, only 1 month- July 2017- appears in the top 25 wettest months. It’s just been more of a constant wet pattern, where most months now have above to well-above normal precipitation. While climate change can’t account for individual events or specific record rainfalls, the patterns are obvious enough to show that the climate in Columbus and in many other parts of the country is changing over time. This means that we should come to expect more of this in the years to come.
On April 22nd of this year, All Columbus Data suffered a major hack. Several attempts were made to restore the website in full and to save the content through backups. At least twice, the site was restored only for it to fall back into the hacked configuration- some kind of jewelry website. Eventually, it was determined that there was corruption within the core files themselves, and since it could not be safely determined which ones, the host refused to restore any of the original content, as the attack was malicious enough to threaten the hosting servers themselves. So, the site was completely scrubbed and at least some of the original content that was not otherwise saved on archived websites was lost. After 7 years of work, it was a sickening result. Now, the rebuilding process has begun. Fortunately, a lot of the core lost data much of the site was built upon still existed in my own personal files, so for many of the pages, it’s simply a matter of putting that information back up on new pages. That is what I’ve been working on this week. Here is what I’ve done so far this week:
-2 new articles were added. -Monthly weather pages for April and May have been restored, complete with updated data for 2019. -Several pages within the Historic Building Database have had at least a few buildings added. -Partially restored the Completed page for Columbus Development . -Added several population graphs to the Columbus city, county and metro area demographics pages. -Partially restored- and expanded- the Columbus Tornado History page, one of All Columbus Data’s most popular.
I will continue to work to restore more pages and posts over time, but it will be an extended process.
The Winter 2018-2019 Review reveals the season was another one of extremes, with record highs and near record lows, snowy months and snowless months. The only real consistency was how wet it was.
Temperature and snowfall ranking data goes back to the winter of 1878-1879. Snow depth ranking data goes back to 1940. Rankings are accurate through the 2018-2019 winter.
December-February Only Average High: 41.4 22nd Warmest Average Low: 26.4 21st Warmest Mean: 33.8 24th Warmest Precipitation: 12.15″ 8th Wettest Snowfall: 23.3″ 35th Snowiest Average Daily Snow Depth: 0.5″ 32 or Below Highs: 22 16th Fewest 32 or Below Lows: 66 14th Fewest Measurable Precipitation Days: 43 10th Most Measurable Snowfall Days: 22 15th Most Deepest Snow Depth: 4″ on January 13th and 20th, February 1st and 2nd Days with 1″+ Snow Depth: 17 14th Fewest
Entire Cold Season- October-April Average High: 49.7 27th Warmest Average Low: 33.3 25th Warmest Mean: 41.5 23rd Warmest Precipitation: 29.33″ 3rd Wettest Snowfall: 27.4″ 44th Snowiest Average Snow Depth: 0.2″ 32 or Below Highs: 27 17th Fewest 32 or Below Lows: 106 25th Fewest Measurable Precipitation Days: 91 14th Most Measurable Snowfall Days: 29 16th Most Deepest Snow Depth: 4″ on January 13th and 20th, February 1st and 2nd Days with 1″+ Snow Depth: 20 13th Fewest
Average High By Month October 2018: 65.7 43rd Warmest November 2018: 45.2 8th Coldest December 2018: 44.1 21st Warmest January 2019: 36.6 48th Coldest February 2019: 43.4 25th Warmest March 2019: 47.5 36th Coldest April 2019: 65.4 21st Warmest
Average Low By Month October 2018: 47.2 25th Warmest November 2018: 33.2 28th Coldest December 2018: 30.6 15th Warmest January 2019: 22.2 47th Warmest February 2019: 26.3 33rd Warmest March 2019: 28.7 27th Coldest April 2019: 44.6 12th Warmest
Mean By Month October 2018: 56.5 28th Warmest November 2018: 39.2 14th Coldest December 2018: 37.3 18th Warmest January 2019: 29.4 51st Coldest February 2019: 34.8 30th Warmest March 2019: 38.1 34th Coldest April 2019: 55.0 14th Warmest
Precipitation By Month October 2018: 2.60″ 43rd Wettest November 2018: 5.70″ 4th Wettest December 2018: 3.57″ 30th Wettest January 2019: 3.09″ 47th Wettest February 2019: 5.49″ 6th Wettest March 2019: 5.33″ 15th Wettest April 2019: 3.55″ 54th Wettest
Snowfall By Month October 2018: 0.0″ November 2018: 2.1″ December 2018: 0.4″ January 2019: 11.3″ February 2019: 11.6″ March 2019: 2.0″ April 201: 0.0″
Average Daily Snow Depth By Month October 2018: 0.0″ November 2018: Trace December 2018: 0.0″ January 2019: 1″ February 2019: 0.5″ March 2019: 0.1″ April 2019: 0.0″
Maximum High By Month October: 88 on the 6th and 8th November: 61 on the 1st December: 66 on the 2nd January: 62 on the 8th February: 62 on the 7th March: 75 on the 14th April: 82 on the 11th
Maximum High Records -The 62 on February 7th was a record for the date, beating the old record of 61 set in 1925.
Minimum High By Month October: 49 on the 21st November: 30 on the 28th December: 28 on the 8th January: 11 on the 31st February: 22 on the 1st March: 20 on the 5th April: 43 on the 1st
Minimum High Records -The 33 on November 14th tied the record set in 2014. -The 20 on March 5th tied the record set in 1890.
Maximum Low By Month October: 69 on the 2nd and 9th November: 50 on the 5th December: 46 on the 15th January: 41 on the 8th February: 43 on the 6th March: 51 on the 14th and 29th April: 64 on the 18th
Maximum Low Records -The 69 on October 2nd was a record for the date, beating the old record of 68 set in 1881 and 1884. -The 68 on October 8th tied the record for the date set in 1879. -The 69 on October 9th tied the record for the date set in 1879. -The 68 on October 10th was a record for the date, beating the old record of 66 set in 1879. -The 43 on February 6th was a record for the date, beating the old record of 42 set in 1991. -The 64 on April 18th was a record for the date, beating the old record of 63 set in 1941.
Minimum Low By Month October: 32 on the 22nd and 25th November: 22 on the 10th and 11th December: 16 on the 10th January: -4 on the 30th and 31st February: 9 on the 2nd March: 7 on the 5th April: 24 on the 1st
Highest Daily Precipitation By Month October: 0.63″ on the 31st November: 1.80″ on the 1st December: 1.01″ on the 31st January: 0.81″ on the 19th February: 1.22″ on the 20th March: 1.97″ on the 30th April: 0.77″ on the 19th
Precipitation Records -The 1.80″ on November 2nd was a record for the date, beating the old record of 1.45″ set in 1984. -The 1.01″ on December 31st was a record for the date, beating the old record of 0.89″ set in 1887. -The 0.91″ on February 12th was a record for the date, beating the old record of 0.77″ in 1930. -The 1.97″ on March 30th was a record for the date, beating the old record of 1.47″ set in 1987.
Highest Daily Snowfall By Month October: 0.0″ November: 1.3″ on the 15th December: 0.2″ on the 5th January: 4″ on the 12th February: 4.2″ on the 1st March: 1.9″ on the 3rd April: 0.0″
Deepest Snow Depth By Month October: 0″ November: 1″ December: 0″ January: 4″ on the 13th and 20th February: 4″ on the 1st and 2nd March: 2″ on the 1st April: 0″
Overall, the winter of 2018-2019, while having a few cold spells, was largely warmer than normal. It was also wet and had snowfall near normal.
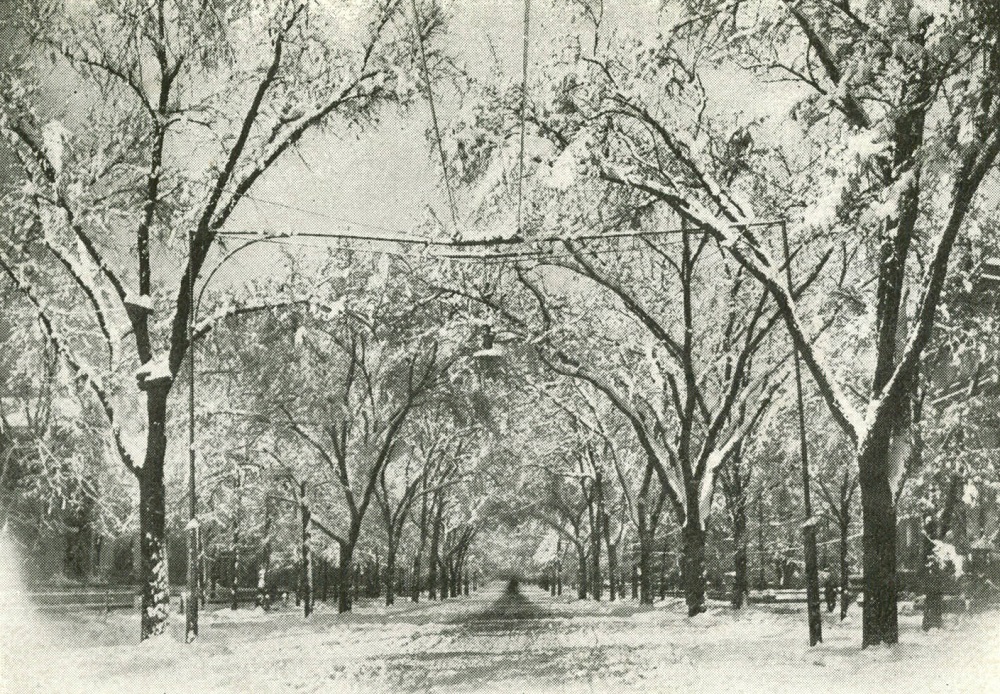
East Broad Street after a snowstorm in March, 1906.
In light of yesterday’s strange storm that challenged local forecasters, I thought it might be time to look at the biggest snowstorms of all time in Columbus, or at least since records began in 1878. I looked up the total snowfall over different periods of time.