Snowiest Christmas Eve in History


Snowiest Christmas Eve in history Columbus, Ohio

White Christmases are pretty rare in the Columbus, Ohio area. An inch or more has fallen on the date only 11 times since 1878. An official White Christmas, however, is defined as having 1″ or more snow on the ground, not necessarily falling on the day itself. That has only happened 21 times since 1939, with only 4 of those times coming since 2000. So these white holidays are relatively rare.

A white Christmas Eve has been even less likely. 1″ or more has been on the ground on December 24th just 16 times since 1939.

Accumulating snow is not all that rare for Christmas Eve. It’s occurred 31 times since 1878, or about once every 4-5 years. So not exactly an annual occurrence, but it happens at least a few times per decade. However, most of those instances were less than 1″ of snow- in fact, 27 of the 31 times were less than 1″. That means 1″ or more of snow has fallen on Christmas Eve just 4 times in the last 142 years, a very rare event indeed.

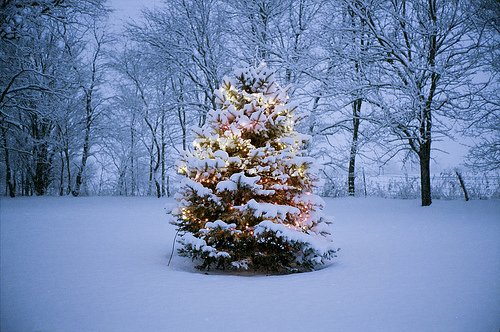
The largest Christmas Eve snowfall until this year was just 2.7″ in 1980. This year’s Christmas Eve snowstorm brought anywhere from 2″-8″ across the Columbus metro area. In Franklin County, 3″-5″ was common. Officially, the airport received 3.4″ on the 24th, which counts as the largest Christmas Eve snowstorm in Columbus history. Snow was still falling lightly Christmas day, so a little more could be added to the final storm total, but another official White Christmas has gone into the books.

To see snowfall reports across the area, check out this map:
https://www.weather.gov/source/crh/snowmap.html?zoom=8&lat=39.5&lon=-82.33&hr=48

And to view other local December and winter weather records, follow the links below.
December Weather Records
Winter Season Records
Current weather and forecasts can be found here: Wilmington National Weather Service


Columbus Halloween Climatology


Columbus' Halloween climatology

Halloween in Columbus has historically not been as volatile as some other holidays. If anything, a bit of rain and chilly temperatures are what ruin the festivities more often than not. This post examines Columbus Halloween climatology across several categories. Data comes from historic records and the Wilmington National Weather Service.

Here are the temperature extremes that have occurred.

Top 10 Coldest Highs
1. 1906: 38
2. 1993: 39
3. 1878, 1895: 40
4. 1913, 1923, 1954: 41
5. 1885, 1917, 2012: 42
6. 1890: 43
7. 1908, 1925, 1926, 2017: 44
8. 1898, 1905: 45
9. 1930, 1976: 46
10. 1879, 1931, 2002: 47

Top 10 Coldest Lows
1. 1887: 20
2. 1962, 1988: 25
3. 1923: 27
4. 1908, 1925: 28
5. 1885, 1893, 1913, 1917, 1953, 1975: 29
6. 1904, 1906: 30
7. 1878, 1938, 1954, 1968: 31
8. 1928, 1934, 1949, 1958, 1964, 1976, 1980, 2000: 32
9. 1879, 1926, 1930, 2017: 33
10.1890, 1936, 1951, 1966, 1969, 1993, 1996, 2002, 2008, 2010: 34

Top 10 Coldest Means
1. 1906, 1923: 34
2. 1913: 35
3. 1878, 1885, 1908, 1917, 1925, 1954: 36
4. 1887, 1962, 1993: 37
5. 1895: 38
6. 1890, 1926, 1976, 1988, 2017 39
7. 1879, 1930, 2012: 40
8. 2002: 41
9. 1893, 1894, 1898, 1905, 1975, 1996: 42
10. 1939, 1955, 2010: 43

Top 10 Warmest Highs
1. 1950: 83
2. 1974: 80
3. 1900: 79
4. 1927, 1933: 78
5. 1979, 2003: 75
6. 1882, 1901, 1982, 1999: 74
7. 1909, 1990: 73
8. 1888, 1935, 1944, 1987 72
9. 1915, 1971: 71
10. 1919: 70

Top 10 Warmest Lows
1. 1919: 61
2. 1882: 60
3. 2003: 59
4. 1927, 1929: 58
5. 1900, 1956, 2013: 57
6. 1921, 1941, 1982, 2018: 56
7. 1950: 55
8. 1959, 1979: 54
9. 1971: 53
10. 1881, 1891, 1933, 1946, 1974, 1991: 52

Top 10 Warmest Means
1. 1950: 69
2. 1900, 1927: 68
3. 1882, 2003: 67
4. 1919, 1974: 66
5. 1933, 1979, 1982: 65
6. 1901, 1929, 1956: 63
7. 1971, 2013: 62
8. 1890, 1999: 61
9. 1909, 1921, 1935, 1941, 1946, 1991, 2018: 60
10. 1984, 2001: 59

Halloween High Temperatures by Occurrence since 1878
Below 40: 2
40-49: 27
50-59: 35
60-69: 59
70-79: 18
80 and Above: 2

Halloween Low Temperature by Occurrence since 1878
Below 20: 0
20-29: 12
30-39: 54
40-49: 51
50-59: 24
60 and Above: 2

And the precipitation extremes.

Top 10 Wettest
1. 2019: 1.51″
2. 1932: 1.44″
3. 2009: 1.21″
4. 2013: 0.98″
5. 1941: 0.97″
6. 1919: 0.91″
7. 2018: 0.63″
8. 1942: 0.51″
9. 1960: 0.45″
10. 1905, 1973: 0.43″

Halloween Precipitation by Amount Occurrence since 1878
None: 78
Trace: 11
0.01-0.24: 37
0.25-0.49: 9
0.50-0.99: 5
1.00 or More: 3

Snow has been very rare for Halloween, especially accumulating snow. 1993 saw the only time that an inch or more of snow fell.

Top 10 Snowiest
1. 1993: 1.0″
2. 1954: 0.2″
3. 1906, 1917, 1926, 1930, 2012, 2019: Trace


Does Fall Weather Correlate to Winter Severity?


winter severity

Republished with data through the 2019-2020 winter.

As we go into the winter season, it’s time to talk about how this one might end up. There’s a belief that fall weather is a good sign of how cold or warm winter will be. Let’s see if that holds true.

First, let’s just look at October temperatures.
The October normal mean temperature for Columbus is 55 degrees.

Between 1878 and 2019, there have been 47 Octobers that featured a mean temperature of 53.9 degrees or lower, what we’re considering a Cold October for the purposes of this comparison.
Of those 47 Octobers, 27 of the 47 had following winters that were colder than normal, or 57.4%, 13 had average temperature winters, or 27.7%, and the remaining 7 were warmer than normal, or 14.9%.
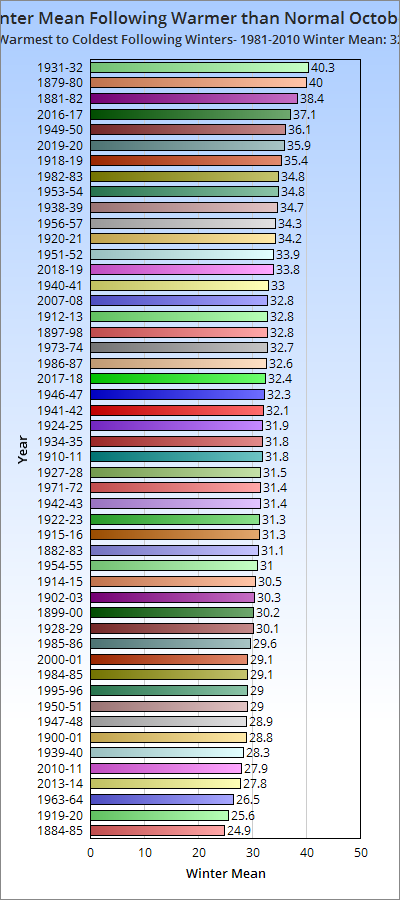
Interestingly, this category contains both the warmest winter on record- 1889-1890 and the coldest on record- 1976-1977- as shown by the chart below.

Next, we look at Normal Octobers, which are +/- 1 degree of the 1981-2010 Average of 55 degrees.
Between 1878 and 2019, there were 45 normal Octobers. Of those, 21 had colder than normal following winters, or 46.7%. 11 were followed by normal winters, or 24.4%, and 13 had warmer than normal winters, or 28.9%.

Finally, let’s look at warm Octobers, which are those with means of 56.1 degrees or higher. There were 49 Octobers with warmer than normal means since 1878. Of those, 18 featured following winters that were colder than normal, or 36.7%. Another 19, or 38.8%, were followed by average winters. The final 12 winters, or 24.5%, were warmer than normal. Here’s the graph.

So just based on the October mean temperature, Octobers that are colder than normal are almost twice as likely as normal Octobers and almost 4x as likely as warm Octobers to be followed by a cold winter. But what about Novembers? It is closer to winter itself, so does its weather matter even more?

Colder than normal Novembers- 43.3 degrees or lower- included 80 Novembers since 1878. Of those, 38 or 47.5% had colder than normal winters. 22 (27.5%) had normal winters and 19, or 23.8%, had warmer than normal winters.

With the 39 normal Novembers, 43.4 to 45.4 degrees, there were 18 that had colder than normal winters, or 46.2%, with 12 normal winters (30.8%) and 9 warmer than normal winters (23.1%).

Finally, there were 24 warmer than normal Novembers since 1878- 45.5 degrees or higher. Only 6, or 25%, were followed by cold winters. An additional 9 (37.5%) were normal, while the last 9 (37.5%) were warmer than normal.

To reiterate, here are the ranked percentages of cold winters by the preceding October or November.
1. Cold Octobers: 57.4%
2. Cold Novembers: 47.5%
3. Normal Octobers: 46.7%
4. Normal Novembers: 46.2%
5. Warm Octobers: 36.7%
6. Warm Novembers: 25.0%

It should be no surprise that cold Octobers and Novembers have a stronger correlation to the following winters also being colder, with colder winters becoming increasingly unlikely as those months warm. What is surprising is that October weather, across the board, was more predictive of cold winters than Novembers were.

Going further, though, what about bi-monthly combinations?

Rank of Bi-Monthly Combinations and the percentage of colder than normal following winters, along with total years in sample:
Normal October/Normal November: 87.5% 8 Years
Cold October/Warm November: 57.1% 7 Years
Cold October/Cold November: 53.8% 26 Years
Normal October/Cold November: 48.1% 27 Years
Warm October/Cold November: 40.7% 27 Years
Cold October/Normal November: 38.5% 13 Years
Warm October/Warm November: 28.6% 7 Years
Warm October/Normal November: 25.0% 16 Years
Normal October/Warm November: 0.0% 8 Years

So a normal fall is clearly the best, but the sample size is not particularly high. Normal to Warm is unanimously warm, but again, it has a small sample size.

So does fall weather ultimately have a correlation to winter severity? To some degree yes, as patterns established in the fall tend to appear in the winter as well, but October, rather than November, has a clear higher correlation. But as with everything, there are many other factors involved.

October 2020 looks to at least begin with below normal temperatures, but it remains to be seen how it ends up.

To see records for Columbus falls and winters going back to 1878, visit the following links.
Autumn Weather Records
Winter Season Records

And to see current local weather and forecasts, visit: Wilmington National Weather Service


The Best and Worst Columbus Summers on Record


Best and worst Columbus summers

Let’s be honest, Summer 2020 is hardly shaping up to be one of swimming pools and BBQs and beach vacations. With the virus continuing to rage nationally, it’s going to be the kind of summer many people watch from their porches or couches. So in that sense, 2020 certainly ranks up there as one of the worst summers ever. On the other hand, there’s probably going to be a bit less concern as to how the weather is. Still, here’s a look back on the best and worst Columbus summers when it comes to weather.

I used a basic ranking system, much like I did with my Worst Winters of All Time post a few years back, to determine the severity of each summer’s weather. Here was the point system I used.

On temperature, I added one point for each of the following:
-# of 86 or Above Highs
-# of 70 or Above Lows
-# of 70 or Below Highs
-# of 50 or Below Lows
Each earned the summer a point for each day that featured these conditions, as either extreme heat or low temperatures during summer are generally considered a negative.

With precipitation, I added one point for each of the following:
-# of days with measurable precipitation.
-# of days with at least 1″+ of precipitation.

The more points a summer got, the worse the weather was overall.

Top 10 Worst Summers
1. 1935: 110
2. 1988: 108
3. 1949: 99
4. 1936, 1944, 1955: 97
5. 2012: 96
6. 1881, 1947, 1980, 1999, 2005: 94
7. 1901, 1916, 1931: 93
8. 1934, 1940, 2018: 91
9. 1941, 1977: 90
10. 1943, 1987: 88

If you like either very hot, very wet or summers with a combination of both conditions, these ones were for you.  It’s no surprise the 1930s and 1940s show up often.  Every summer between 1930 and 1944 had hotter than normal conditions.  No other similar period has matched it.

Top 10 Best Summers
1. 1904: 43
2. 1967, 1971: 44
3. 1922, 1960, 1984: 47
4. 2000: 49
5. 1962: 50
6. 1950, 1981: 51
7. 1884, 1886, 1985: 52
8. 1889, 2009: 53
9. 1929: 56
10. 1905, 1976: 57

If your preference is instead summers with little extreme heat and drier conditions, these were the best.

Now, you might wonder which decade had the best average and worst average summers.

Average Annual Points By Decade
1960s: 64.0
1900s: 66.2
1970s: 67.2
1920s: 67.8
1980s: 70.2
1880s: 70.9
1950s, 2000s: 71.2
1990s: 73.6
1890s: 75.1
1910s: 76.0
2010s: 78.7
1870s: 80.0
1930s: 81.9
1940s: 85.9

The 1960s had the best average score, with the 1940s easily claiming the top prize for worst.  Perhaps unsurprisingly, the 2010s featured more crappy ones than not.

To see a lot more summer and other weather records, check out:
Summer Season Records
Wilmington National Weather Service


Updates!


There have been a lot of updates and additions to the site in the last month.

The Historic Building Database pages now contain more than 1,200 buildings.

A new Local Sports History page has been added under the History tab. It contains information on Columbus’ college, minor and major league sports teams going back to the 19th Century.

The May Weather page has been updated with 2020 data, and records can be viewed back to 1879.

The numerous severe weather pages have all been updated to some degree over the past month or so with more links, events and even videos.

The Demographics and Population pages have been updated with 2019 population data, as well as various information related to income, GDP, housing and more!

Finally, a new Columbus Crime Statistics page has been added under the Demographics and Population tab. You can view total crimes, crime rates and maps going back to 1985.