German Village dates back to the early 19th Century, when it was sometimes called called Germantown. Unsurprisingly, by the middle of the 20th Century, the neighborhood had declined significantly, yet still retained the vast majority of its historic buildings. The city of Columbus had it in mind to bulldoze a large part of the neighborhood in the 1950s for public housing, but activists organized against those plans. Instead, in what was one of the first major success stories of Columbus preservation, German Village was saved. The entire area was eventually added onto the National Register of Historic Places in 1975, and today it is still the largest historic district on the registry anywhere in the United States. Here are just a few before and after photos around the neighborhood.
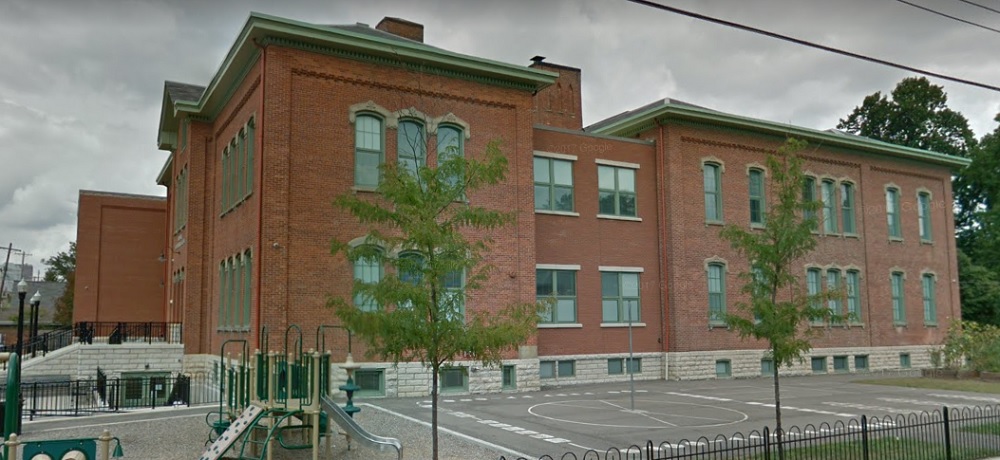
Before: Stewart Avenue Elementary School, looking northeast, in 1920. After: 2017 The school was constructed in 1873 and remains in use today, one of the oldest continuous schools remaining in the city.
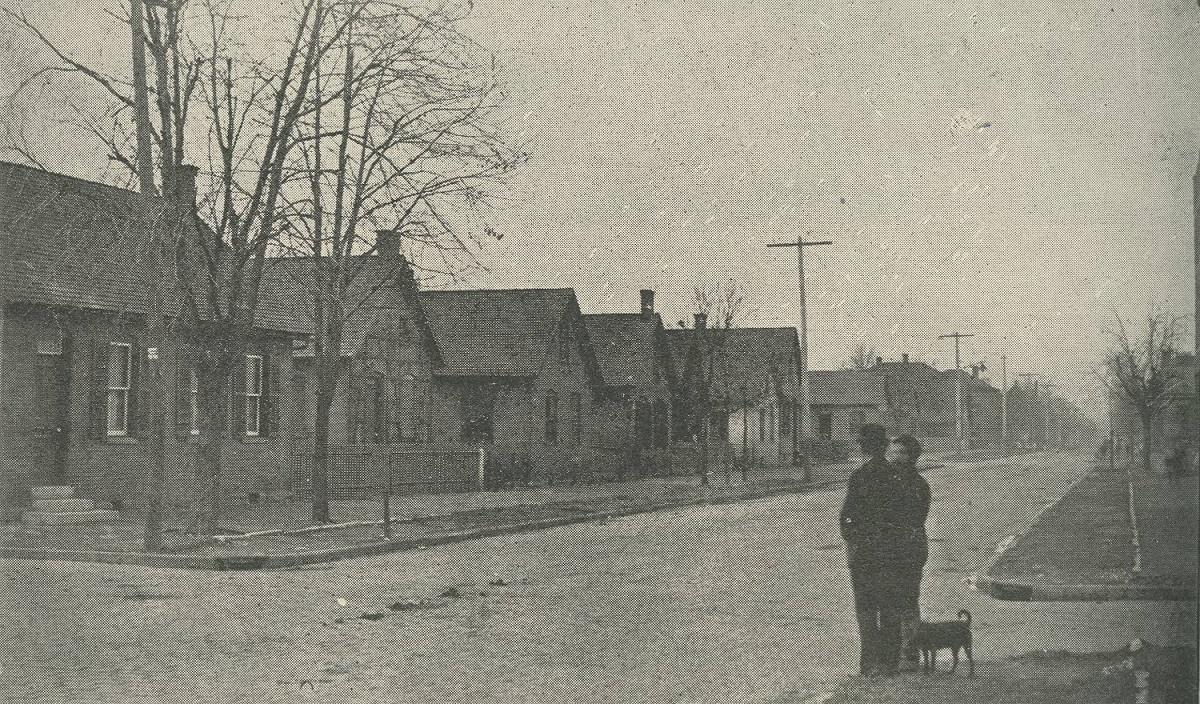
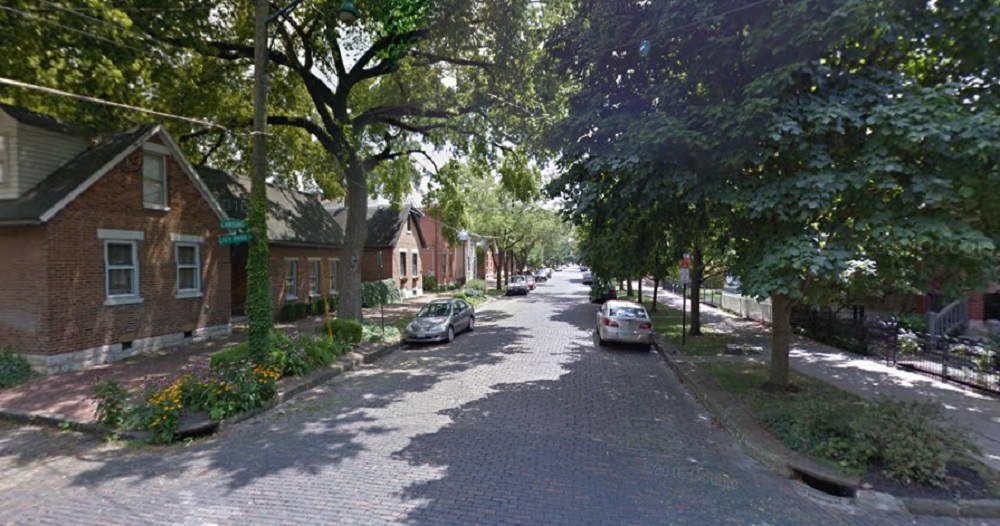
Before: City Park Avenue at Lansing Street, looking south, in 1898. After: 2016
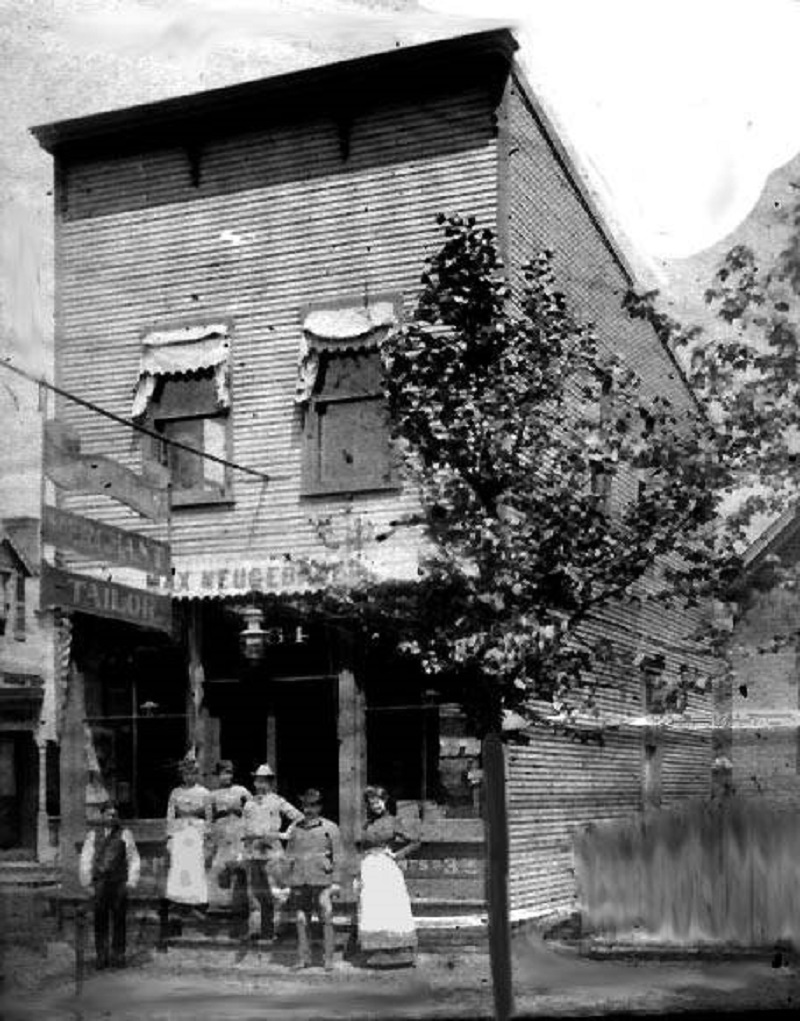
Before: The Max Neugebauer Tailor Shop at 764 Mohawk Street in 1897. After: 2016 Neugebauer arrived in Columbus in 1887, but it’s unclear when he opened this business.
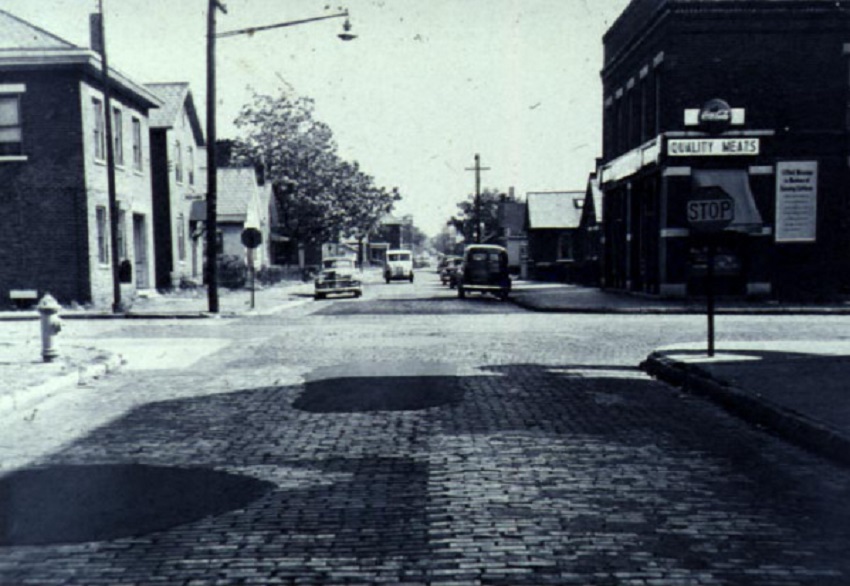
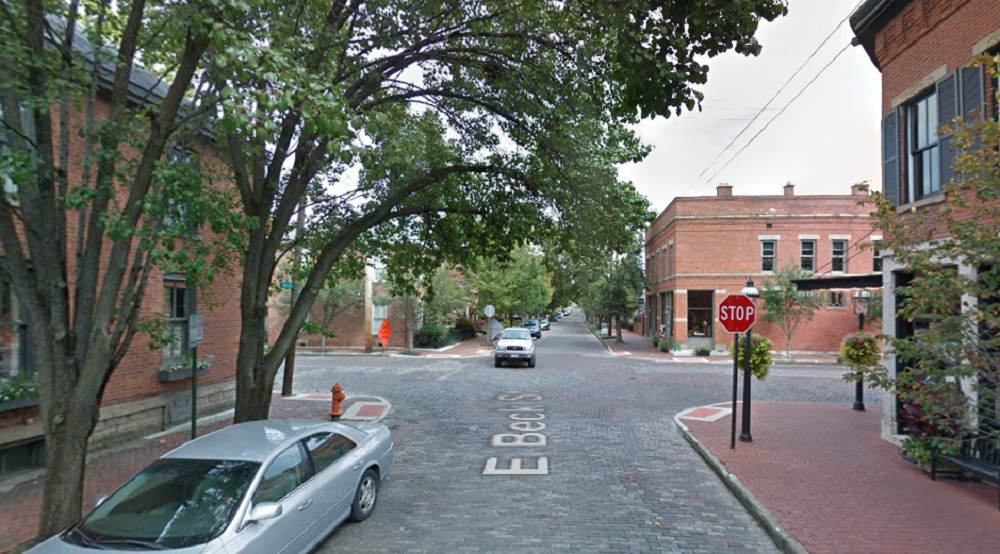
Before: Beck Street and Mohawk, looking east, in 1950. After: 2017 German Village was considered a “slum” by 1950, so the before photo would’ve been around the time of the neighborhood’s low point.
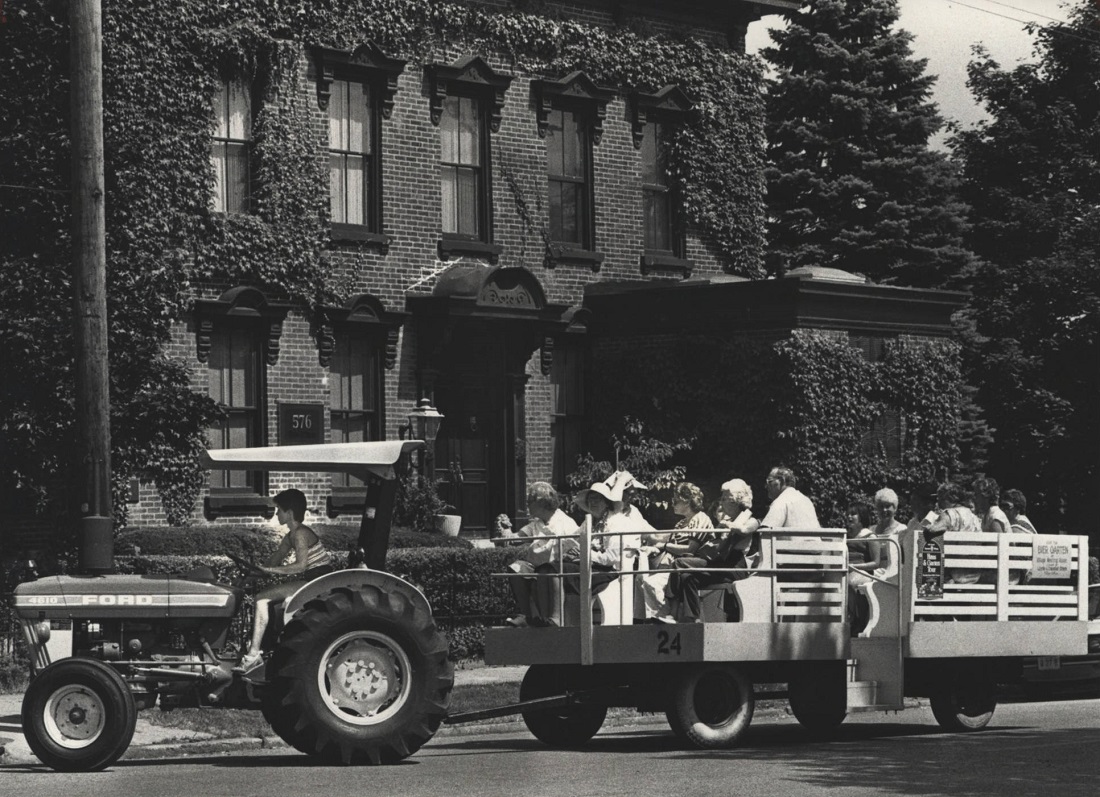
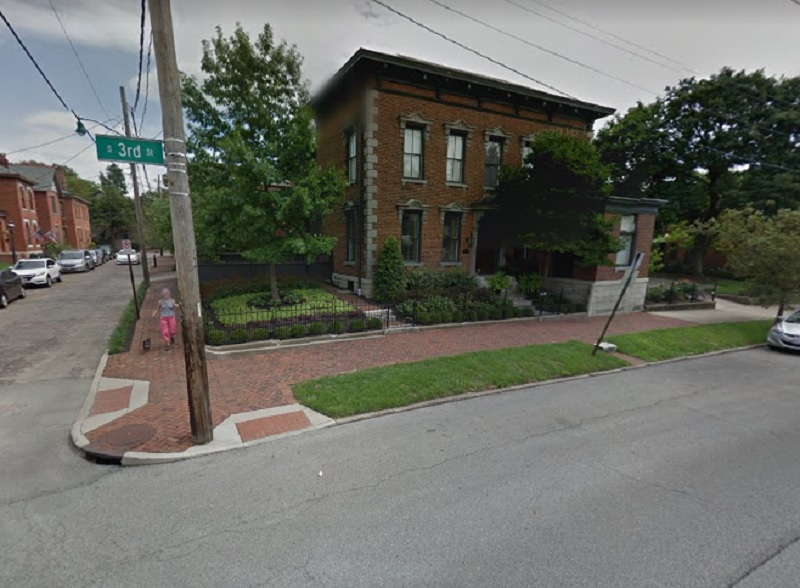
Before: Third Street and Beck, looking east, in 1981. After: 2016 The photo shows a German Village “Haus and Garten Tour” through the neighborhood.
What most of Winter 2016-2017 looked like in Ohio.
The Winter 2016-2017 Review supports that the season was one of the warmest, least snowy winters on record. Depending on your viewpoint, that was either a really good or really bad thing.
Temperature and snowfall ranking data goes back to the winter of 1878-1879. Snow depth ranking data goes back to 1940.
December-February Only Average High: 44.4 7th Warmest Average Low: 29.5 6th Warmest Mean: 37.0 6th Warmest Precipitation: 8.55″ 49th Wettest Snowfall: 7.6″ 13th Least Snowy Average Daily Snow Depth: 0.1″ 2nd Lowest 32 or Below Highs: 17 11th Fewest 32 or Below Lows: 54 5th Fewest Measurable Precipitation Days: 43 10th Most Measurable Snowfall Days: 10 6th Fewest Deepest Snow Depth: 3″ on December 14th Days with 1″+ Snow Depth: 7 5th Fewest
Entire Cold Season: October-April Average High: 54.8 1st Warmest Average Low: 36.7 5th Warmest Mean: 45.8 1st Warmest Precipitation: 19.28″ 67th Driest Snowfall: 9.3″ 8th Least Snowy Average Snow Depth: 0.1″ 2nd Lowest 32 or Below Highs: 18 8th Fewest 32 or Below Lows: 80 5th Fewest Measurable Precipitation Days: 86 19th Most Measurable Snowfall Days: 15 6th Fewest Deepest Snow Depth: 3″ on December 14th Days with 1″+ Snow Depth: 8 5th Fewest
Average High By Month October 2016: 69.3 17th Warmest November 2016: 57.7 7th Warmest December 2016: 38.7 38th Coldest January 2017: 43.5 14th Warmest February 2017: 51.8 1st Warmest March 2017: 52.1 36th Warmest April 2017: 71.1 1st Warmest
Average Low By Month October 2016: 49.1 14th Warmest November 2016: 36.3 26th Warmest December 2016: 26.2 50th Coldest January 2017: 30.1 8th Warmest February 2017: 32.6 4th Warmest March 2017: 34.1 32nd Warmest April 2017: 48.3 1st Warmest
Mean By Month October 2016: 59.2 12th Warmest November 2016: 47.0 13th Warmest December 2016: 32.4 44th Coldest January 2017: 36.8 12th Warmest February 2017: 42.2 1st Warmest March 2017: 43.1 35th Warmest April 2017: 59.7 1st Warmest
Precipitation By Month October 2016: 1.73″ 45th Driest November 2016: 1.02″ 13th Driest December 2016: 3.09″ 49th Wettest January 2017: 2.83″ 53rd Wettest February 2017: 2.63″ 51st Wettest March 2017: 5.39″ 15th Wettest April 2017: 2.59″ 44th Driest
Snowfall By Month October 2016: 0.0″ Least Snowy November 2016: Trace 2nd Least Snowy December 2016: 5.4″ 40th Snowiest January 2017: 1.6″ 13th Least Snowy February 2017: 0.6″ 4th Least Snowy March 2017: 1.7″ 27th Least Snowy April 2017: Trace 2nd Least Snowy
Average Snow Depth By Month October 2016: 0″ November 2016: 0″ December 2016: 0.3″ January 2017: Trace February 2017: 0.1″ March 2017: Trace April 2017: 0″
Maximum High By Month October 2016: 83 on the 18th November 2016: 80 on the 1st December 2016: 69 on the 26th January 2017: 67 on the 12th February 2017: 78 on the 24th March 2017: 77 on the 30th April 2017: 85 on the 26th and 30th
Record Highs -The 83 on October 18th tied the record for the date set in 1938. -The 80 on November 1st tied the record for the date set in 1950. This is also a tie for the warmest temperature ever recorded in November. -The 79 on November 2nd tied the record for the date set in 1897. -The 75 on November 18th was a record for the date, beating the old record of 73 set in 1954. -The 69 on November 26th was a record for the date, beating the old record of 62 set in 1889 and 1982. -The 67 on January 12th tied the record for the date set in 1916. -The 64 on January 17th was a record for the date, beating the old record of 62 set in 1952. -The 66 on February 18th was a record for the date, beating the old record of 63 set in 2011. -The 72 on February 23rd was a record for the date, beating the old record of 66 set in 1905 and 1986. -The 78 on February 24th was a record for the date in 3 ways: 1. It beat the old daily record of 72 set in 1961. 2. It beat the record for the warmest February temperature ever of 75 set on 2/26/2000. 3. It broke the record for the warmest temperature for meteorological winter (Dec-Feb) of all-time, beating the old record of 76 set on 12/3/1982.
Minimum High By Month October 2016: 52 on the 22nd November 2016: 35 on the 20th December 2016: 14 on the 15th January 2017: 16 on the 6th and 7th February 2017: 25 on the 3rd March 2017: 29 on the 14th April 2017: 49 on the 1st
Maximum Low By Month October 2016: 69 on the 18th November 2016: 56 on the 2nd December 2016: 48 on the 26th January 2017: 47 on the 17th February 2017: 59 on the 24th March 2017: 58 on the 25th April 2017: 63 on the 16th and 19th
Record Maximum Lows -The 69 on October 18th was a record for the date, beating the old record of 65 set in 2007. -The 54 on February 22nd was a record for the date, beating the old record of 51 set in 1930. -The 52 on February 23rd was a record for the date, beating the old record of 51 set in 1930. -The 59 on February 24th was a record for the date, beating the old record of 50 set in 2000. -The 58 on March 25th tied the record for the date set in 1949.
Minimum Low By Month October 2016: 35 on the 25th November 2016: 21 on the 22nd December 2016: 4 on the 15th and 16th January 2017: 6 on the 7th February 2017: 9 on the 4th March 2017: 15 on the 15th April 2017: 32 on the 8th
Highest Daily Precipitation By Month October 2016: 0.74″ on the 19th November 2016: 0.36″ on the 28th December 2016: 1.07″ on the 17th January 2017: 0.80″ on the 3rd February 2017: 0.76″ on the 7th March 2017: 1.53″ on the 26th April 2017: 0.80″ on the 9th
Highest Daily Snowfall By Month October 2016: 0.0″ November 2016: Trace on the 19th and 20th December 2016: 3.2″ on the 13th January 2017: 0.9″ on the 5th February 2017: 0.6″ on the 8th March 2017: 0.6″ on the 13th April 2017: Tract on the 6th and 7th
Deepest Snow Depth By Month October 2016: 0″ November 2016: 0″ December 2016: 3″ on the 14th January 2017: 1″ on the 6th February 2017: 1″ on the 9th and 10th March 2017: 1″ on the 14th April 2017: 0″
I haven’t done a Before and After installment for a while. This time around, I chose to not focus on any single neighborhood.
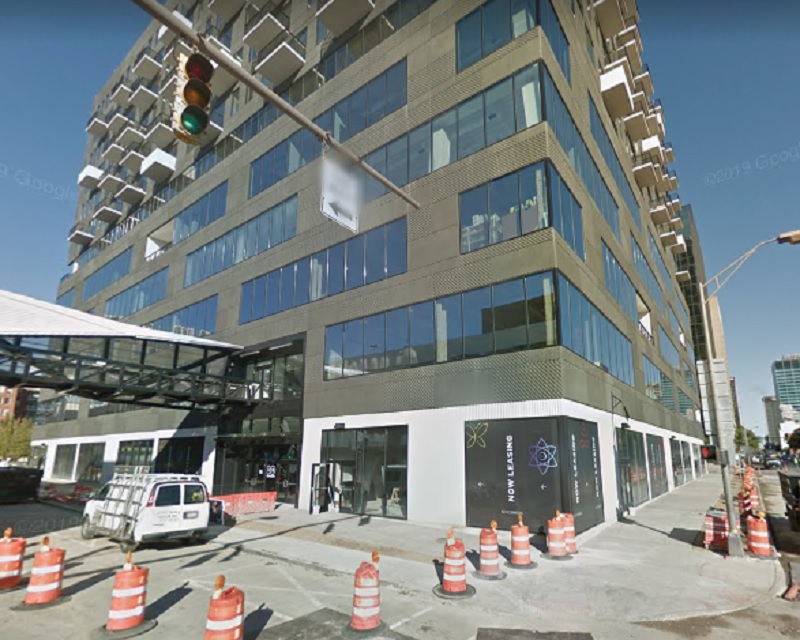
First up is a photo of the construction of the Columbus Interurban Terminal, looking northwest from 3rd. The photo was taken on October 5, 1911, about 3 months before the building opened. The interurban system was relatively short-lived in the city, and the terminal closed after only 26 years in 1938. The building survived as a grocery store through the mid-1960s before the building was demolished in 1967 as part of the construction of the Greyhound Bus Terminal across the street. The actual location of the building was not on the Greyhound site, but was used as an overflow parking lot. It remained a parking lot until the mid-1980s, when it became part of the City Centre Mall site. Today, plans are for the site to become the location for the 12-story, 80 on the Commons mixed-use project.
October, 1911.
Here is the same place in October, 2018.
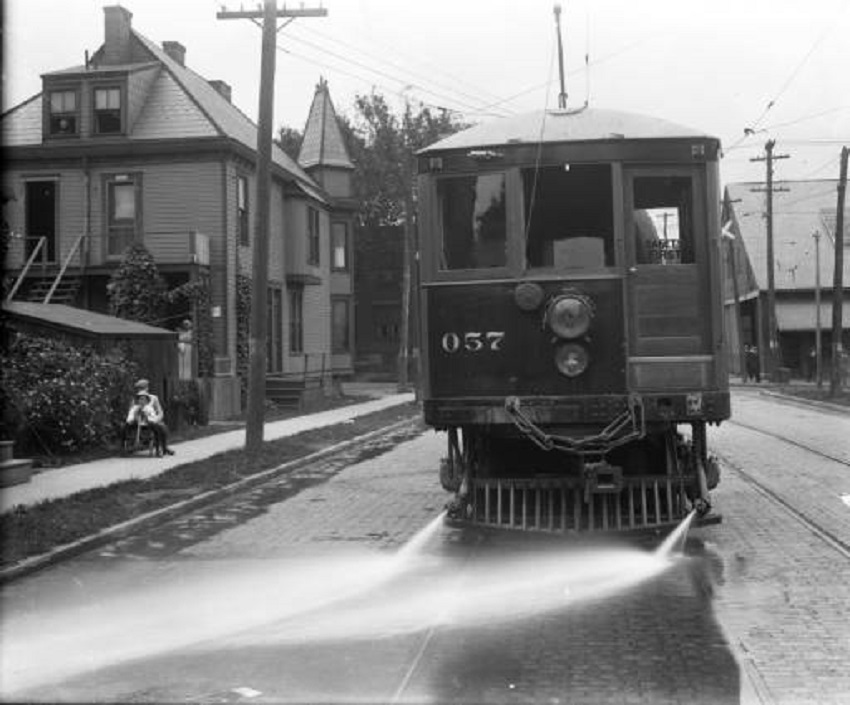
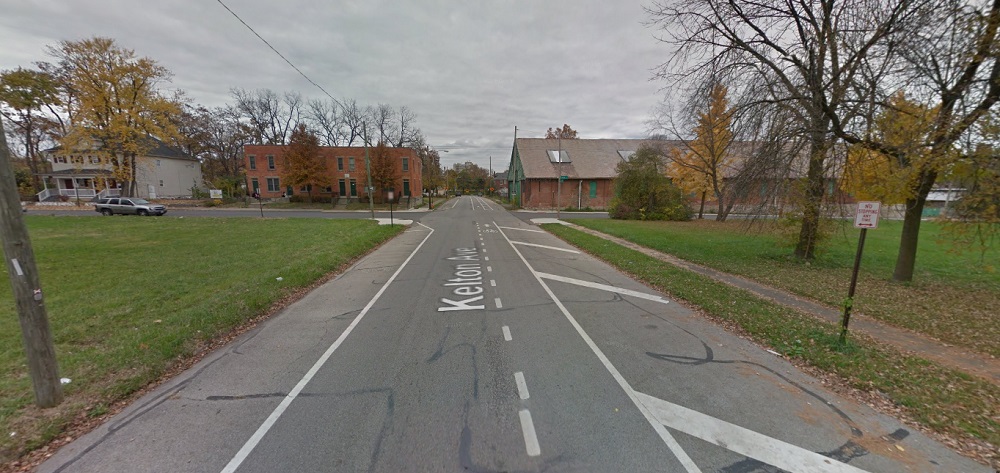
The second historic photo is of the #57 streetcar on Kelton Avenue just south of the Oak Street intersection. The photo, which looks north, was taken on June 30, 1915 and includes 3 separate visible buildings as well. The house on the left actually survived until 1977, when it and the rest of the east half of the block was demolished. The building visible on the right is the surviving streetcar barn. Today, it is in bad shape, and while many would like to see it renovated and saved, time seems to be running out. The other surviving building, barely visible in the 1915 photo, is the tenement building on the northwest corner of Oak and Kelton. And in 2015:
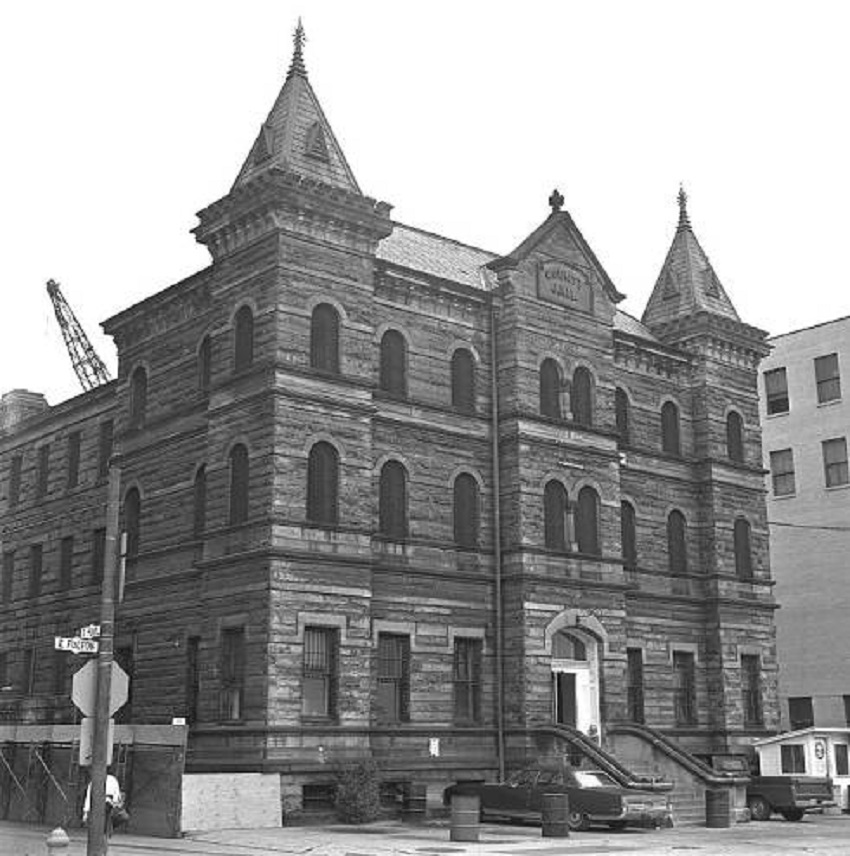
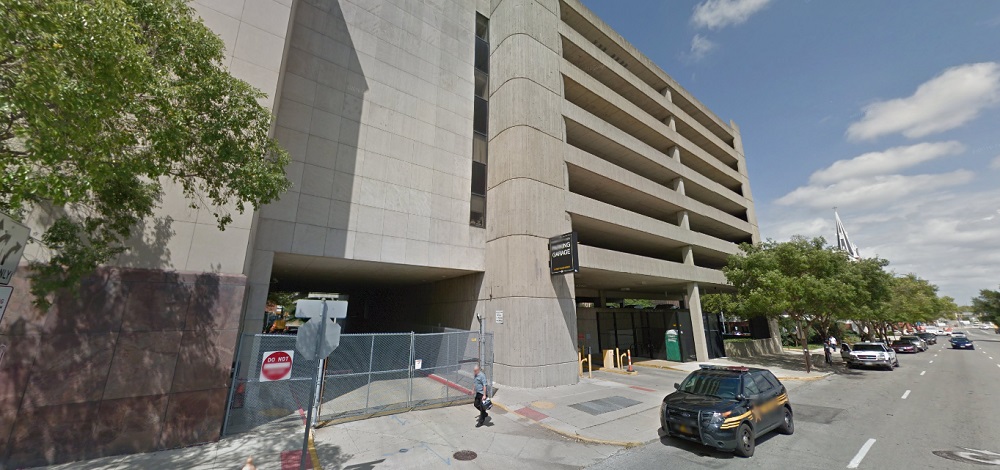
Third in this list is a photo of the demolition of the old Franklin County Jail, once located at 36 E. Fulton Street in Downtown. Built in 1889, the structure survived until the fall of 1971, when the building, which by then had become outdated for its intended purpose, was torn down to make way for- what else- a parking garage. The parking garage remains to the present day. Columbus leaders at the time should’ve been flogged for such short-sighted thinking, something that was repeated over and over and over again during that era. Today, such a very cool, unique building would’ve made an excellent candidate for mixed-use conversion. And in August, 2016:
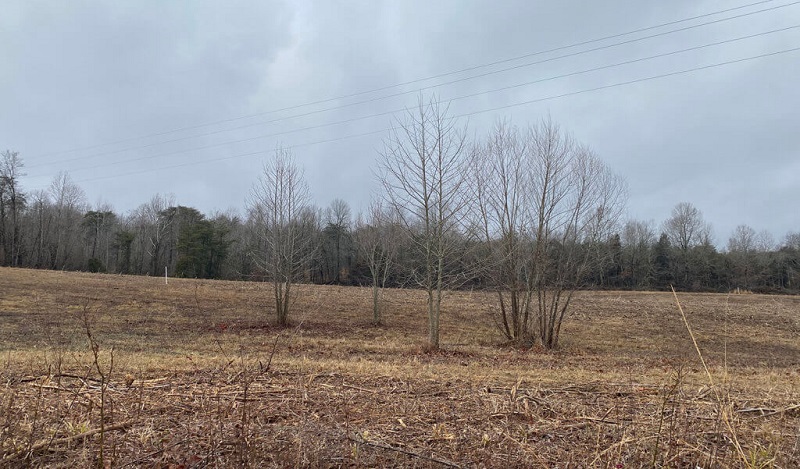
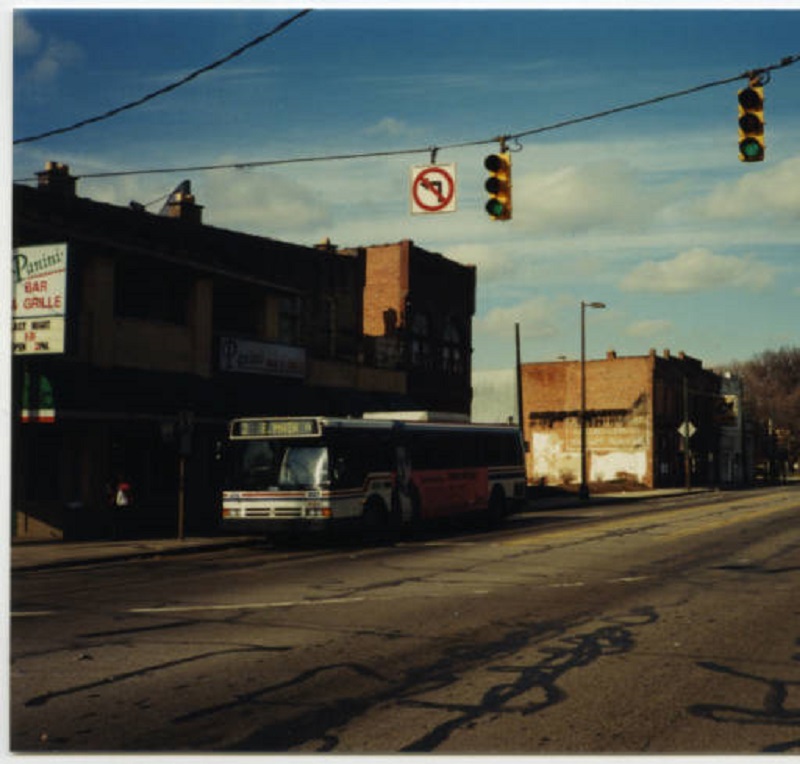
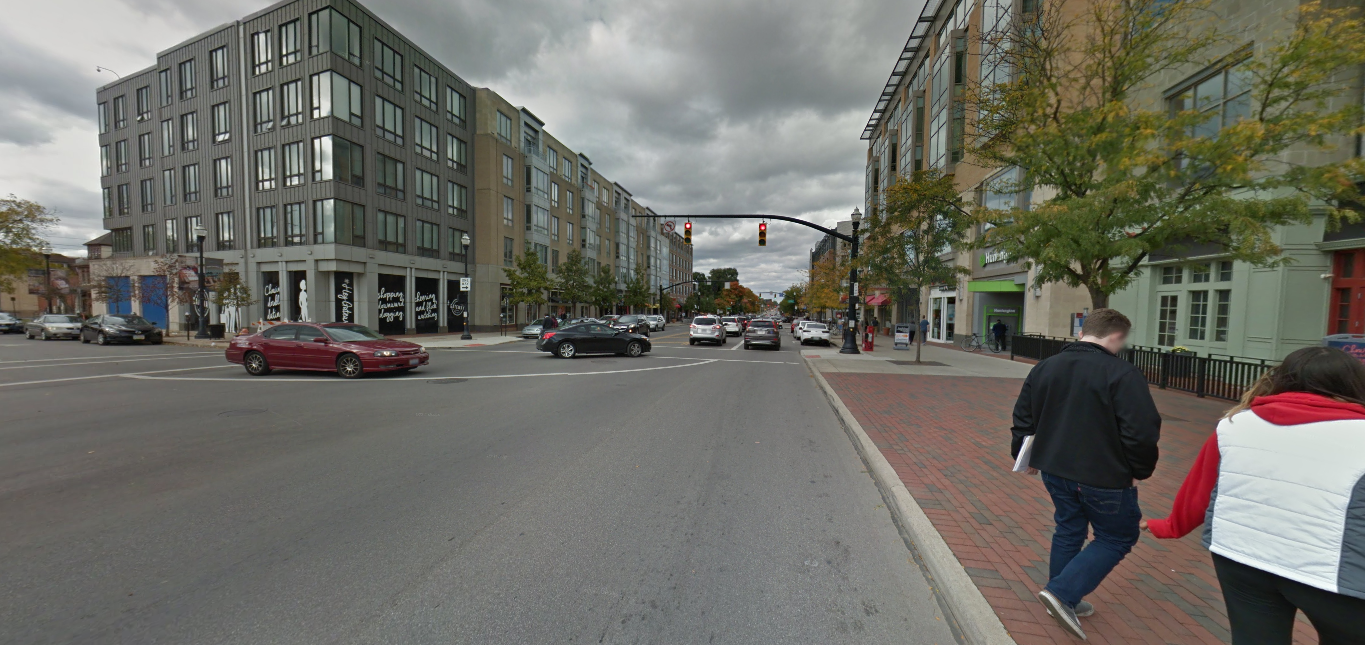
Finally, this next photo isn’t really historic. It was taken a mere 15 years ago in February, 2002, looking northwest from the corner of N. High Street and 10th Avenue. At the time, this area had been made up of low-rise historic buildings that had long held bars for OSU students. All these buildings in the photo, and many more, were demolished not long after the photo was taken in order to make room for the South Campus Gateway, now more or less just called the Gateway. Similar large-scale demolitions are taking place to the north and south as the entirety of the High Street corridor around Campus is transformed. Whether that is good or bad depends on who you ask. What can be agreed upon, however, is that the corridor will be almost unrecognizable in the end. And in October, 2016:
I saw this postthe other day about changing neighborhood demographics in certain cities, particularly when it comes to racial segregation and gentrification. Surprisingly, of all the maps and posts I’ve done on demographics, I hadn’t thought to do one that showed Franklin County gentrification trends. Well, now I have.
A bit of an explanation is needed for the color coding: -For those categories marked “Steady”, the demographic listed has been the majority throughout the period, with little to no change of other demographics. -For those mixed categories of one decline and one rise, it means that the majority demographic has declined at least 5 percentage points, while a secondary demographic has risen at least 5 percentage points. -For the category of recent or steady integration, there are at least 2 demographics at 10% or more of the total population, as well as a 3rd demographic reaching at least 5% of the population.
A few things that stand out to me: The eastern half of the county is in much greater flux than the western half, and integration is respectable county-wide. These neighborhoods of demographic equilibrium are largely the result of increasing Hispanic and Asian populations, particularly on the Northeast and West Sides, as well as the Whitehall area. In the center core, almost all of the High Street corridor has remained Steady White, suggesting that other demographics have, so far, been unable to tap into the building boom along and adjacent to this corridor. One other thing I notice is that there are FAR more tracts with a growing black population than there are with a growing White population, suggesting that perhaps the idea of Whites moving into neighborhoods and displacing residents is not quite as big of an issue as some might believe.
Here are the integrated tracts by year, based the above criteria, and their racial breakdown.
Breakdown of # of Tracts by % of Hispanic Population 1990 95% or Higher: 0 90%-94.9%: 0 80%-89.9%: 0 70%-79.9%: 0 60%-69.9%: 0 50%-59.9%: 0 Total Majority Hispanic Tracts: 0 40%-49.9%: 0 30%-39.9%: 0 20%-29.9%: 0 10%-19.9%: 0 0.1%-9.9%: 278 0%: 5 2015 95% or Higher: 0 90%-94.9%: 0 80%-89.9%: 0 70%-79.9%: 0 60%-69.9%: 0 50%-59.9%: 0 Total Majority Hispanic Tracts: 0 40%-49.9%: 0 30%-39.9%: 1 20%-29.9%: 7 10%-19.9%: 33 0.1%-9.9%: 241 0%: 9
Integrated Tracts By Year 1990: 2 2015: 98
Most Integrated Tract by Year 1990 1122: White: 76.6% Black: 9.6% Asian: 11.2% Hispanic: 2.5% 2015 7721: White: 33.9% Black: 31.2% Asian: 26.8% Hispanic: 10.1%
All in all, the data shows that the county is much less racially stratified/segregated now than it was in 1990, and that it doesn’t appear that gentrification is really affecting many areas in terms of forcing out one racial group for another.
The recent housing market update January 2017 edition information comes from Columbus Realtors.
Note: LSD= Local School District, CSD= City School District. In both cases, school district boundaries differ from city boundaries.
Top 15 Most Expensive Locations By Median Sales Price in January 2017 1. New Albany: $535,000 2. New Albany Plain LSD: $397,450 3. German Village: $376,000 4. Powell: $354,950 5. Dublin: $343,600 6. Granville CSD: $330,000 7. Bexley: $325,000 8. Upper Arlington CSD: $319,500 9. Olentangy LSD: $315,000 10. Big Walnut LSD: $306,250 11. Dublin CSD: $271,500 12. Worthington: $270,000 13. Buckeye Valley LSD: $259,000 14. Sunbury: $253,000 15. Downtown: $243,750
Top 15 Least Expensive Locations by Median Sales Price in January 2017 1. Obetz: $80,100 2. Hamilton LSD: $80,100 3. Whitehall: $85,950 4. Newark CSD: $86,900 5. Lancaster CSD: $103,000 6. Jefferson LSD: $123,000 7. London CSD: $124,000 8. Groveport Madison LSD: $125,900 9. Reynoldsburg CSD: $125,950 10. Columbus CSD: $129,900 11. South-Western CSD: $131,000 12. Columbus: $140,026 13. Jonathan Alder LSD: $150,000 14. Minerva Park: $159,500 15. Grove City: $160,950
Overall Market Median Sales Price in January 2017: $160,368 Median Sales Price Change January 2016-January 2016: +$3,172
Top 15 Locations with the Highest Median Sales Price % Growth Between January 2016 and January 2017 1. Whitehall: +69.5% 2. Circleville CSD: +64.9% 3. Sunbury: +63.0% 4. Jefferson LSD: +53.5% 5. Big Walnut LSD: +44.1% 6. Canal Winchester CSD: +40.9% 7. Westerville: +29.8% 8. Westerville CSD: +27.3% 9. Powell: +25.4% 10. Pataskala: +24.0% 11. Olentangy LSD: +23.5% 12. Gahanna Jefferson CSD: +21.8% 13. Grandview Heights: +21.2% 14. Granville CSD: +20.0% 15. Pickerington: +17.7%
Top 15 Locations with the Lowest Median Sales Price % Growth Between January 2016 and January 2017 1. London CSD: -53.5% 2. Obetz: -38.3% 3. Hamilton LSD: -27.1% 4. Jonathan Alder LSD: -25.2% 5. Buckeye Valley LSD: -23.0% 6. Reynoldsburg CSD: -18.7% 7. Hilliard: -17.7% 8. Lancaster CSD: -17.6% 9. Grove City: -15.3% 10. Dublin CSD: -12.8% 11. Johnstown-Monroe LSD: -10.8% 12. Upper Arlington CSD: -8.5% 13. Newark CSD: -8.1% 14. Dublin: -7.1% 15. South-Western CSD: -6.4%
Overall Market Median Sales Price % Change January 2016-January 2017: +2.0%
Top 10 Locations with the Most New Listings in January 2017 1. Columbus: 829 2. Columbus CSD: 544 3. South-Western CSD: 136 4. Olentangy LSD: 122 5. Westerville CSD: 100 6. Hilliard CSD: 94 7. Dublin CSD: 89 8. Worthington CSD: 66 9. Dublin: 64 10. Pickerington LSD: 60
Top 10 Locations with the Fewest New Listings in January 2017 1. Valleyview: 0 2. Lithopolis: 1 3. Minerva Park: 2 4. Sunbury: 2 5. Obetz: 3 6. Johnstown Monroe LSD: 5 7. Jefferson LSD: 8 8. Jonathan Alder LSD: 8 9. German Village: 8 10. Hamilton LSD: 8 11. Northridge LSD: 9
Total New Listings in the Columbus Metro in January 2017: 2,002 Overall Metro New Listings % Change January 2016-January 2017: -1.9%
Top 10 Fastest-Selling Locations by # of Days Homes Remain on the Market Before Sale in January 2017 1. Obetz: 18 2. Sunbury: 21 3. Pataskala: 22 4. Jefferson LSD: 26 5. Gahanna: 28 6. Minerva Park: 28 7. Delaware CSD: 29 8. Bexley: 31 9. Hilliard CSD: 31 10. Pickerington: 31 11. Worthington CSD: 31
Top 10 Slowest-Selling Locations by # of Days Homes Remain on the Market Before Sale in January 2017 1. Dublin: 96 2. New Albany: 93 3. Dublin CSD: 82 4. Powell: 80 5. Granville CSD: 79 6. Olentangy LSD: 78 7. Downtown: 77 8. Grandview Heights: 76 9. New Albany Plain LSD: 68 10. Canal Winchester CSD: 67 11. New Albany CSD: 65 12. Upper Arlington CSD: 62 13. Circleville CSD: 61 14. Johnstown Monroe LSD: 61 15. Hamilton LSD: 60
# of Days For-Sale Homes Remain on the Market Before Sale Across the Metro Overall: 51.6 Change in # of Days Before Sale January 2016-January 2017: -22.0
Top 10 Locations with the Greatest % Decline of # of Days on the Market Before Sale January 2016-January2017 1. Obetz: -89.2% 2. Pataskala: -64.5% 3. Whitehall: -64.3% 4. Circleville CSD: -56.1% 5. Gahanna: -53.3% 6. Grove City: -49.2% 7. Delaware CSD: -44.2% 8. Bexley: -40.4% 9. Pickerington LSD: -39.7% 10. Worthington CSD: -38.0%
Top 10 Locations with the Lowest % Decline of # of Days on the Market Before Sale January 2016-January 2017 1. German Village: +161.1% 2. Worthington: +123.8% 3. Powell: +77.8% 4. Grandview Heights: +46.2% 5. Big Walnut LSD: +41.5% 6. Minerva Park: +40.0% 7. Jonathan Alder LSD: +37.8% 8. Canal Winchester CSD: +31.4% 9. Marysville CSD: +28.3% 10. Johnstown Monroe LSD: +27.1%
% Change for the # of Days Homes Remain on the Market Before Sale Across the Metro Overall: -29.9%